Team:LMU-Munich/Data/Constitutive
From 2012.igem.org
| (30 intermediate revisions not shown) | |||
| Line 1: | Line 1: | ||
{{:Team:LMU-Munich/Templates/Page Header|File:Team-LMU_Photo2.jpg}} | {{:Team:LMU-Munich/Templates/Page Header|File:Team-LMU_Photo2.jpg}} | ||
| - | |||
| - | [[ | + | [[Image:BacillusBioBrickBox.png|100px|right|link=Team:LMU-Munich/Team:LMU-Munich/Bacillus_BioBricks]] |
| - | + | ||
| - | + | ||
| - | <p align="justify"> | + | ==Constitutive ''Bacillus'' Promoters== |
| + | <br> | ||
| + | ===Luminescence measurements=== | ||
| + | <br> | ||
| + | <p align="justify"> | ||
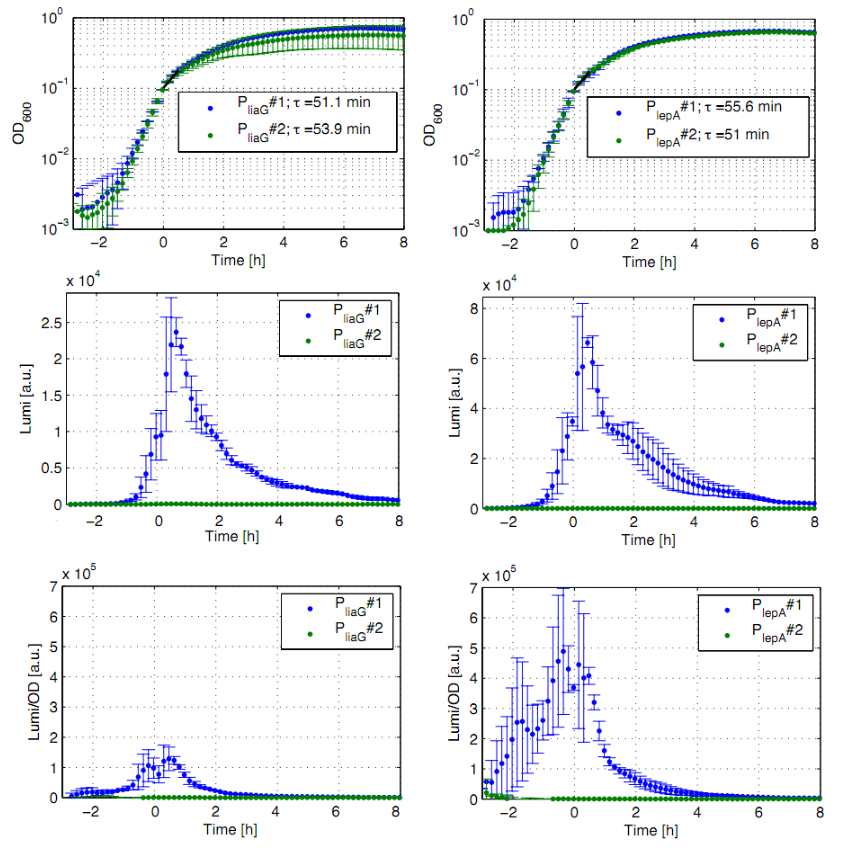
| + | The constitutive promoters '''P<sub>''liaG''</sub>''' and '''P<sub>''lepA''</sub>''' were evaluated in the reporter vector pSB<sub>Bs</sub>3C-<i>luxABCDE</i>, which contains the ''lux'' operon [[File:Lux operon.png|100px]]. The promoter activity results in gene expression and production of the protein luciferase. The luminescence produced by this protein can be measured with the plate reader ''Synergy2'' ([http://www.biotek.com/ BioTek]) (Fig. 1). </p> | ||
| + | {| style="color:black;" cellpadding="3" width="70%" cellspacing="0" border="0" align="center" style="text-align:left;" | ||
| + | | style="width: 70%;background-color: #EBFCE4;" | | ||
| + | {| | ||
| + | |[[File:Auswertung_plate_reader_andere_promotoren.png|400px]] | ||
| + | |- | ||
| + | | style="width: 70%;background-color: #EBFCE4;" | | ||
| + | {| style="color:black;" cellpadding="0" width="100%" cellspacing="0" border="0" align="center" style="text-align:center;" | ||
| + | |style="width: 70%;background-color: #EBFCE4;" | | ||
| + | <font color="#000000"; size="2"><p align="justify">'''Fig. 1: Luminescence measurement of the constitutive ''Bacillus'' promoters P<sub>''liaG''</sub> and P<sub>''lepA''</sub> in the reporter vector pSB<sub>''Bs''</sub>3C-''luxABCDE'''''. OD<sub>600</sub> (up), LUMI (middle) and LUMI per OD<sub>600</sub> (down) depending on the time (h) are shown for two different clones (green/blue). Data derive from three independent experiments, the graphs show the mean fo the three experiments and the standard deviation. Curves were fitted over each other (t=0, OD<sub>600</sub>=0.3) and smoothed by taking the average of three neighboring values.</p></font> | ||
| + | |} | ||
| + | |} | ||
| + | |} | ||
| + | <p align="justify">All clones show a normal growth behaviour. The activity of both promoters increases during transition from log to stationary phase. P<sub>''liaG''</sub> has an activity maximum of about 100.000 Lumi/OD<sub>600</sub>. P<sub>''lepA''</sub> shows a maximum of about 400.000 Lumi/OD<sub>600</sub>. Comparing these two constitutive promoters, the activity of P<sub>''lepA''</sub> is about four times higher than the activity of P<sub>''liaG''</sub>. In the late stationary phase the activity completely disappears. The second clone of the promoters P<sub>''lepA''</sub> and P<sub>''liaG''</sub> did not show any luminescence activity. Therefore, additional clones need to be measured.</p> | ||
| - | <p align="justify">The β galactosidase assay of the | + | |
| + | ===β-galactosidase assays=== | ||
| + | <br> | ||
| + | <p align="justify"> The two constitutive promoters '''P<sub>''liaG''</sub>''' and '''P<sub>''veg''</sub>''' were evaluated with the reporter vector pSB<sub>''Bs''</sub>1C-''lacZ'', which contains the ''lacZ'' reporter gene [[File:LacZ.png|50px]] (Fig. 2).</p> | ||
| + | <br> | ||
| + | {| style="color:black;" cellpadding="3" width="70%" cellspacing="0" border="0" align="center" style="text-align:left;" | ||
| + | | style="width: 70%;background-color: #EBFCE4;" | | ||
| + | {| | ||
| + | |[[File:Englisch_Auswertung_PliaG_Pveg.png|400px]] | ||
| + | |- | ||
| + | | style="width: 70%;background-color: #EBFCE4;" | | ||
| + | {| style="color:black;" cellpadding="0" width="100%" cellspacing="0" border="0" align="center" style="text-align:center;" | ||
| + | |style="width: 70%;background-color: #EBFCE4;" | | ||
| + | <font color="#000000"; size="2"><p align="justify"> '''Fig. 2: β-galactosidase assay and growth curve of strains carrying the promoters P<sub>''liaG''</sub> (black) and P<sub>''veg''</sub> (grey) fused to ''lacZ'''''. β-galactosidase activity (Miller Units) and the growth curve values are the average of two independent clones with their standard deviation. Experiment shows representative data from three independent experiments.</p></font> | ||
| + | |} | ||
| + | |} | ||
| + | |} | ||
| + | <br> | ||
| + | <p align="justify">Promoter activity results in β-galactosidase expression. The β-galactosidase assays of P<sub>''veg''</sub> and P<sub>''liaG''</sub> were repeated three times. The graph shows data of one representative experiment. In the beginning of the growth curve, both promoters show only low activity before it increases to a maximum value at three hours. It then decreases steadily until reaching initial level after about seven hours (data not shown). Summing up, the time course of activity is very similar for both promoters. The highest β-galactosidase activity (P<sub>''veg''</sub>= 65 Miller Units, P<sub>''liaG''</sub>= 12 Miller Units) can be found during the transition from logarithmic to stationary phase. | ||
</p> | </p> | ||
| - | |||
| - | |||
| - | |||
| - | |||
| - | |||
| - | |||
Latest revision as of 13:23, 26 October 2012

The LMU-Munich team is exuberantly happy about the great success at the World Championship Jamboree in Boston. Our project Beadzillus finished 4th and won the prize for the "Best Wiki" (with Slovenia) and "Best New Application Project".
[ more news ]

Constitutive Bacillus Promoters
Luminescence measurements
The constitutive promoters PliaG and PlepA were evaluated in the reporter vector pSBBs3C-luxABCDE, which contains the lux operon ![]() . The promoter activity results in gene expression and production of the protein luciferase. The luminescence produced by this protein can be measured with the plate reader Synergy2 ([http://www.biotek.com/ BioTek]) (Fig. 1).
. The promoter activity results in gene expression and production of the protein luciferase. The luminescence produced by this protein can be measured with the plate reader Synergy2 ([http://www.biotek.com/ BioTek]) (Fig. 1).
All clones show a normal growth behaviour. The activity of both promoters increases during transition from log to stationary phase. PliaG has an activity maximum of about 100.000 Lumi/OD600. PlepA shows a maximum of about 400.000 Lumi/OD600. Comparing these two constitutive promoters, the activity of PlepA is about four times higher than the activity of PliaG. In the late stationary phase the activity completely disappears. The second clone of the promoters PlepA and PliaG did not show any luminescence activity. Therefore, additional clones need to be measured.
β-galactosidase assays
The two constitutive promoters PliaG and Pveg were evaluated with the reporter vector pSBBs1C-lacZ, which contains the lacZ reporter gene ![]() (Fig. 2).
(Fig. 2).
|
Promoter activity results in β-galactosidase expression. The β-galactosidase assays of Pveg and PliaG were repeated three times. The graph shows data of one representative experiment. In the beginning of the growth curve, both promoters show only low activity before it increases to a maximum value at three hours. It then decreases steadily until reaching initial level after about seven hours (data not shown). Summing up, the time course of activity is very similar for both promoters. The highest β-galactosidase activity (Pveg= 65 Miller Units, PliaG= 12 Miller Units) can be found during the transition from logarithmic to stationary phase.
 "
"


