Team:Tokyo Tech/Modeling
From 2012.igem.org
(→Result2: Validation of three subsystems’ function) |
(→Result 3 : sensitivity analysis) |
||
| (4 intermediate revisions not shown) | |||
| Line 95: | Line 95: | ||
In this way, we verified that there was a negative correlation between the concentration of Romeo signals and the expression of lysis proteins in Juliet cells. Furthermore, we confirmed that the increase and decrease of Juliet cells is dependent on the concentration change of Romeo signals. Therefore, it is well shown that the Communication-inverter dependent suicide system in Juliet cell is correctly functioning. | In this way, we verified that there was a negative correlation between the concentration of Romeo signals and the expression of lysis proteins in Juliet cells. Furthermore, we confirmed that the increase and decrease of Juliet cells is dependent on the concentration change of Romeo signals. Therefore, it is well shown that the Communication-inverter dependent suicide system in Juliet cell is correctly functioning. | ||
<br><br><br><br><br><br> | <br><br><br><br><br><br> | ||
| - | </div | + | </div> |
| - | + | ||
<div class="whitebox"> | <div class="whitebox"> | ||
| - | ==a== | + | |
| - | a | + | ==Result 3 : sensitivity analysis== |
| + | |||
| + | We have searched out the most influential parameters dominating the dynamics of our cell-cell communication. We achieved this by the Cluster Newton-Method ([7]), which infers feasible solution distribution of differential equations by solving inverse problems of Romeo and Juliet and happy-ending story, respectively. | ||
| + | |||
| + | The Cluster Newton-Method is characterized in simultaneous search of all unknown parameters of differential equations and visualization of feasible solution distribution. | ||
| + | |||
| + | (1) Parameter dependency analysis of “Romeo and Juliet” | ||
| + | |||
| + | First, we searched feasible solution distribution which satisfies the specific time course to reproduce Romeo and Juliet. We adjust the target conditions as follows to meet the feature of the signal concentration behavior that is consistent with Romeo and Juliet. | ||
| + | |||
| + | Conditions of Romeo and Juliet we adjusted: | ||
| + | t = 50[hour] | ||
| + | AUC (area under the curve) of Juliet signal = 100 | ||
| + | final value of Juliet signal concentration = 0 | ||
| + | final value of Romeo signal concentration = 0 | ||
| + | maximum value of Juliet signal concentration = 20 | ||
| + | maximum value of Romeo signal concentration = 20 | ||
| + | |||
| + | [[File:tokyotechMode7ing5.png|600px|thumb|center|Table3]] | ||
| + | |||
| + | Band-shaped graph achieved by arranging parameter sets that meet target conditions was shown in Fig2-1-4-12. | ||
| + | Vertical axis is normalized; ”1” indicates maximum value, “-1” indicates minimum value (log scale). | ||
| + | Horizontal axis: parameters’ number | ||
| + | |||
| + | [[File:tokyotechMode7ing6.png|600px|thumb|center|Fig2-1-4-12 feasible solution distribution of parameters for “Romeo and Juliet”]] | ||
| + | In Fig2-1-4-12, No.2, No.3, No.7, No.10, No.17 and No.19 show a small band range. This result indicates that these parameters are highly sensitive. | ||
| + | No.2: constant of proportionality of 3OC12HSL | ||
| + | No.3: maximum expression rare of LuxI | ||
| + | No.7: maximum expression rate of lysis protein in Juliet cell | ||
| + | No.10: 3OC12HSL concentration at which the expression rate of LuxI is half of No.3 | ||
| + | No.17: leaky expression rate of LasI | ||
| + | No.19: leaky expression rate of LuxI | ||
| + | |||
| + | |||
| + | |||
| + | |||
| + | To visualize the correlation of parameters, we redrew the graphs in Fig2-1-4-13 by randomly selecting 250 series from the Fig2-1-4-12. | ||
| + | |||
| + | [[File:tokyotechMode7ing2.png|600px|thumb|center|Fig2-1-4-13, parameter-parameter dependency between parameter No7 and parameter No10]] | ||
| + | Red colored lines show the top 5 percent of feasible solutions on parameter No7, which may be the dominant parameter of differential equations. This figure shows that there is a strong negative correlation between parameters No7 and No10. | ||
| + | It indicates that even though Juliet cell is easy to die, the story can still be reproduced as long as Romeo cell is highly active in response to Juliet signal. | ||
| + | |||
| + | |||
| + | |||
| + | (2) Parameter dependency analysis of happy ending story. | ||
| + | |||
| + | Next, we simulated the sensitivity of the parameters to reproduce a happy ending story in which two types of cells keep alive and the concentration of signals keeps increasing. We adjust the target conditions as follows. | ||
| + | |||
| + | Conditions of happy ending story we adjusted: | ||
| + | AUC = 2200 | ||
| + | final value of Juliet signal = 50 | ||
| + | |||
| + | Band-shaped graph achieved by arranging parameter sets that the meet target conditions was shown in Fig2-1-4-14. | ||
| + | |||
| + | [[File:tokyotechMode7ing3.png|600px|thumb|center|Fig2-1-4-14, feasible solution distribution of parameters for Romeo and Juliet]] | ||
| + | |||
| + | We considered the significant difference in shape between Fig2-1-4-12 and Fig2-1-4-14. We found that parameter No7 has a long lower part. Then we painted 5 percent of parameter sets containing lower part of No7 parameter red. | ||
| + | |||
| + | [[File:tokyotechMode7ing4.png|600px|thumb|center|Fig2-1-4-15, Parameter-parameter dependency about parameter No7for Happy ending story]] | ||
| + | |||
| + | The figure shows the strong correlations between No.7 and No.2 and that between No.7 and No.17. | ||
| + | |||
| + | No.7: maximum expression rate of lysis protein in Juliet cell | ||
| + | No.17: leaky expression rate of LasI | ||
| + | No.2: constant of proportionality of 3OC12HSL | ||
| + | |||
| + | |||
| + | (3) Discussion | ||
| + | |||
| + | These results indicate that suicide system dominates the dynamics of our cell-cell communication. The simulation results suggest that we should create the next dominative signal synthesis (positive feedback) part corresponding to the dynamics of suicide module used in our circuit. Suicide module exists already, so we create positive feedback system. | ||
| + | |||
| + | |||
| + | |||
| + | |||
</div></div></div> | </div></div></div> | ||
<div class="whitebox"> | <div class="whitebox"> | ||
<div id="tokyotech" style=" font:Arial ;left ; font-size: 15px; color: #000000; padding: 30px;"> | <div id="tokyotech" style=" font:Arial ;left ; font-size: 15px; color: #000000; padding: 30px;"> | ||
| + | <div id="tokyotech" style=" font:bold ;left ; font-size: 30px; color: #0000FF; padding: 2px;"> | ||
| + | |||
| + | </div></div></div> | ||
Latest revision as of 04:04, 27 October 2012
Contents |
Modeling
To build our cell-cell communication system, we have constructed and characterized several important parts and subsystems by experiments. However, it is unconfirmed whether E.coli can play all the drama completely. To confirm the feasibility of our cell-cell communication system, we conducted the following simulation.
Model development
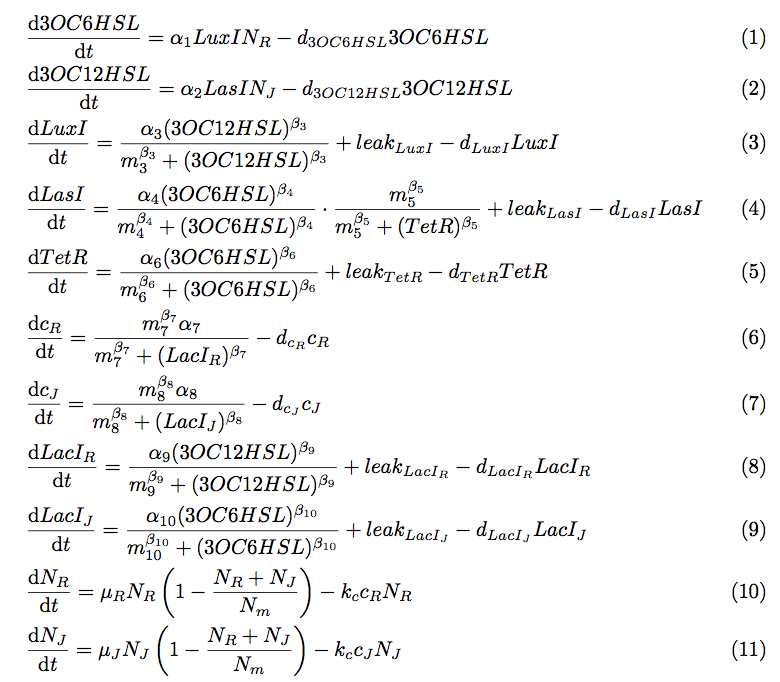
To simulate the cell-cell communication system, we developed an ordinary differential equation model. The equations used in the model are shown in Fig2-1-4-1. The Variables are described in Table2-1-4-1.
[Detailed descriptions for Modeling]
Result1: Whether our circuit can reproduce “Romeo and Juliet”
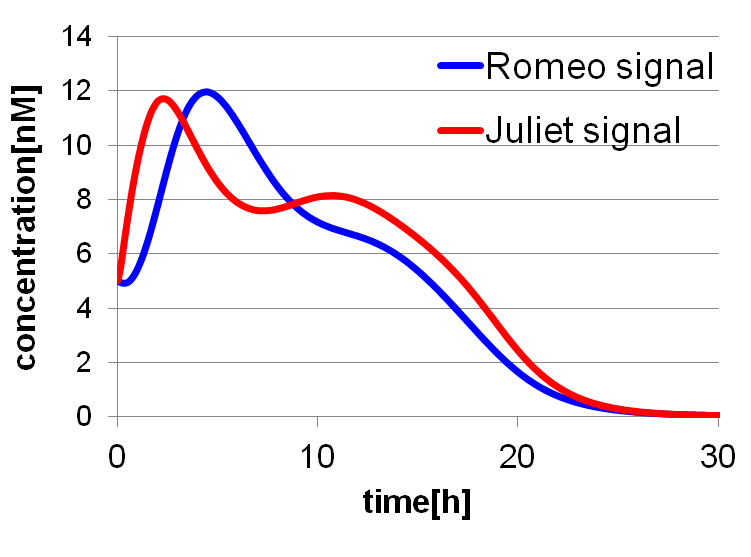
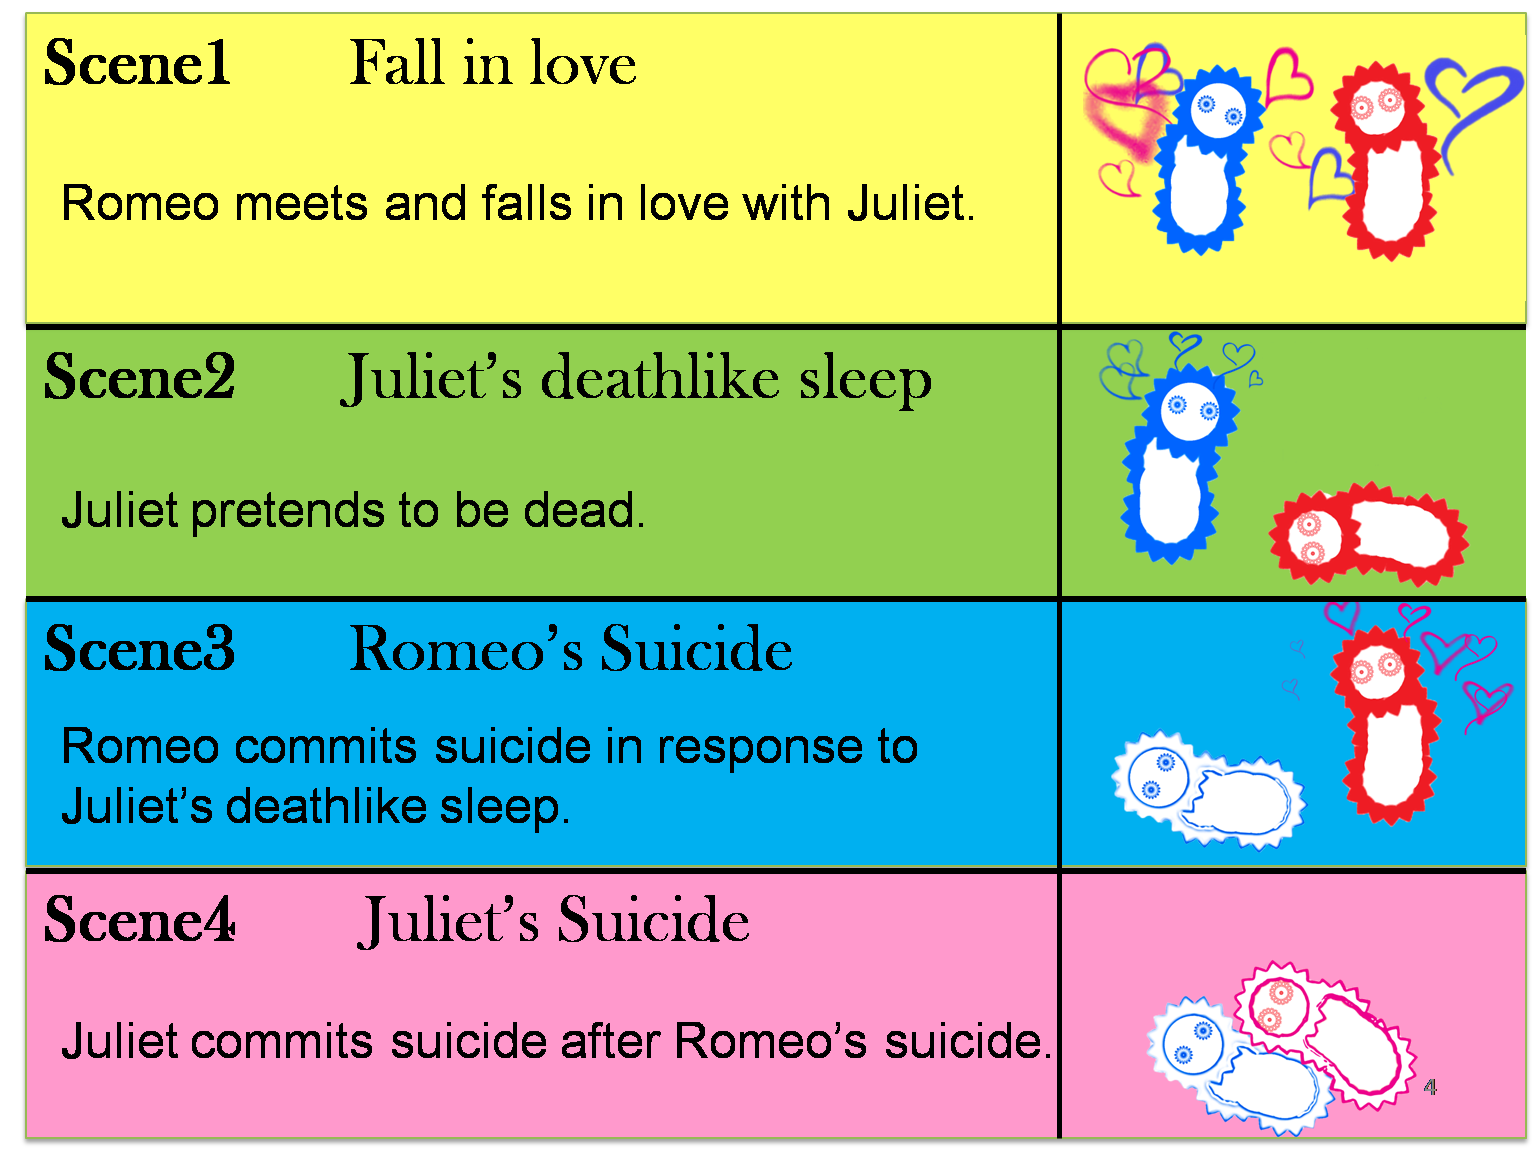
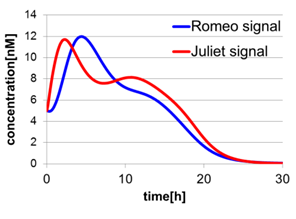
To confirm the feasibility of the cell-cell communication system, we simulated the system under typical experimental conditions. Fig2-1-4-2 shows the result of the simulation about time-dependent change of the concentrations of the two signals. We verified the behavior of the signal concentration by referring to “Romeo and Juliet” scenes. As described below, the behavior of the signal concentration is consistent with the development of the story.
We set the initial values of variables and the parameters as follows: [see more]
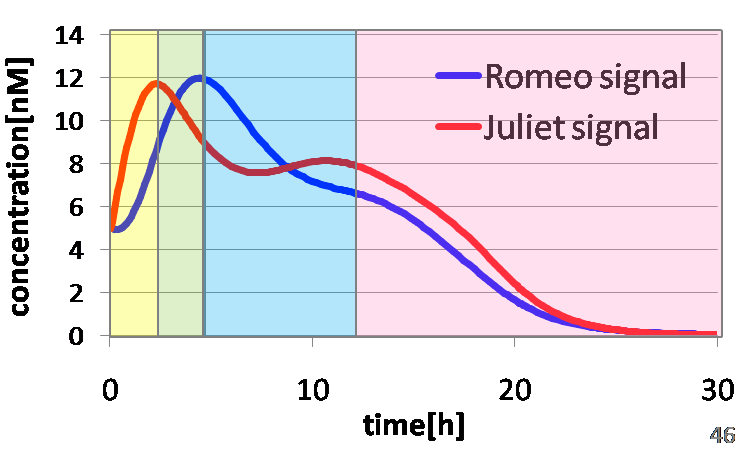
In the yellow area of Fig2-1-4-3, the concentration of two signals increases. It looks as if Romeo and Juliet fall in love.
In the green area of Fig2-1-4-3, as the concentration of Romeo signals increases to some extent, the concentration of Juliet signals starts to decline. It looks like Juliet’s deathlike sleep.
In the blue area of Fig2-1-4-3, lysis gene is expressed in Romeo cell in response to the decline of the concentration of Juliet signals, then the concentration of Romeo signals starts to decline. This represents the suicide of Romeo. In the story, he thought Juliet was dead, and killed himself.
In the pink area of Fig2-1-4-3, lysis gene is expressed in Juliet cell in response to the decline of the concentration of Romeo signals, then the concentration of Juliet signals decreases further. As a result, the concentration of two signals forms a pattern of decline. This represents well that Juliet noticed Romeo’s suicide and followed him afterwards.
Result2: Validation of three subsystems’ function
In [result 1], we demonstrated that the behavior of signal concentration is consistent with the “Romeo and Juliet” story. Next, in this [result 2], we confirmed that the behavior of signal concentration is certainly caused by three subsystems’ function. We confirmed the function of three subsystems (Positive feedback system, Band detect system, and Communication-inverter dependent suicide system). In the Positive feedback system, two kinds of signals increase their concentration mutually. In the Band detect system, the repressor protein (TetR) is expressed in Juliet cells under the particular range of the Romeo signal concentration. In the Communication-inverter dependent suicide system, the expression of lysis proteins is repressed in the presence of signals and is promoted in the absence of signals.
(1)Positive feedback system
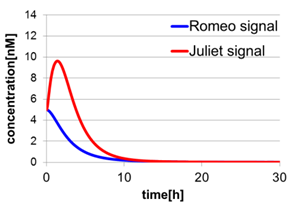
To confirm the importance of the positive feedback in our cell-cell communication system, we simulated the behavior of the systems with and without positive feedback. In addition to the complete cell-cell communication system, we prepared two systems without positive feedback. First, we prepared the constitutively signal producing system. In that system, LuxI (proteins that generate Romeo signals) and LasI (proteins that generate Juliet signals) are constitutively expressed (Fig2-1-4-6). Second, we prepared the separately cultured cells system (Fig2-1-4-7). In that system, Romeo cells and Juliet cells are cultured separately.
In Fig2-1-4-5, the behavior of signal concentration in the complete cell-cell communication system is shown. As a comparison, in Fig2-1-4-6, the concentration of Romeo signals and Juliet signals increases slightly at first, but starts to decline before rising sufficiently. In Fig2-1-4-7, the concentration of Romeo signals decreases while Juliet signals increases. That is to say, the cell-cell communication system without positive feedback is unsuitable for reproduction of “Romeo and Juliet” and we confirmed the importance of the positive feedback in our cell-cell communication system.
(2)Band detect system
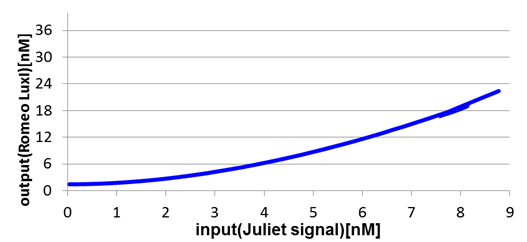
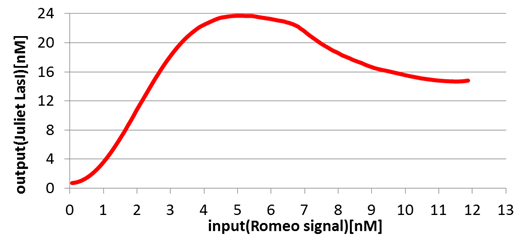
Next, we confirmed the function of the Band detect system. Fig2-1-4-8 and Fig2-1-4-9 show the concentration change of the output signals responding to the concentration change of input signals.
In Romeo cells, the production of Romeo signals increases monotonically with the increase of Juliet signals.
On the other hand, in Juliet cells, the production of Juliet signals is in the largest quantities under the particular range of Romeo signal concentration. However, the production of Juliet signals is kept in a low level in the situation of low and high Romeo signals concentration.
In this manner, the validity of Band detect system in Juliet cells was proven by modeling.
(3)Communication-inverter dependent suicide system – in Romeo cell
To confirm the function of the Communication-inverter dependent suicide system in Romeo cell, we examined the relation between the concentration of Juliet signals and the population of Romeo cells.
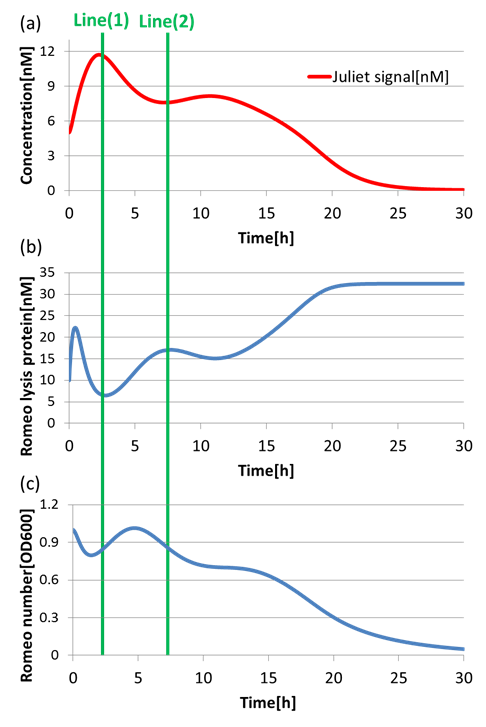
On the Line(1) in Fig2-1-4-10, when the concentration of Juliet signals is high (Fig2-1-4-10(a)), the expression of LacI (proteins that inhibit lysis gene) is promoted strongly in Romeo cells. Thus, the expression of lysis proteins in Romeo cells is inhibited (Fig2-1-4-10(b)). As a result, the population of Romeo cells increases (Fig2-1-4-10(c)). On the other hand, on the Line(2) in Fig2-1-4-10, when the concentration of Juliet signals is low (Fig2-1-4-10(a)), the expression of lysis proteins in Romeo cells is promoted (Fig2-1-4-10(b)). Thus, the population of Romeo cells decreases (Fig2-1-4-10(c)).
In this way, we verified that there was a negative correlation between the concentration of Juliet signals and the expression of lysis proteins in Romeo cells. Furthermore, we confirmed that the increase and decrease of Romeo cells is dependent on the concentration change of Juliet signals. Therefore, it is well shown that the Communication-inverter dependent suicide system in Romeo cell is correctly functioning.
(4)Communication-inverter dependent suicide system – in Juliet cell
Next, to confirm the function of Communication-inverter dependent suicide system in Juliet cell, we examined the relation between the concentration of Romeo signals and the population of Juliet cells.
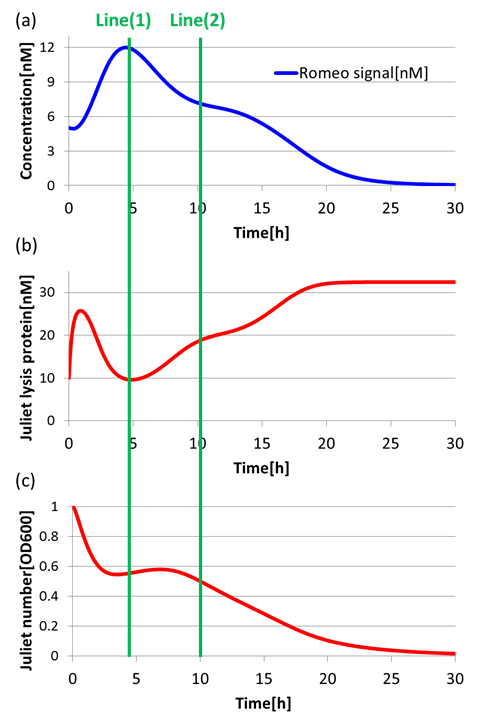
On the Line(1) in Fig2-1-4-11, when the concentration of Romeo signals is high (Fig2-1-4-11(a)), the expression of LacI(proteins that inhibit lysis gone) is promoted strongly in Juliet cells. Thus, the expression of lysis proteins in Juliet cells is inhibited (Fig2-1-4-11(b)). As a result, the population of Juliet cells population somewhat increases (Fig2-1-4-11(c)). On the other hand, on the Line(2) in fig4-9, when the concentration of Romeo signals is low (Fig2-1-4-11(a)), the expression of lysis proteins in Juliet cells is promoted (Fig2-1-4-11(b)). Thus, the population of Juliet cells decreases (Fig2-1-4-11(c)).
In this way, we verified that there was a negative correlation between the concentration of Romeo signals and the expression of lysis proteins in Juliet cells. Furthermore, we confirmed that the increase and decrease of Juliet cells is dependent on the concentration change of Romeo signals. Therefore, it is well shown that the Communication-inverter dependent suicide system in Juliet cell is correctly functioning.
Result 3 : sensitivity analysis
We have searched out the most influential parameters dominating the dynamics of our cell-cell communication. We achieved this by the Cluster Newton-Method ([7]), which infers feasible solution distribution of differential equations by solving inverse problems of Romeo and Juliet and happy-ending story, respectively.
The Cluster Newton-Method is characterized in simultaneous search of all unknown parameters of differential equations and visualization of feasible solution distribution.
(1) Parameter dependency analysis of “Romeo and Juliet”
First, we searched feasible solution distribution which satisfies the specific time course to reproduce Romeo and Juliet. We adjust the target conditions as follows to meet the feature of the signal concentration behavior that is consistent with Romeo and Juliet.
Conditions of Romeo and Juliet we adjusted: t = 50[hour] AUC (area under the curve) of Juliet signal = 100 final value of Juliet signal concentration = 0 final value of Romeo signal concentration = 0 maximum value of Juliet signal concentration = 20 maximum value of Romeo signal concentration = 20
Band-shaped graph achieved by arranging parameter sets that meet target conditions was shown in Fig2-1-4-12. Vertical axis is normalized; ”1” indicates maximum value, “-1” indicates minimum value (log scale). Horizontal axis: parameters’ number
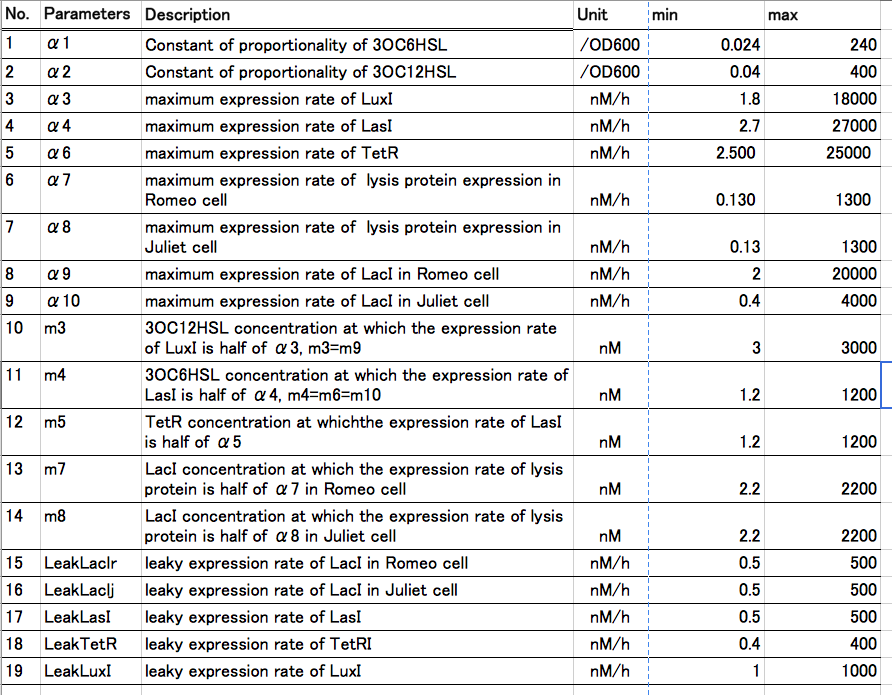
In Fig2-1-4-12, No.2, No.3, No.7, No.10, No.17 and No.19 show a small band range. This result indicates that these parameters are highly sensitive. No.2: constant of proportionality of 3OC12HSL No.3: maximum expression rare of LuxI No.7: maximum expression rate of lysis protein in Juliet cell No.10: 3OC12HSL concentration at which the expression rate of LuxI is half of No.3 No.17: leaky expression rate of LasI No.19: leaky expression rate of LuxI
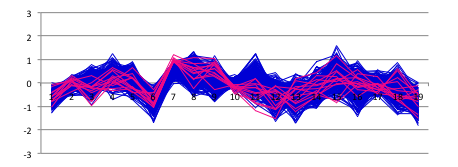
To visualize the correlation of parameters, we redrew the graphs in Fig2-1-4-13 by randomly selecting 250 series from the Fig2-1-4-12.
Red colored lines show the top 5 percent of feasible solutions on parameter No7, which may be the dominant parameter of differential equations. This figure shows that there is a strong negative correlation between parameters No7 and No10. It indicates that even though Juliet cell is easy to die, the story can still be reproduced as long as Romeo cell is highly active in response to Juliet signal.
(2) Parameter dependency analysis of happy ending story.
Next, we simulated the sensitivity of the parameters to reproduce a happy ending story in which two types of cells keep alive and the concentration of signals keeps increasing. We adjust the target conditions as follows.
Conditions of happy ending story we adjusted: AUC = 2200 final value of Juliet signal = 50
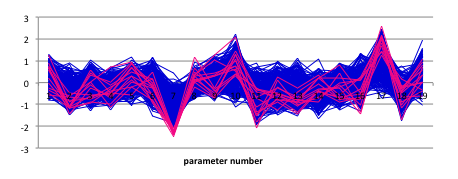
Band-shaped graph achieved by arranging parameter sets that the meet target conditions was shown in Fig2-1-4-14.
We considered the significant difference in shape between Fig2-1-4-12 and Fig2-1-4-14. We found that parameter No7 has a long lower part. Then we painted 5 percent of parameter sets containing lower part of No7 parameter red.
The figure shows the strong correlations between No.7 and No.2 and that between No.7 and No.17.
No.7: maximum expression rate of lysis protein in Juliet cell No.17: leaky expression rate of LasI No.2: constant of proportionality of 3OC12HSL
(3) Discussion
These results indicate that suicide system dominates the dynamics of our cell-cell communication. The simulation results suggest that we should create the next dominative signal synthesis (positive feedback) part corresponding to the dynamics of suicide module used in our circuit. Suicide module exists already, so we create positive feedback system.
 "
"
