Team:Paris Bettencourt/Restriction Enzyme
From 2012.igem.org
Aleksandra (Talk | contribs) (→The third combination of plasmids:) |
|||
| (55 intermediate revisions not shown) | |||
| Line 22: | Line 22: | ||
** [http://partsregistry.org/Part:BBa_K914007 K914007]: Meganuclease I-SceI controlled by pBad | ** [http://partsregistry.org/Part:BBa_K914007 K914007]: Meganuclease I-SceI controlled by pBad | ||
** [http://partsregistry.org/Part:BBa_K914008 K914008]: Meganuclease I-SceI controlled by pRha | ** [http://partsregistry.org/Part:BBa_K914008 K914008]: Meganuclease I-SceI controlled by pRha | ||
| - | * Demonstration that all 3 generators (K914005, K914007, K914008) work and express I-SceI meganuclease in cells. [https://2012.igem.org/Team:Paris_Bettencourt/Restriction_Enzyme# | + | * Demonstration that all 3 generators (K914005, K914007, K914008) work and express I-SceI meganuclease in cells. [https://2012.igem.org/Team:Paris_Bettencourt/Restriction_Enzyme#I-SceI_is_expressed_and_active_in_eliminating_restriction-site_harbouring_plasmid [Read more]] |
| - | + | <div id="boston"> | |
| - | + | * '''[https://2012.igem.org/Team:Paris_Bettencourt/Restriction_Enzyme#New_Results [Updated for Boston] ]''' : Characterization of 2 biobricks from TUDelft [https://2012.igem.org/Team:Paris_Bettencourt/Restriction_Enzyme#Measuring_the_I-SceI_efficiency_.28TUDelft_parts.29 [Read more]]: | |
| - | + | ||
| - | * Characterization of 2 biobricks from TUDelft [https://2012.igem.org/Team:Paris_Bettencourt/Restriction_Enzyme# | + | |
** [http://partsregistry.org/Part:BBa_K175041 K175041]: p(LacI) controlled I-SceI homing endonuclease generator | ** [http://partsregistry.org/Part:BBa_K175041 K175041]: p(LacI) controlled I-SceI homing endonuclease generator | ||
** [http://partsregistry.org/Part:BBa_K175027 K175027]: I-SceI restriction site | ** [http://partsregistry.org/Part:BBa_K175027 K175027]: I-SceI restriction site | ||
| + | </div> | ||
* [https://2012.igem.org/Team:Paris_Bettencourt/Restriction_Enzyme#Characterization_of_pRha Characterization ] of the L-rhamnose-inducible promoter ([https://2012.igem.org/Team:Paris_Bettencourt/Restriction_Enzyme#Design pRha]). | * [https://2012.igem.org/Team:Paris_Bettencourt/Restriction_Enzyme#Characterization_of_pRha Characterization ] of the L-rhamnose-inducible promoter ([https://2012.igem.org/Team:Paris_Bettencourt/Restriction_Enzyme#Design pRha]). | ||
</tr> | </tr> | ||
| Line 174: | Line 173: | ||
=====The third combination of plasmids:===== | =====The third combination of plasmids:===== | ||
| - | *First plasmid: | + | *First plasmid: pRha & RBS & I-SceI [Cm] |
*Second plasmid: I-SceI restriction site [Amp] | *Second plasmid: I-SceI restriction site [Amp] | ||
| Line 263: | Line 262: | ||
=====The third combination of plasmids:===== | =====The third combination of plasmids:===== | ||
| - | *First plasmid: | + | *First plasmid: pRha & RBS & I-SceI [Cm] |
*Second plasmid: I-SceI restriction site [Amp] | *Second plasmid: I-SceI restriction site [Amp] | ||
| Line 301: | Line 300: | ||
=====Step 2===== | =====Step 2===== | ||
| + | We followed the following protocol: | ||
| - | * | + | * Pick a colony and start a liquid culture with both antibiotic resistances (Amp and Cm). |
| - | * | + | * Incubate at 37°C until optical density (OD) reaches 0.5 |
| - | * | + | * Pellet and wash cells to remove Amp and Cm. |
| - | * | + | * Re-dilute them in the same volume of LB. |
| - | * From | + | * From each of those two tubes, start two liquid cultures: |
*# The first culture with Cm and w/o IPTG. | *# The first culture with Cm and w/o IPTG. | ||
*# The second culture with Cm and IPTG. | *# The second culture with Cm and IPTG. | ||
| - | * | + | * Incubate overnight at 37°C |
=====Step 3===== | =====Step 3===== | ||
| - | + | Plate colonies from each tube on two different plates: | |
# Selection with Cm and Amp. | # Selection with Cm and Amp. | ||
# Selection with Cm. | # Selection with Cm. | ||
| - | + | <br/> | |
==== Results ==== | ==== Results ==== | ||
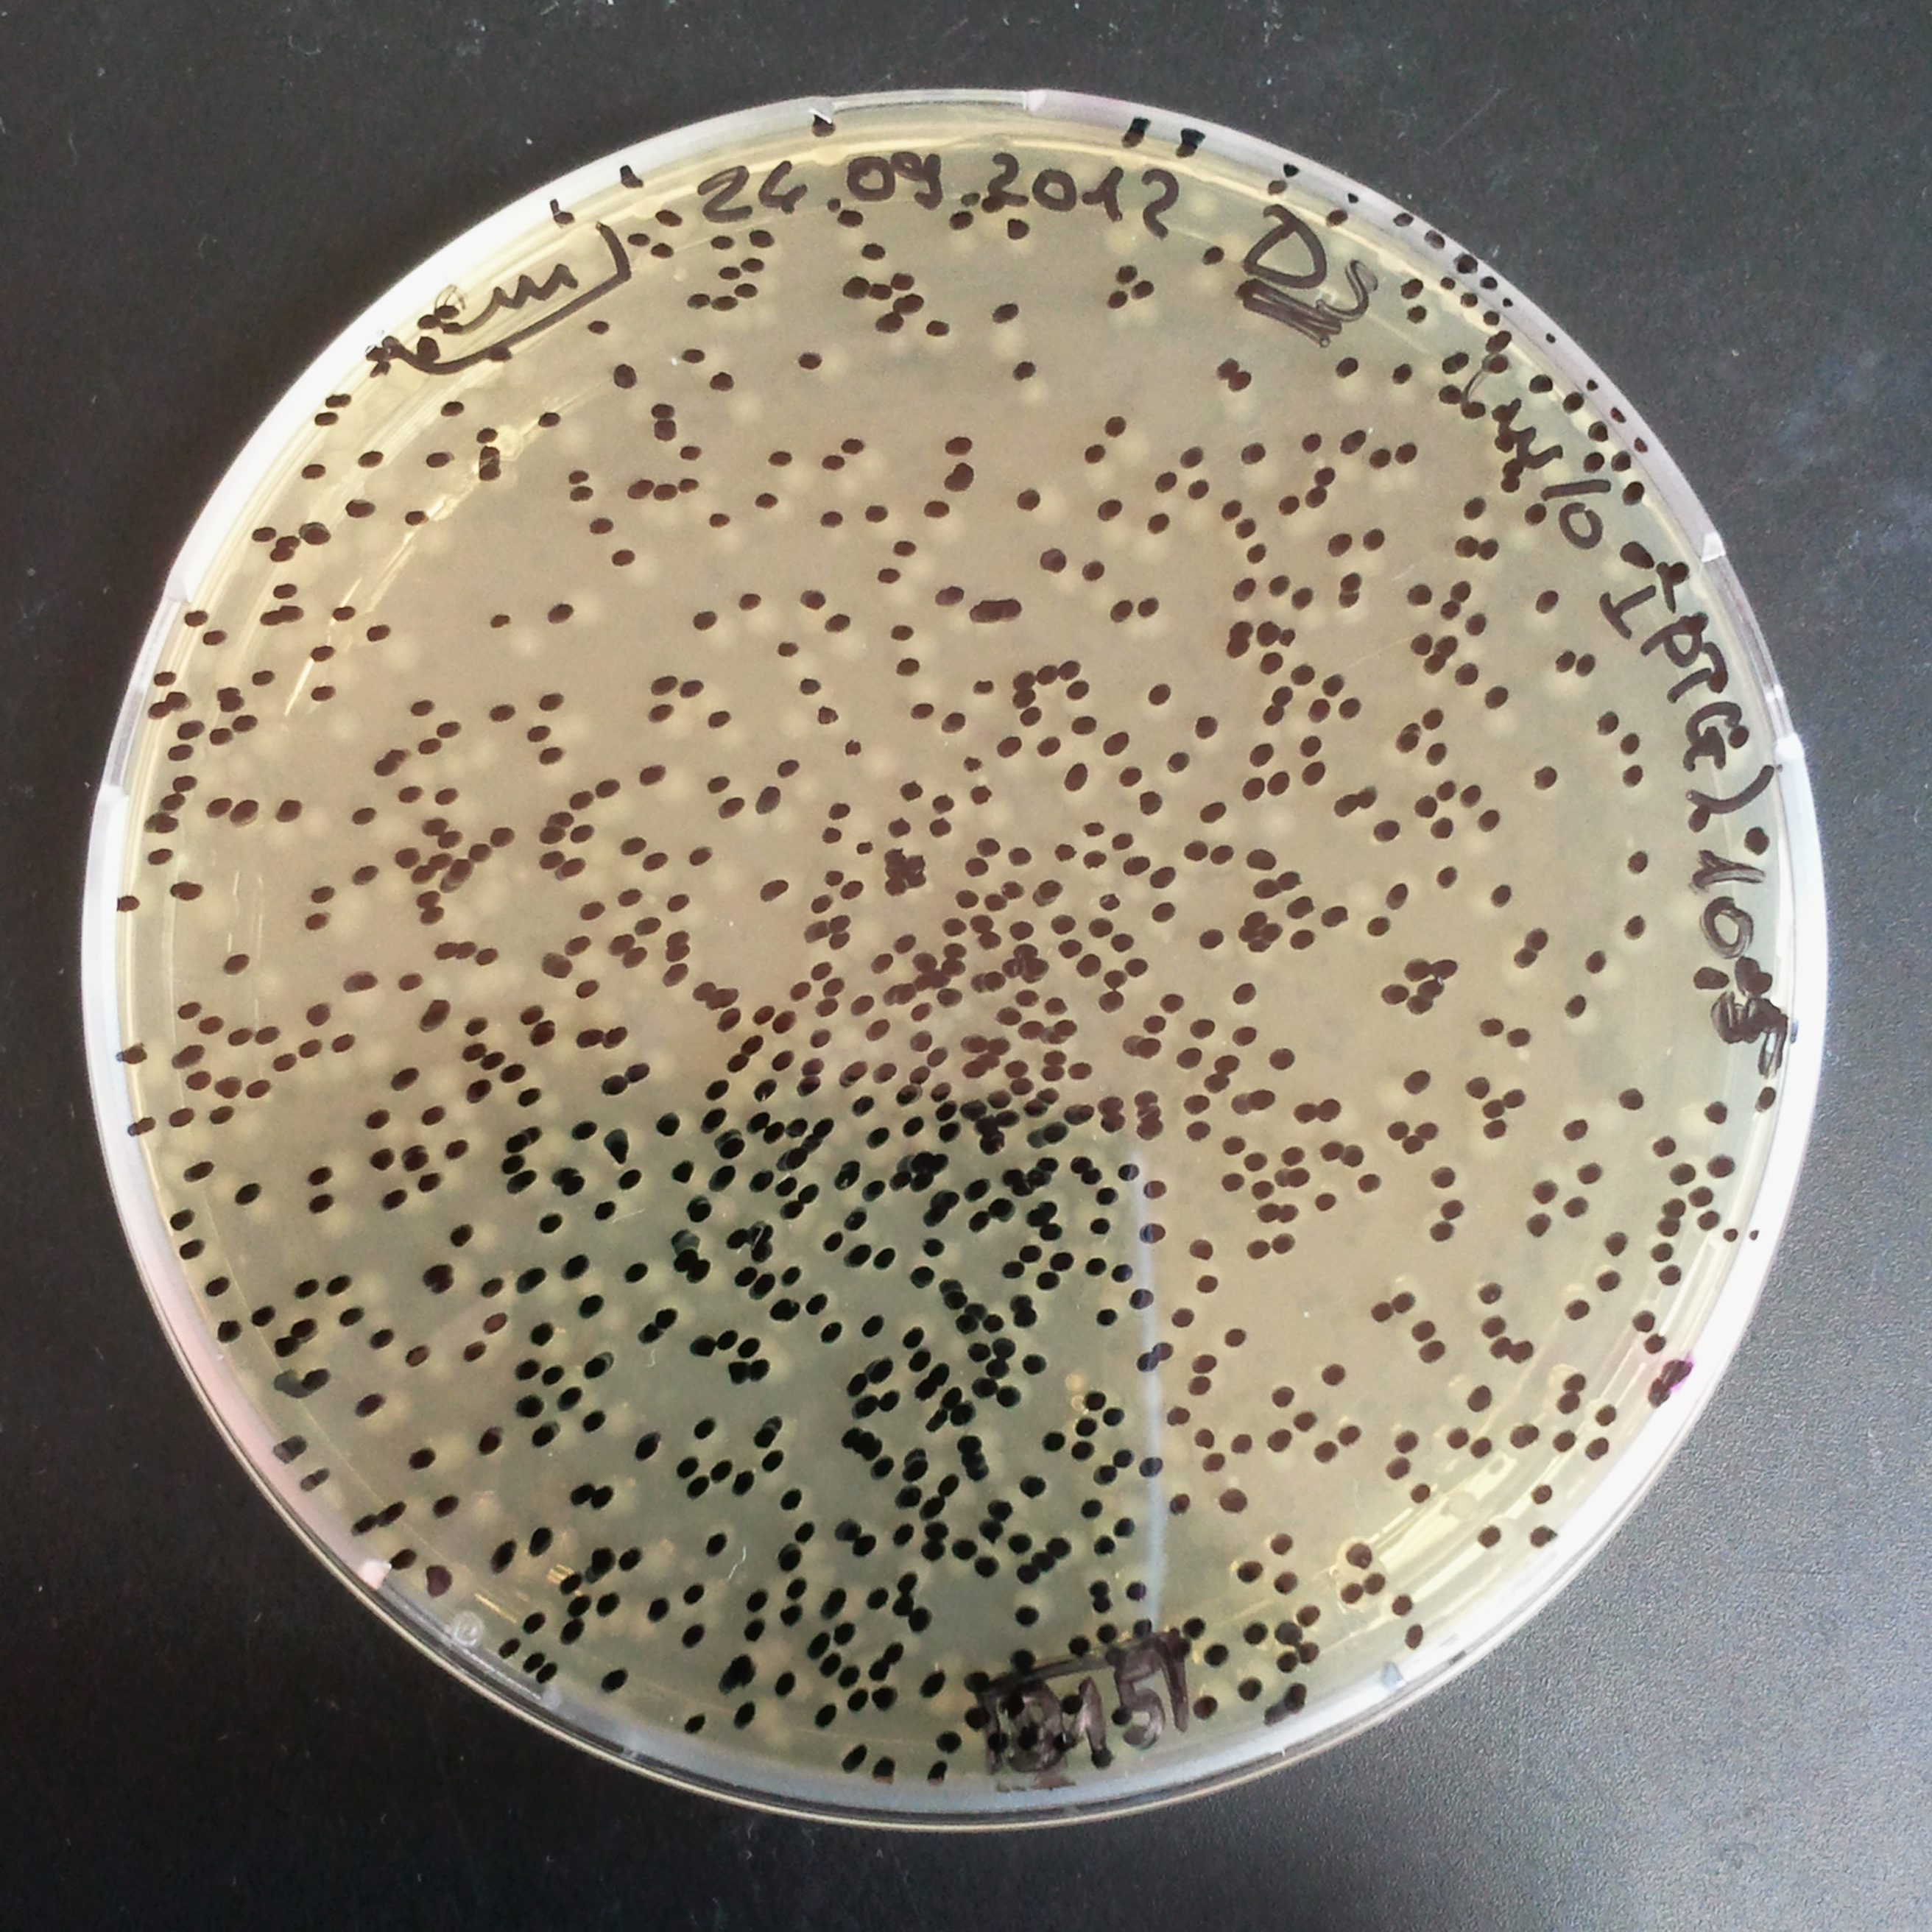
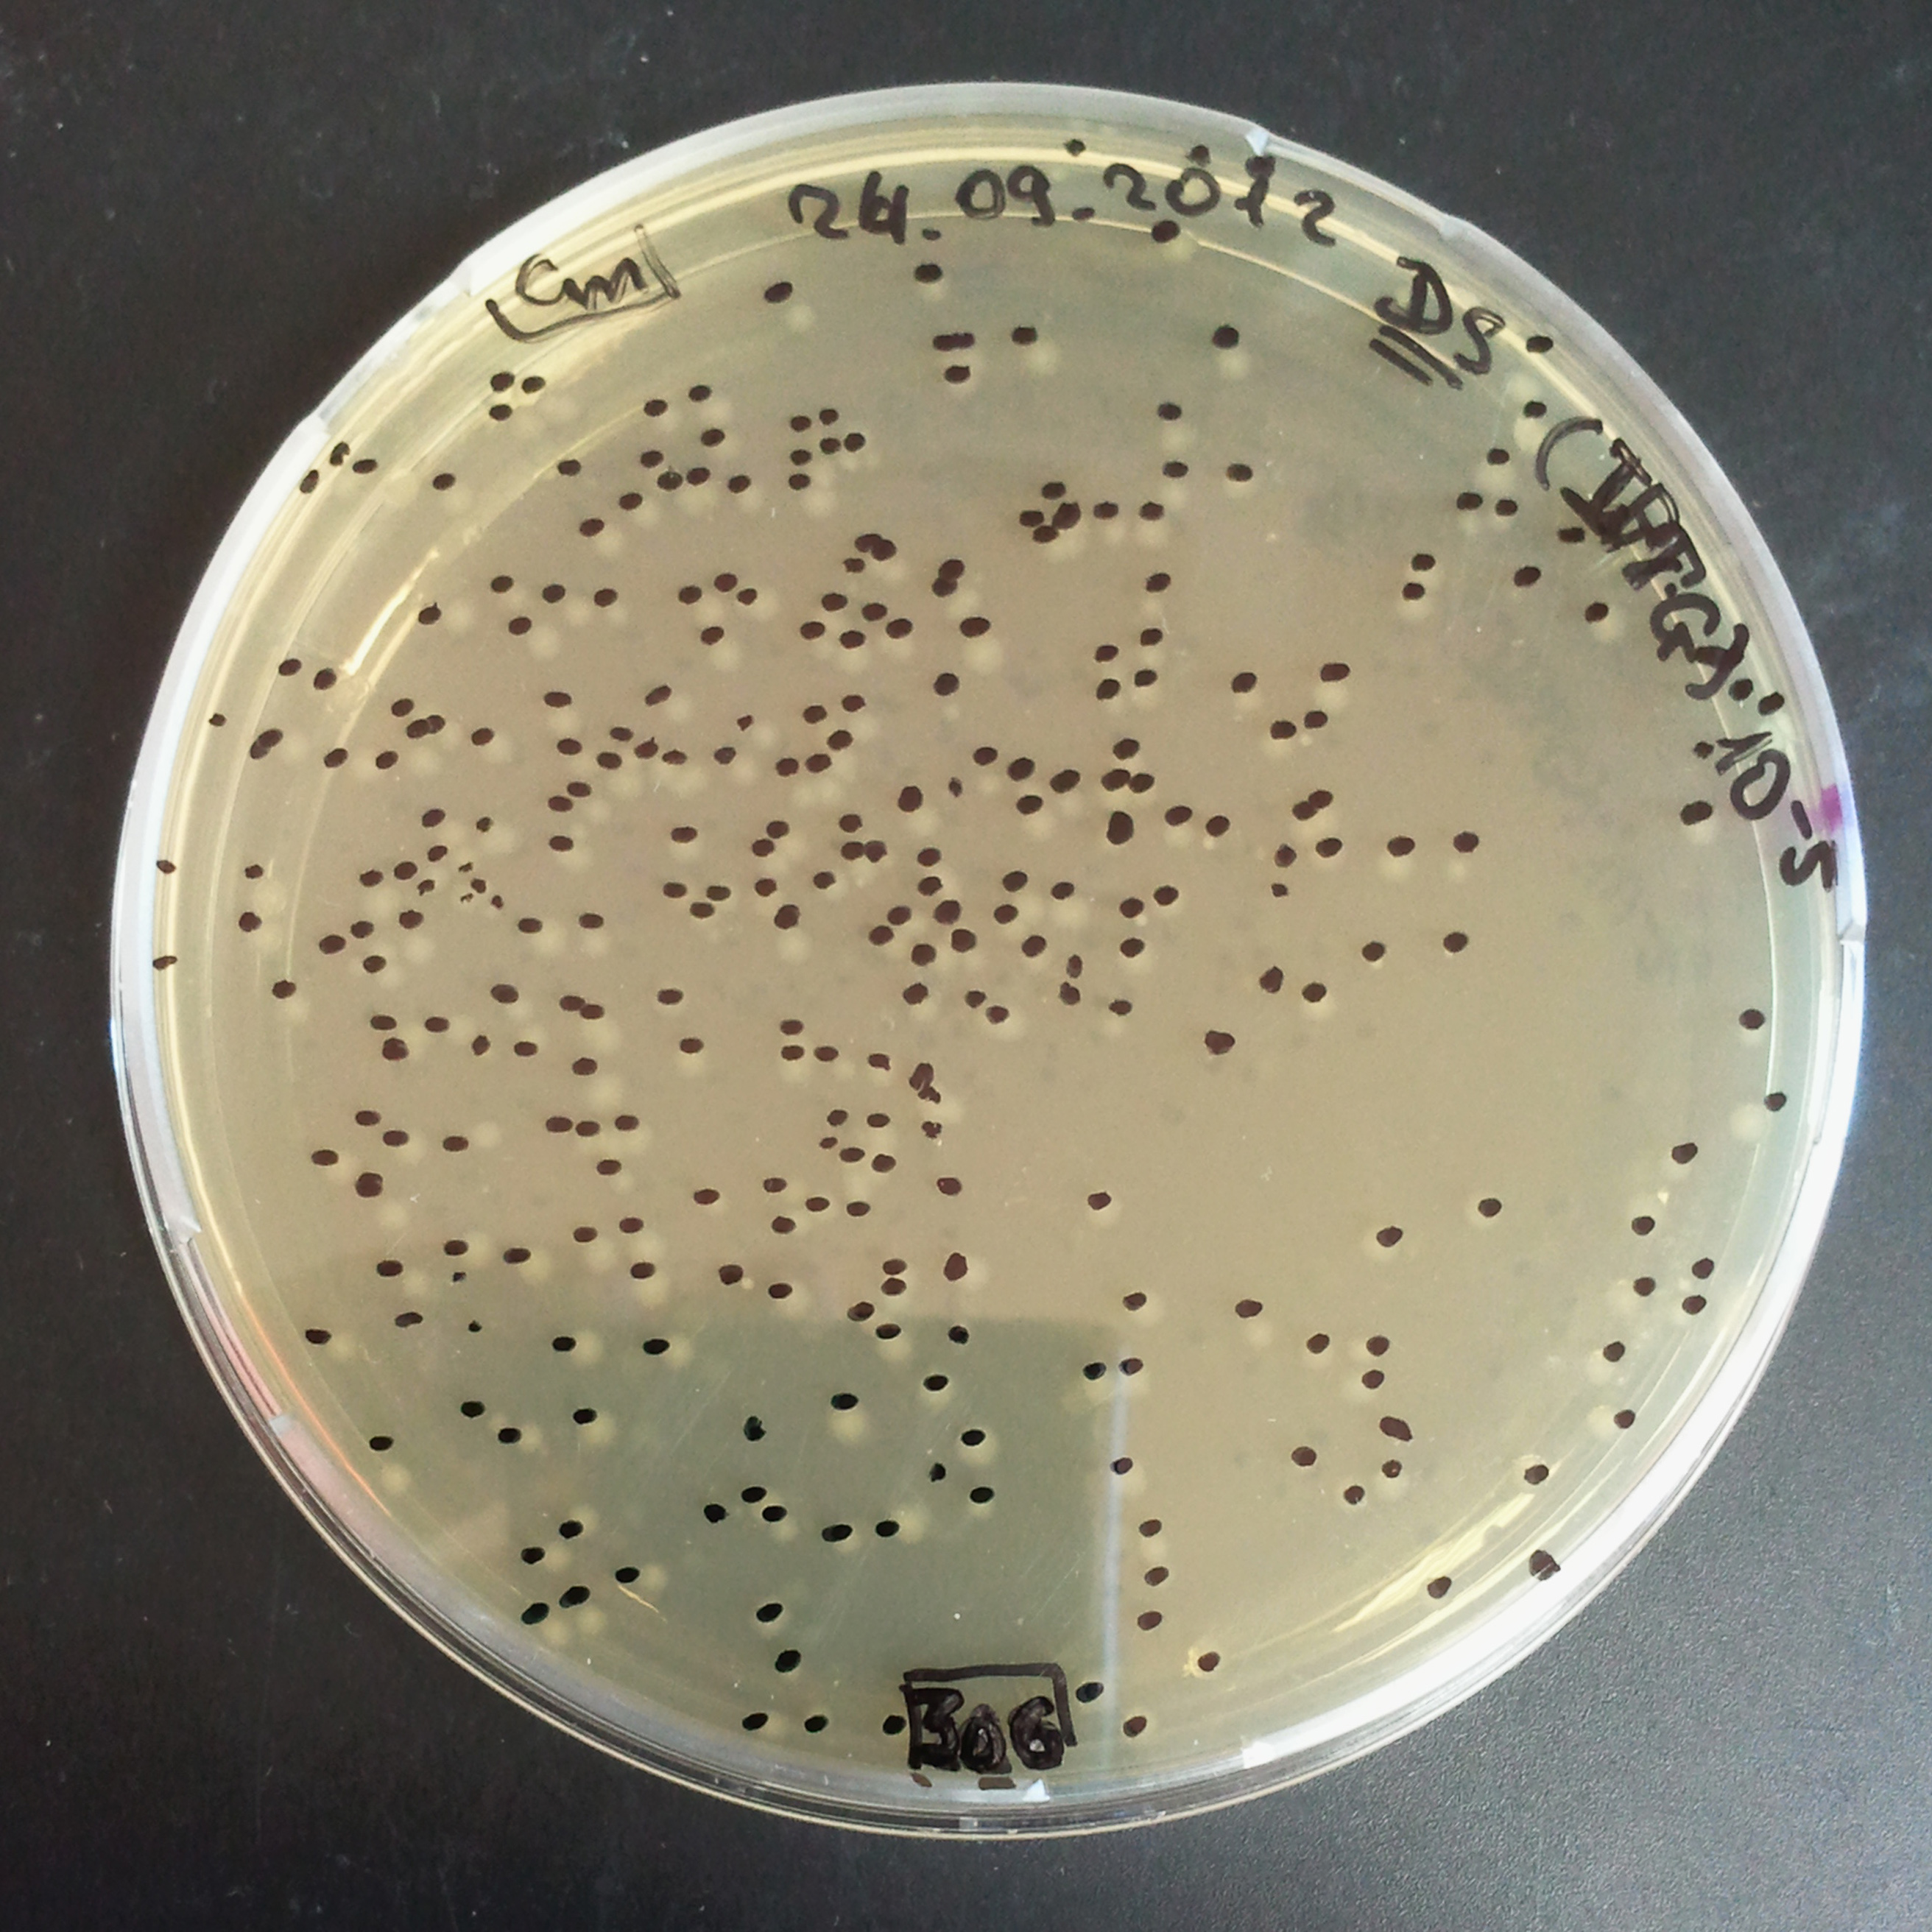
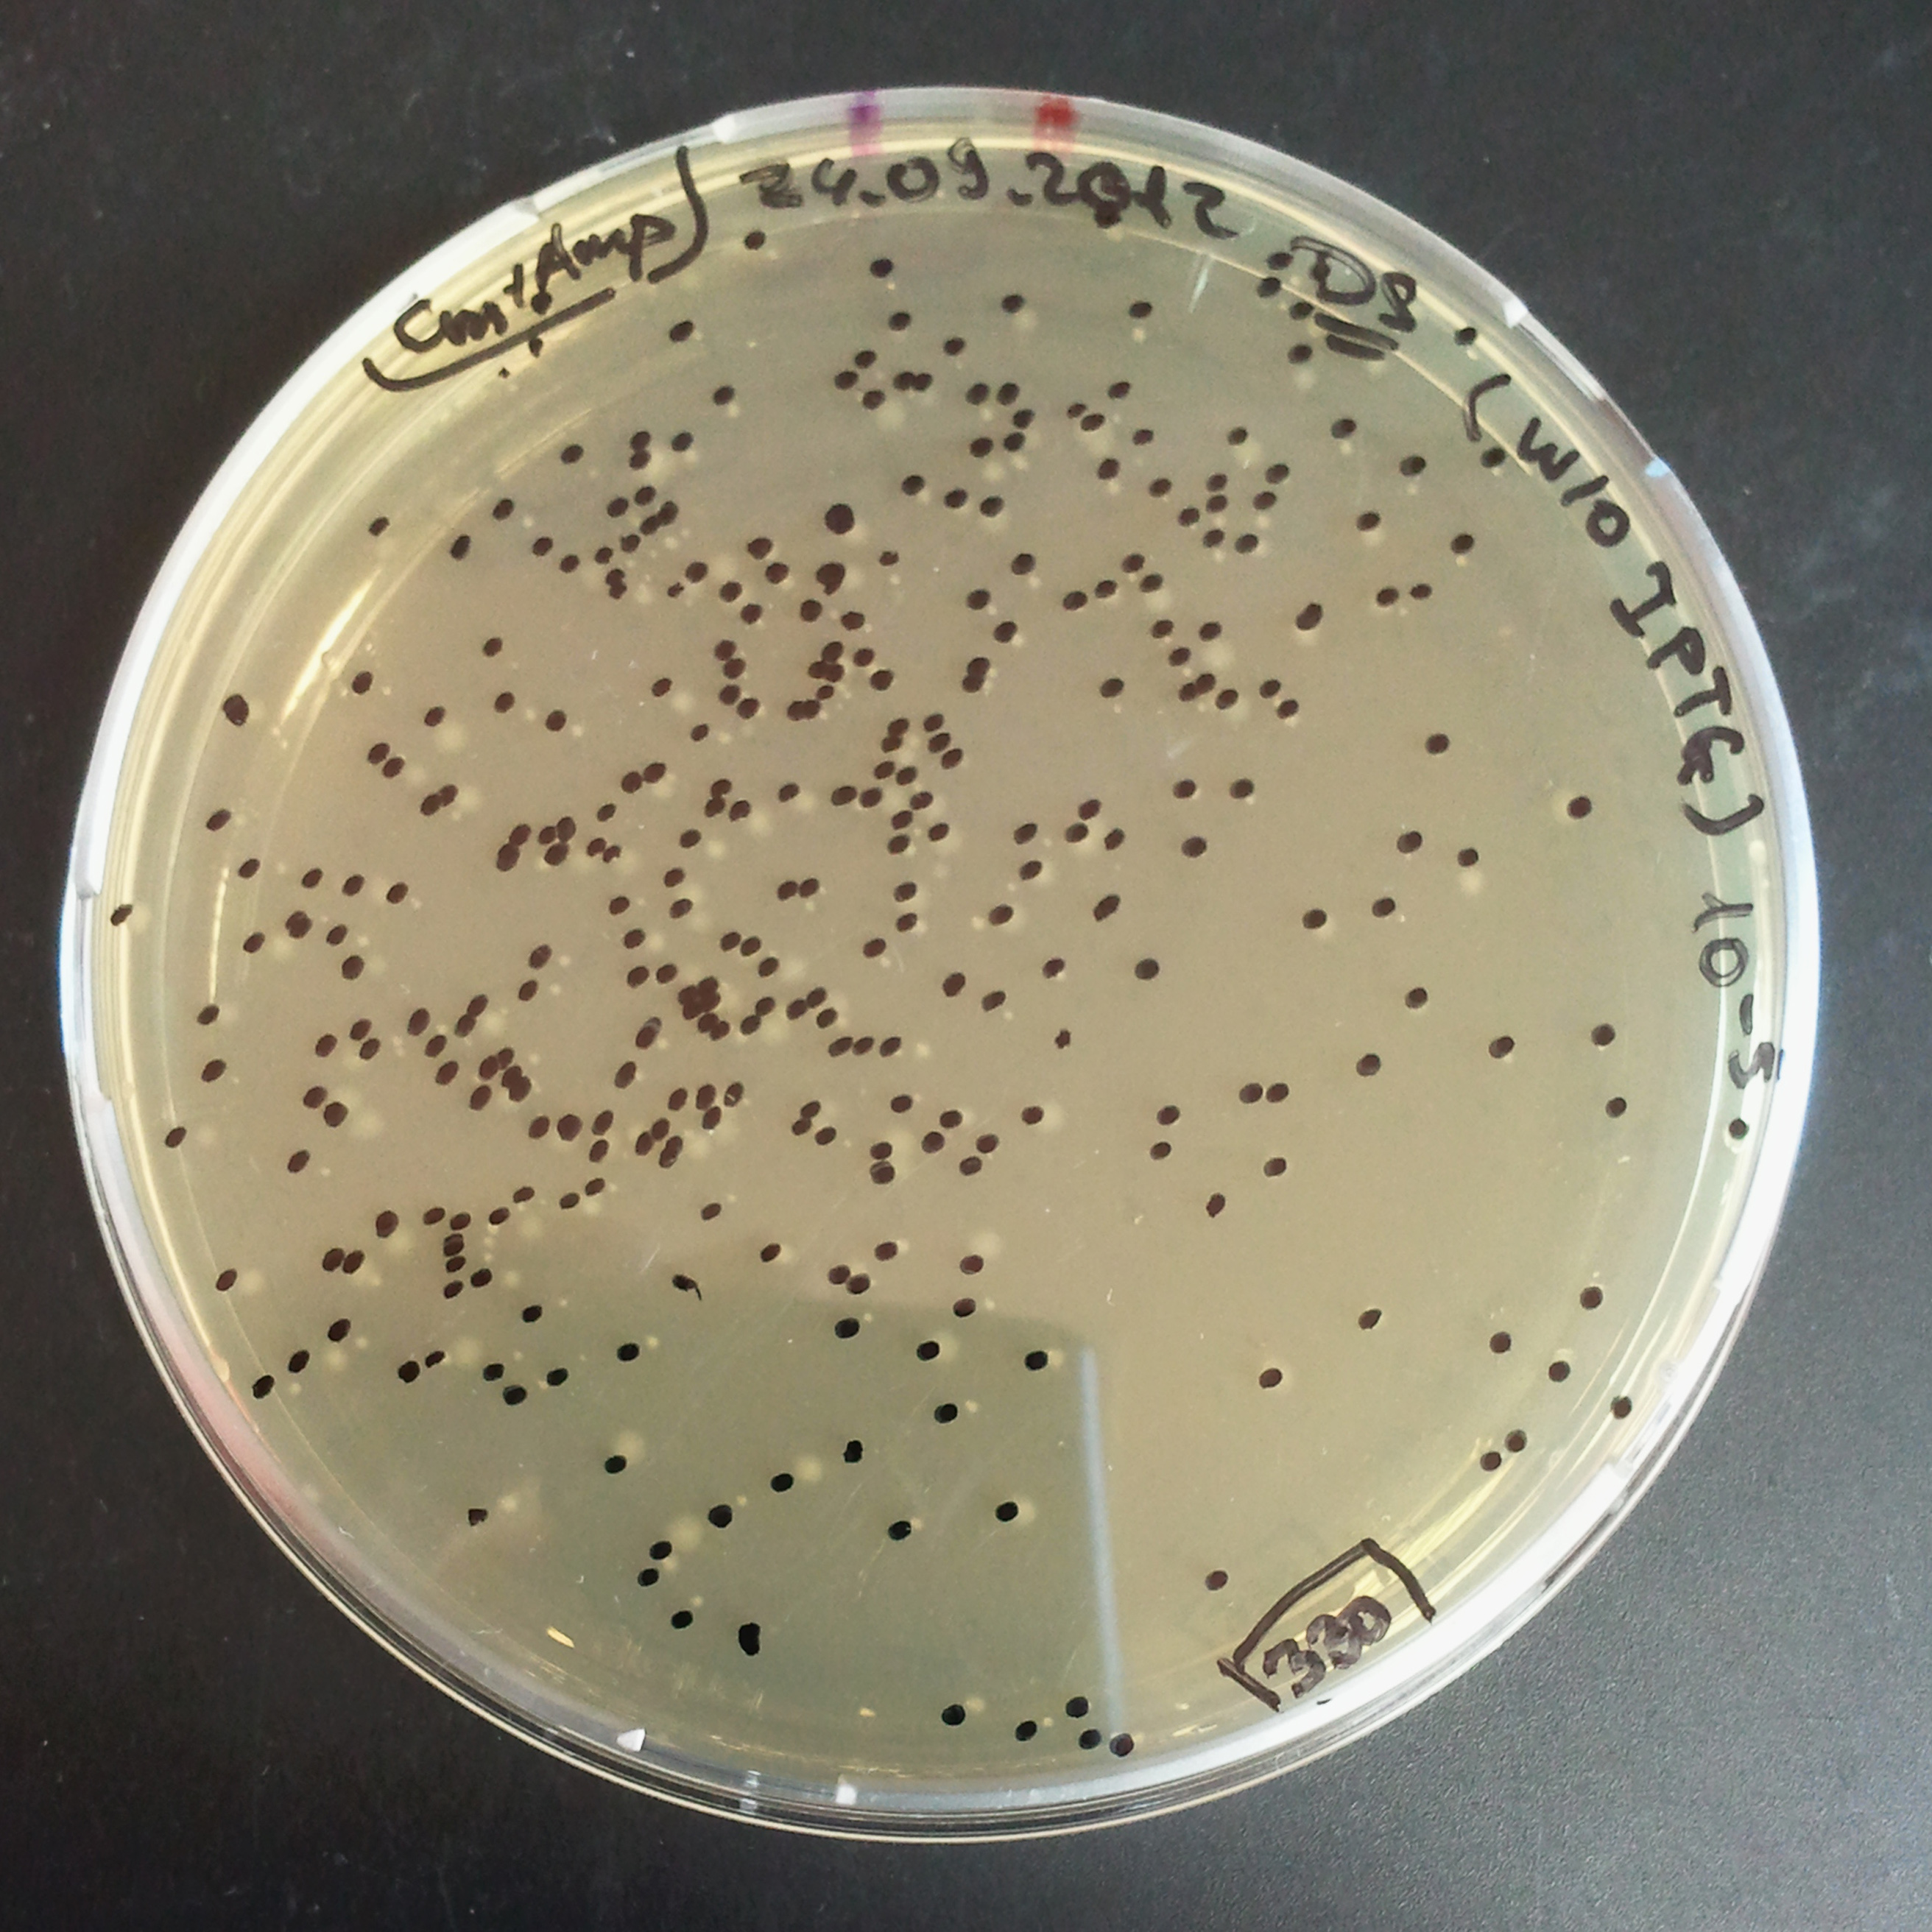
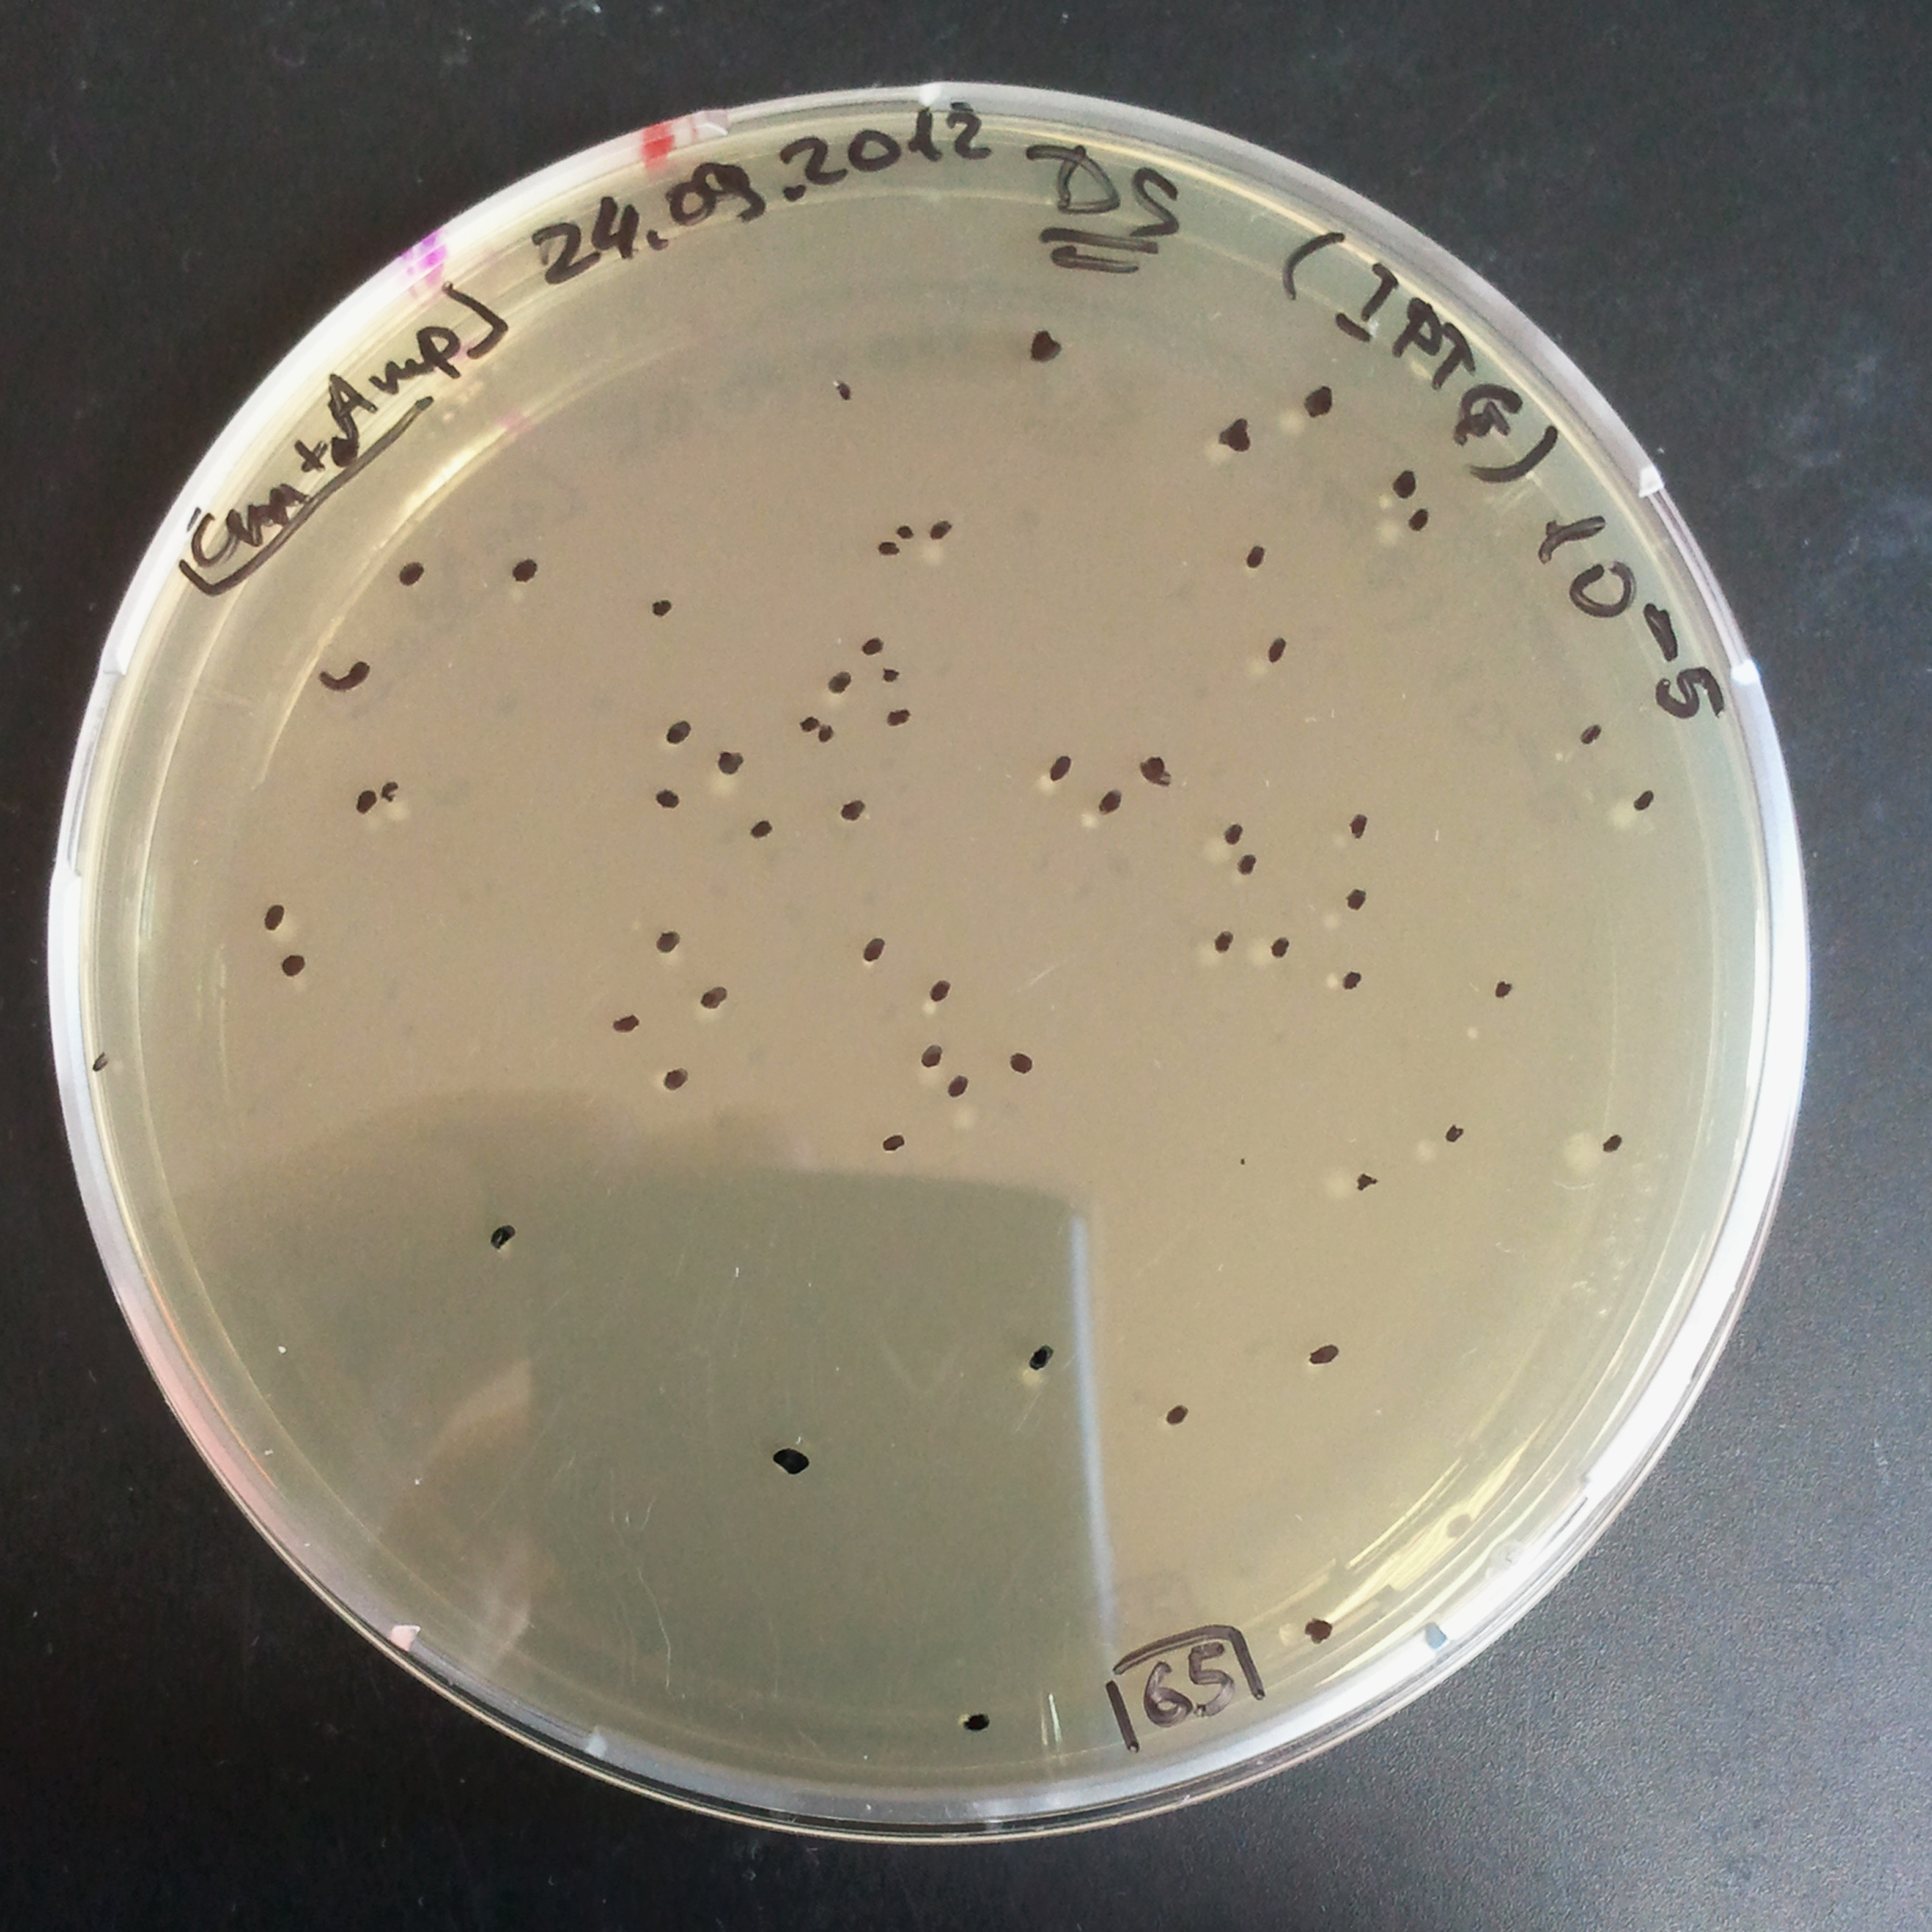
| - | To analyze data we counted and compared number of colonies on four plates. We expected that | + | To analyze data, we counted and compared the number of colonies on four plates corresponding to 4 conditions. |
| + | *First, we compared the number of CFU formed by non-induced cells, plated with a single antibiotic and with both antibiotics. We expected that the plate with only Cm selection would have the biggest number of colonies. A smaller number would be on the plate with two antibiotics (Amp and Cm). It could be explained by the loss of the plasmid carrying Amp resistance. | ||
| + | *Next, we compared the number of CFUs formed by the cells where we induced the I-SceI expression, plated with a single antibiotic and with both antibiotics. We expect that there would be much less colonies on the double antibiotic plate, because the Ampicillin carrying plasmid would be lost not only due to the absence of selection during growth (as for the first two cells), but also due to the digestion by the restriction enzyme. | ||
| + | |||
| + | |||
| + | =====The combination of plasmids:===== | ||
| + | |||
| + | *First plasmid: pLac & RBS & I-SceI [Cm] | ||
| + | *Second plasmid: I-SceI restriction site [Amp] | ||
{|align="center" | {|align="center" | ||
|-valign="top" | |-valign="top" | ||
| - | |[[Image:Paris_Bettencourt_2012_RG_Cm_TUD_woIPTG.jpg|thumb|250px|center| | + | |[[Image:Paris_Bettencourt_2012_RG_Cm_TUD_woIPTG.jpg|thumb|250px|center|Selection: Cm <br/> Plated colonies: w/o IPTG]] |
| - | |[[Image:Paris_Bettencourt_2012_RG_Cm_TUD_IPTG.jpg|thumb|250px|center| | + | |[[Image:Paris_Bettencourt_2012_RG_Cm_TUD_IPTG.jpg|thumb|250px|center|Selection: Cm <br/> Plated colonies: IPTG induced]] |
|- | |- | ||
| - | |[[Image:Paris_Bettencourt_2012_RG_AmpCm_TUD_woIPTG.jpg|thumb|250px|center| | + | |[[Image:Paris_Bettencourt_2012_RG_AmpCm_TUD_woIPTG.jpg|thumb|250px|center|Selection: Cm & Amp <br/> Plated colonies: w/o IPTG]] |
| - | |[[Image:Paris_Bettencourt_2012_RG_AmpCm_TUD_IPTG.jpg|thumb|250px|center| | + | |[[Image:Paris_Bettencourt_2012_RG_AmpCm_TUD_IPTG.jpg|thumb|250px|center|Selection: Cm & Amp <br/> Plated colonies: IPTG induced]] |
| + | |- | ||
| + | |colspan="2"|[[Image:Paris_Bettencourt_2012_RG_TUDelft_Diagram_0.png|thumb|400px|center|CFU number from 4 plates.]] | ||
|} | |} | ||
| + | |||
| + | |||
| + | From photos and bar graph above we can see that our expectation came true. | ||
| + | |||
| + | ===New Results=== | ||
| + | <div id="boston"> | ||
| + | <br/> | ||
| + | <br/> | ||
| + | Before going to Boston, we improved our protocol to characterize TUDelft BioBricks and showed the reproducibility of the results. | ||
| + | |||
| + | <b>New protocol:</b> | ||
| + | |||
| + | Both TUDelft plasmids are transformed into the <i>E.coli</i> NEB Turbo strain: | ||
| + | #<b>First plasmid:</b> High copy plasmid with encoded generator to express I-SceI meganuclease, [http://partsregistry.org/Part:BBa_K175041 BBa_K175041]: | ||
| + | #* Resistance: Chloramphenicol | ||
| + | #*: | ||
| + | #*: | ||
| + | #<b>Second plasmid:</b> High copy plasmid with encoded I-SceI restriction site, [http://partsregistry.org/Part:BBa_K175027 K175027]: | ||
| + | #* Resistance: Ampicillin and Kanamycin | ||
| + | |||
| + | * Start a liquid culture with Amp and Cm to select bacteria which have both plasmids. | ||
| + | * Incubate at 37°C overnight. | ||
| + | * Pellet and wash cells to remove Amp and Cm. | ||
| + | * Re-dilute them in the LB to have OD = 0.05. | ||
| + | * From the tube, start two liquid cultures: | ||
| + | *# The first culture with Cm. | ||
| + | *# The second culture with Cm and IPTG. | ||
| + | * Incubate bacteria until OD = 0.5 | ||
| + | *Plate colonies from each tube on two different plates: | ||
| + | *# Select with Cm and Amp. | ||
| + | *# Select with Cm. | ||
| + | |||
| + | The advantage of the new version of our protocol is that we add IPTG at the very low OD, so we expect to have better induction of the meganuclease. | ||
| + | |||
| + | <b>Experimental results:</b> | ||
| + | |||
| + | In much the same way as with our previous experiment, we counted and compared the number of colonies on four plates corresponding to 4 conditions: | ||
| + | |||
| + | *First, we compared the number of CFUs formed by the cells where we induced the I-SceI expression, plated with a single antibiotic or with both antibiotics. We expected that there would be fewer colonies on the double antibiotic plates, because the Ampicillin carrying plasmid would be lost not only due to the absence of selection during growth and basal expression level of I-SceI (as for the control), but also due to digestion by the restriction enzyme. | ||
| + | |||
| + | *As a control, we compared the number of CFUs formed by non-induced cells, plated with a single antibiotic and with both antibiotics. We expected that the plates with only Cm selection would have the biggest number of colonies. A smaller number would be on the plate with two antibiotics (Amp and Cm). It could be explained by the loss of the plasmid carrying Amp resistance and basal expression level of the I-SceI meganuclease. | ||
| + | |||
| + | We calculated the ratio between plates with only one or both antibiotics for both the induced (with IPTG) and uninduced (w/o IPTG) case according to the formula: | ||
| + | |||
| + | <center>[[Image:Paris_Bettencourt_2012_RG_TUDelft_Ratio.png]]</center> | ||
| + | |||
| + | The experiment was repeated four times. Average value with error bars for both cases are shown on the next diagram: | ||
| + | |||
| + | {|align="center" | ||
| + | |-valign="top" | ||
| + | |[[Image:Paris_Bettencourt_2012_RG_AmpCm_TUDelft_Diagram.jpg|thumb|400px|center|Proportion of cells with ampicillin resistant plasmids.]] | ||
| + | |} | ||
| + | |||
| + | <br/> | ||
| + | From the diagram we can see two times the difference between induced and uninduced cells. The results suggest that the plasmids with AmpR which carry the I-SceI restriction site are digested by the I-SceI meganuclease. | ||
| + | |||
| + | <b>Future experiments:</b> | ||
| + | We suggest a few ways to improve the efficiency of Restriction Enzyme System Safeguard: | ||
| + | * Firstly, to increase the probability to cut ampicillin resistant plasmids, we could increase the number of restriction sites it contains; | ||
| + | * Secondly, as we have showed, I-SceI meganuclease without the LVA-tag cut ampicillin resistant plasmids very efficiently even without induction of the regulated promoter. So, we could try to clone our constructs with weaker RBS or weaker LVA tag, two find a balance between the two states we describes in our experiments. | ||
| + | </div> | ||
| + | |||
| + | <br/> | ||
===Characterization of pRha=== | ===Characterization of pRha=== | ||
| Line 345: | Line 418: | ||
{|align="center" | {|align="center" | ||
|-valign="top" | |-valign="top" | ||
| - | |[[Image:Paris_Bettencourt_2012_RG_pRha_photo_1.jpg|thumb|250px|center| | + | |[[Image:Paris_Bettencourt_2012_RG_pRha_photo_1.jpg|thumb|250px|center|<i>E.Coli</i> <b>The left tube:</b> cells were grown without L-rhamnose. <b>The right tube:</b> cells are grown in the present of 1% of L-rhamnose.]] |
| - | |[[Image:Paris_Bettencourt_2012_RG_pRha_photo_2.jpg|thumb|250px|center| | + | |[[Image:Paris_Bettencourt_2012_RG_pRha_photo_2.jpg|thumb|250px|center|<i>E.Coli</i> <b>The right tube</b> which was induced by L-rhamnose expresses RFP, while <b>the left tube</b> where we didn't add it, has no visible expression.]] |
|} | |} | ||
| Line 353: | Line 426: | ||
{|align="center" | {|align="center" | ||
|-valign="top" | |-valign="top" | ||
| - | | colspan = 2 | [[Image: | + | | colspan = 2 | [[Image:Paris_Bettencourt_2012_RG_pRha_graph_4.jpg|thumb|530px|center|Quantification of the fluorescence after 10h of growth]] |
|} | |} | ||
Next, we characterized the pRha promoter using a plate reader. We used different concentrations of L-Rhamnose (0.05%, 0.1%, 0.2%, 0.5% and 1%) and observed the resulting fluorescence over time. As negative controls, we used the non-induced cells, as well as cells repressed by 1% Glucose. | Next, we characterized the pRha promoter using a plate reader. We used different concentrations of L-Rhamnose (0.05%, 0.1%, 0.2%, 0.5% and 1%) and observed the resulting fluorescence over time. As negative controls, we used the non-induced cells, as well as cells repressed by 1% Glucose. | ||
| - | [[Image:Paris_Bettencourt_2012_RG_pRha_graph_3.jpg|thumb| | + | [[Image:Paris_Bettencourt_2012_RG_pRha_graph_3.jpg|center|thumb|800px|Characterization of the pRha promoter using a plate reader]] |
As we can see from the graph above, pRha promoter works as expected and it could be well tuned by concentration of L-rhamnose. | As we can see from the graph above, pRha promoter works as expected and it could be well tuned by concentration of L-rhamnose. | ||
Latest revision as of 23:14, 26 October 2012
|
Aim: To design a plasmid self-digestion system. Experimental System: We are testing different combinations of promoters and restriction enzymes. We have to characterize both the promoters (by measuring the expression of RFP) and the restriction enzymes (by measuring killed cells). Achievements :
|
Contents
|
Overview
We designed a plasmid self-digestion system. This synthetic system allows to digest plasmids into linear parts of DNA and thus disrupt the expression of the genes carried by this plasmid. In our specific containment module, this will result in extinguishing the expression of the antitoxin (Colicin immunity protein), and any plugged-in synthetic device. This will lead to activation of the colicin DNAse toxin thst will degrade the cell's chromosomal DNA, leading to its death.
Objectives
- Find appropriate restriction enzymes which have to match the following properties:
- The corresponding restriction site must not be found in the E.Coli genome;
- The enzyme has to have high specifity;
- It has to work in wide range of different conditions (pH, T°, etc)
- Choose a strong yet tightly repressible promoter to regulate the restriction enzyme expression;
- Clone circuits with different combinations of the chosen restriction enzymes and promoters;
- Measure the degradation efficiency of the restriction enzyme for each circuit;
- Based on the best combination, design a self-disruption plasmid.
Design
According to the first two of our objectives, we should find an appropriate restriction enzyme and to choose a strong yet tightly repressible promoter to regulate its expression.
Restriction enzyme candidates:
- Fse I is a restriction endonuclease which recognizes an 8bp long DNA sequence: GGCCGG▽CC (CC△GGCCGG). The reason why we chose it is because it has the lowest number of restriction sites in the E.coli genome: only 4 copies. We decided to use MAGE to remove those sites from the chromosome (see for more details). However, MAGE did not have the expected yield, and we decided to freeze the work on this restriction enzyme and focus on the second candidate.
- I-SceI is an intron-encoded endonuclease. It is present in the mitochondria of Saccharomyces cerevisiae and recognises an 18-base pair sequence 5'-TAGGGATAA▽CAGGGTAAT-3' (3'-ATCCC△TATTGTCCCATTA-5') and leaves a 4 base pair 3' hydroxyl overhang. It is a rare cutting endonuclease. Statistically an 18-bp sequence will occur once in every 6.9*10^10 base pairs or once in 20 human genomes.
Promoter candidates:
- pLac
- Standard pLac promoter from the Parts Registry: [http://partsregistry.org/Part:BBa_R0011 R0011].[7]
- pBad
- Standard pBad promoter from the Parts Registry: [http://partsregistry.org/Part:BBa_I13453 I13453].[8]
- pRha L-rhamnose-inducible promoter is capable of high-level protein expression in the presence of L-rhamnose, it is also tightly regulated in the absence of L-rhamnose and by the addition of D-glucose.
- pRha is probably the best candidate for us because of two reasons:
- It is a new promoter, and so it will be orthogonal to any other existing system. It supports the modularity idea of our project.
- It was reported in the literature to be appropriate for the expression of toxic genes.
- L-rhamnose is taken up by the RhaT transport system, converted to L-rhamnulose by an isomerase RhaA and then phosphorylated by a kinase RhaB. Subsequently, the resulting rhamnulose-1-phosphate is hydrolyzed by an aldolase RhaD into dihydroxyacetone phosphate, which is metabolized in glycolysis, and L-lactaldehyde. The latter can be oxidized into lactate under aerobic conditions and be reduced into L-1,2-propanediol under unaerobic conditions.[7]
- The genes rhaBAD are organized in one operon which is controlled by the rhaPBAD promoter. This promoter is regulated by two activators, RhaS and RhaR, and the corresponding genes belong to one transcription unit which is located in opposite direction of rhaBAD. If L-rhamnose is available, RhaR binds to the rhaPRS promoter and activates the production of RhaR and RhaS. RhaS together with L-rhamnose in turn binds to the rhaPBAD and the rhaPT promoter and activates the transcription of the structural genes. However, for the application of the rhamnose expression system it is not necessary to express the regulatory proteins in larger quantities, because the amounts expressed from the chromosome are sufficient to activate transcription even on multi-copy plasmids. Therefore, only the rhaPBAD promoter has to be cloned upstream of the gene that is to be expressed. Full induction of rhaBAD transcription also requires binding of the CRP-cAMP complex, which is a key regulator of catabolite repression.[11]
- The pRha sequence was containing an EcoRI restriction site, so we had to disrupt it in order to use pRha as a biobrick. In order to decide which base pair to modify, we used the [http://microbes.ucsc.edu UCSC Microbial Genome Browser]. We compared the pRha sequence in E.coli and similar species, and identified that the at the position is sometimes replaced by a in some species, so we decided to replace it in a same way. We ordered a gBlock with the pRha sequence having the mutation, and this is the sequence we used and submitted.
- pRha is probably the best candidate for us because of two reasons:
Considering these candidates, we decided to clone the following constructs in low-copy vector pSB3C5 to use it in our experiments, all with a medium RBS [http://partsregistry.org/Part:BBa_B0032 B0032]:
| pBad & RBS & I-SceI | pRha & RBS & GFP | pBad & RBS & RFP |
| pLac & RBS & I-SceI | pRha & RBS & GFP | pLac & RBS & RFP |
| pRha & RBS & I-SceI | pRha & RBS & GFP | pRha & RBS & RFP |
Experiments and results
I-SceI is expressed and active in eliminating restriction-site harbouring plasmid
To measure the digestion efficiency of I-SceI, we transformed two plasmids with different antibiotic resistances into NEB Turbo E.Coli strain:
- First plasmid: Low copy plasmid with encoded generator to express I-SceI meganucllease. Three version with different promoters was tested: I-SceI meganuclease controlled by pBad, pLac and pRha. For all version:
- Backbone: pSB3C5
- Resistance: Chloramphenicol
- Origin of Replication: p15a
- Second plasmid: High copy plasmid with encoded I-SceI restriction site, [http://partsregistry.org/Part:BBa_K175027 K175027]. This biobrick was a kind gift of the TUDelft iGEM team which we further characterized.
- Backbone: pSB1AK3
- Resistance: Ampicillin and Kanamycin
- Origin of Replication: modified pMB1 derived from pUC19
We expected to perform transformation with both plasmids, and plate with two antibiotics in order to select for double transformants. We would then induce I-SceI expression in those clones to measure its efficiency.
Transformation results
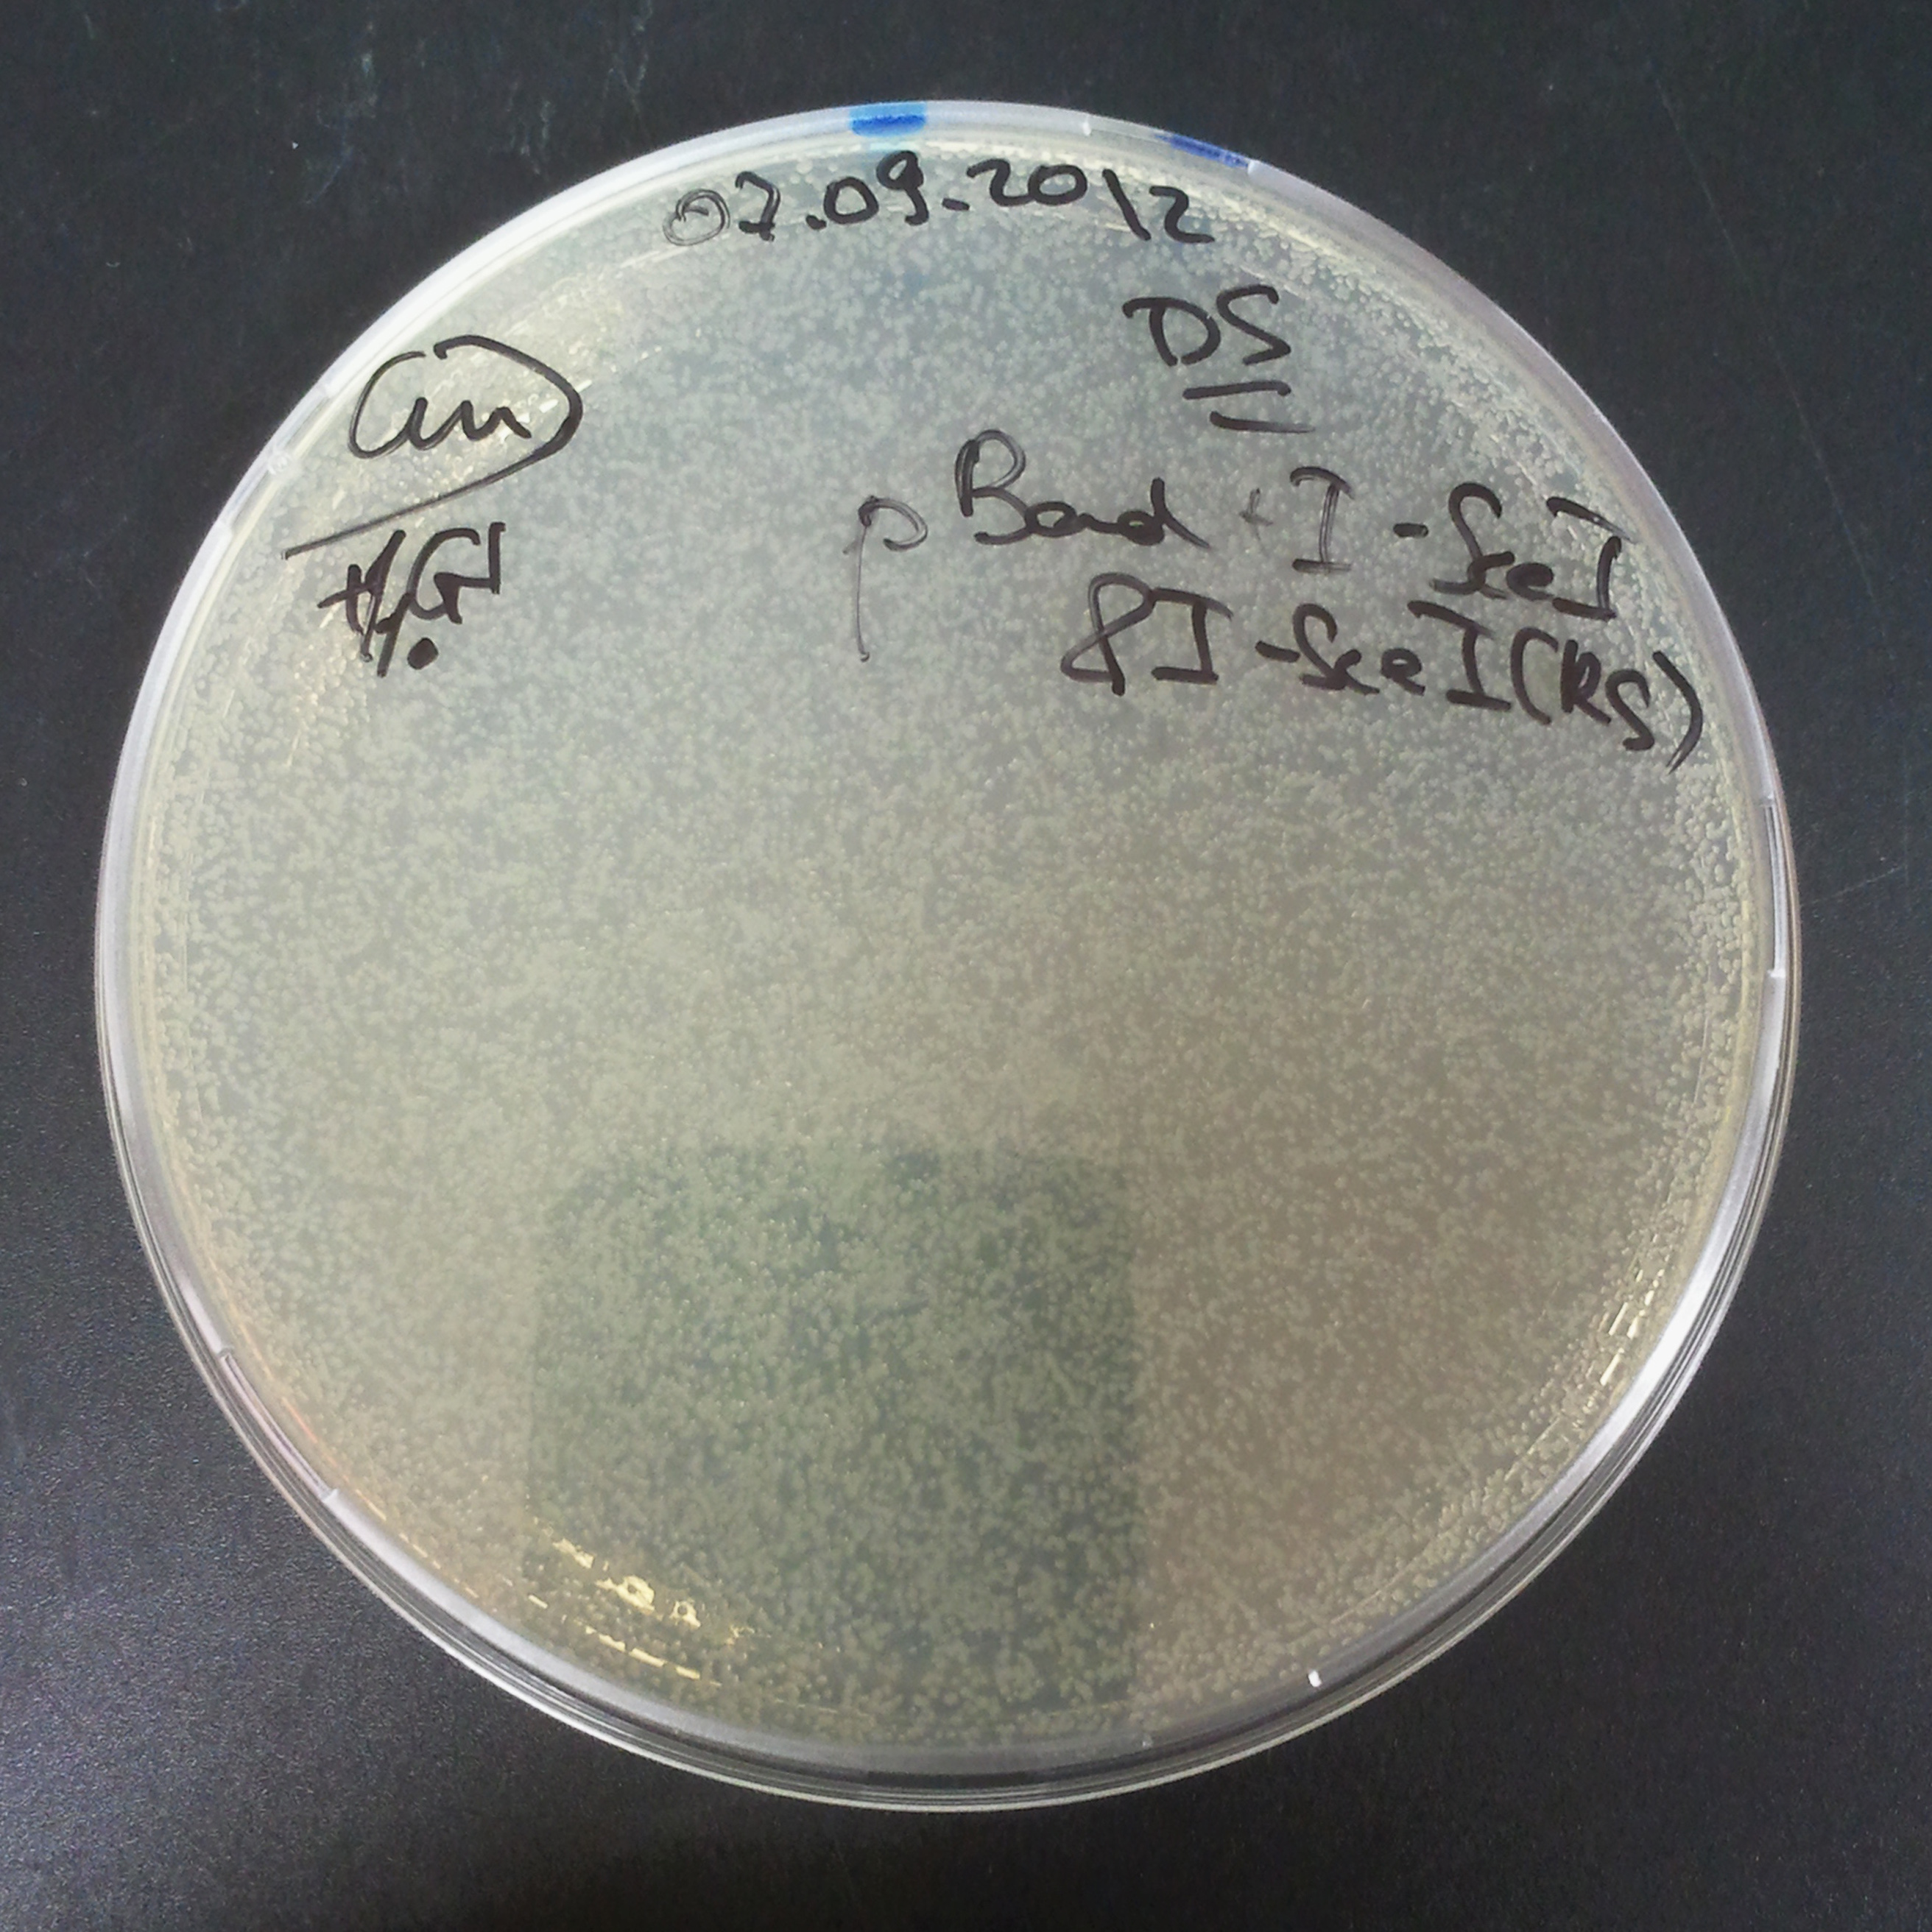
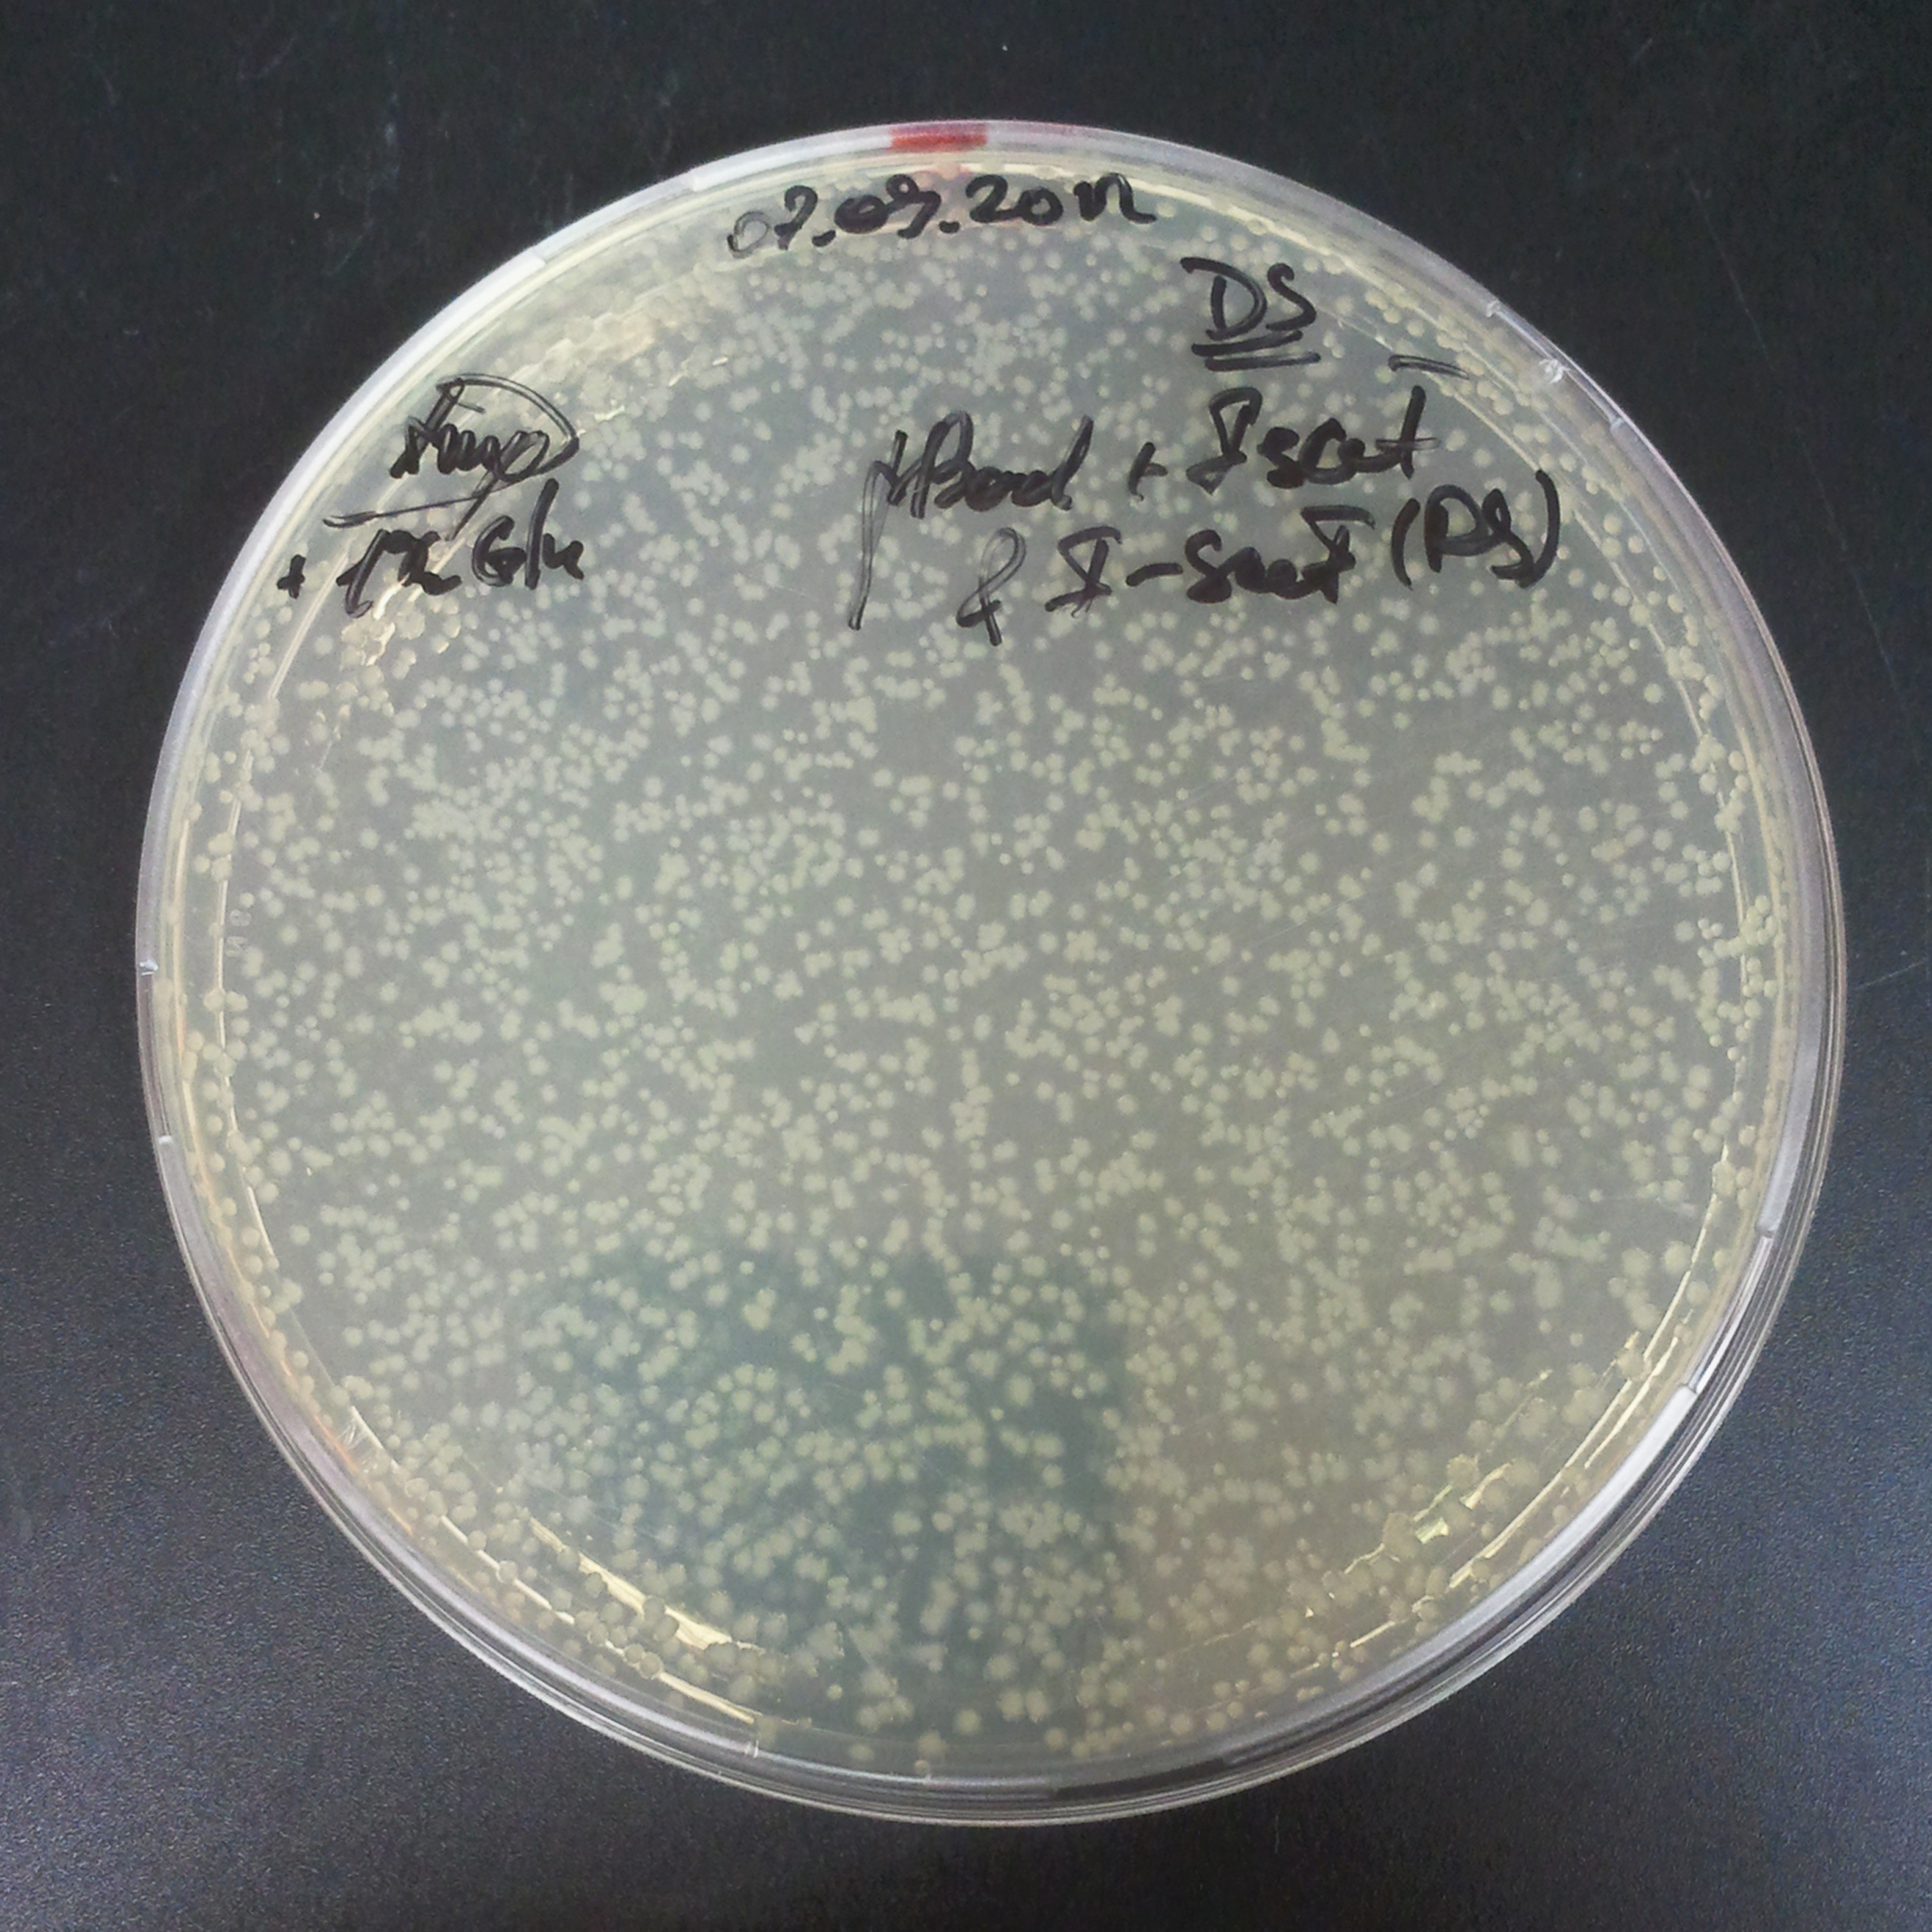
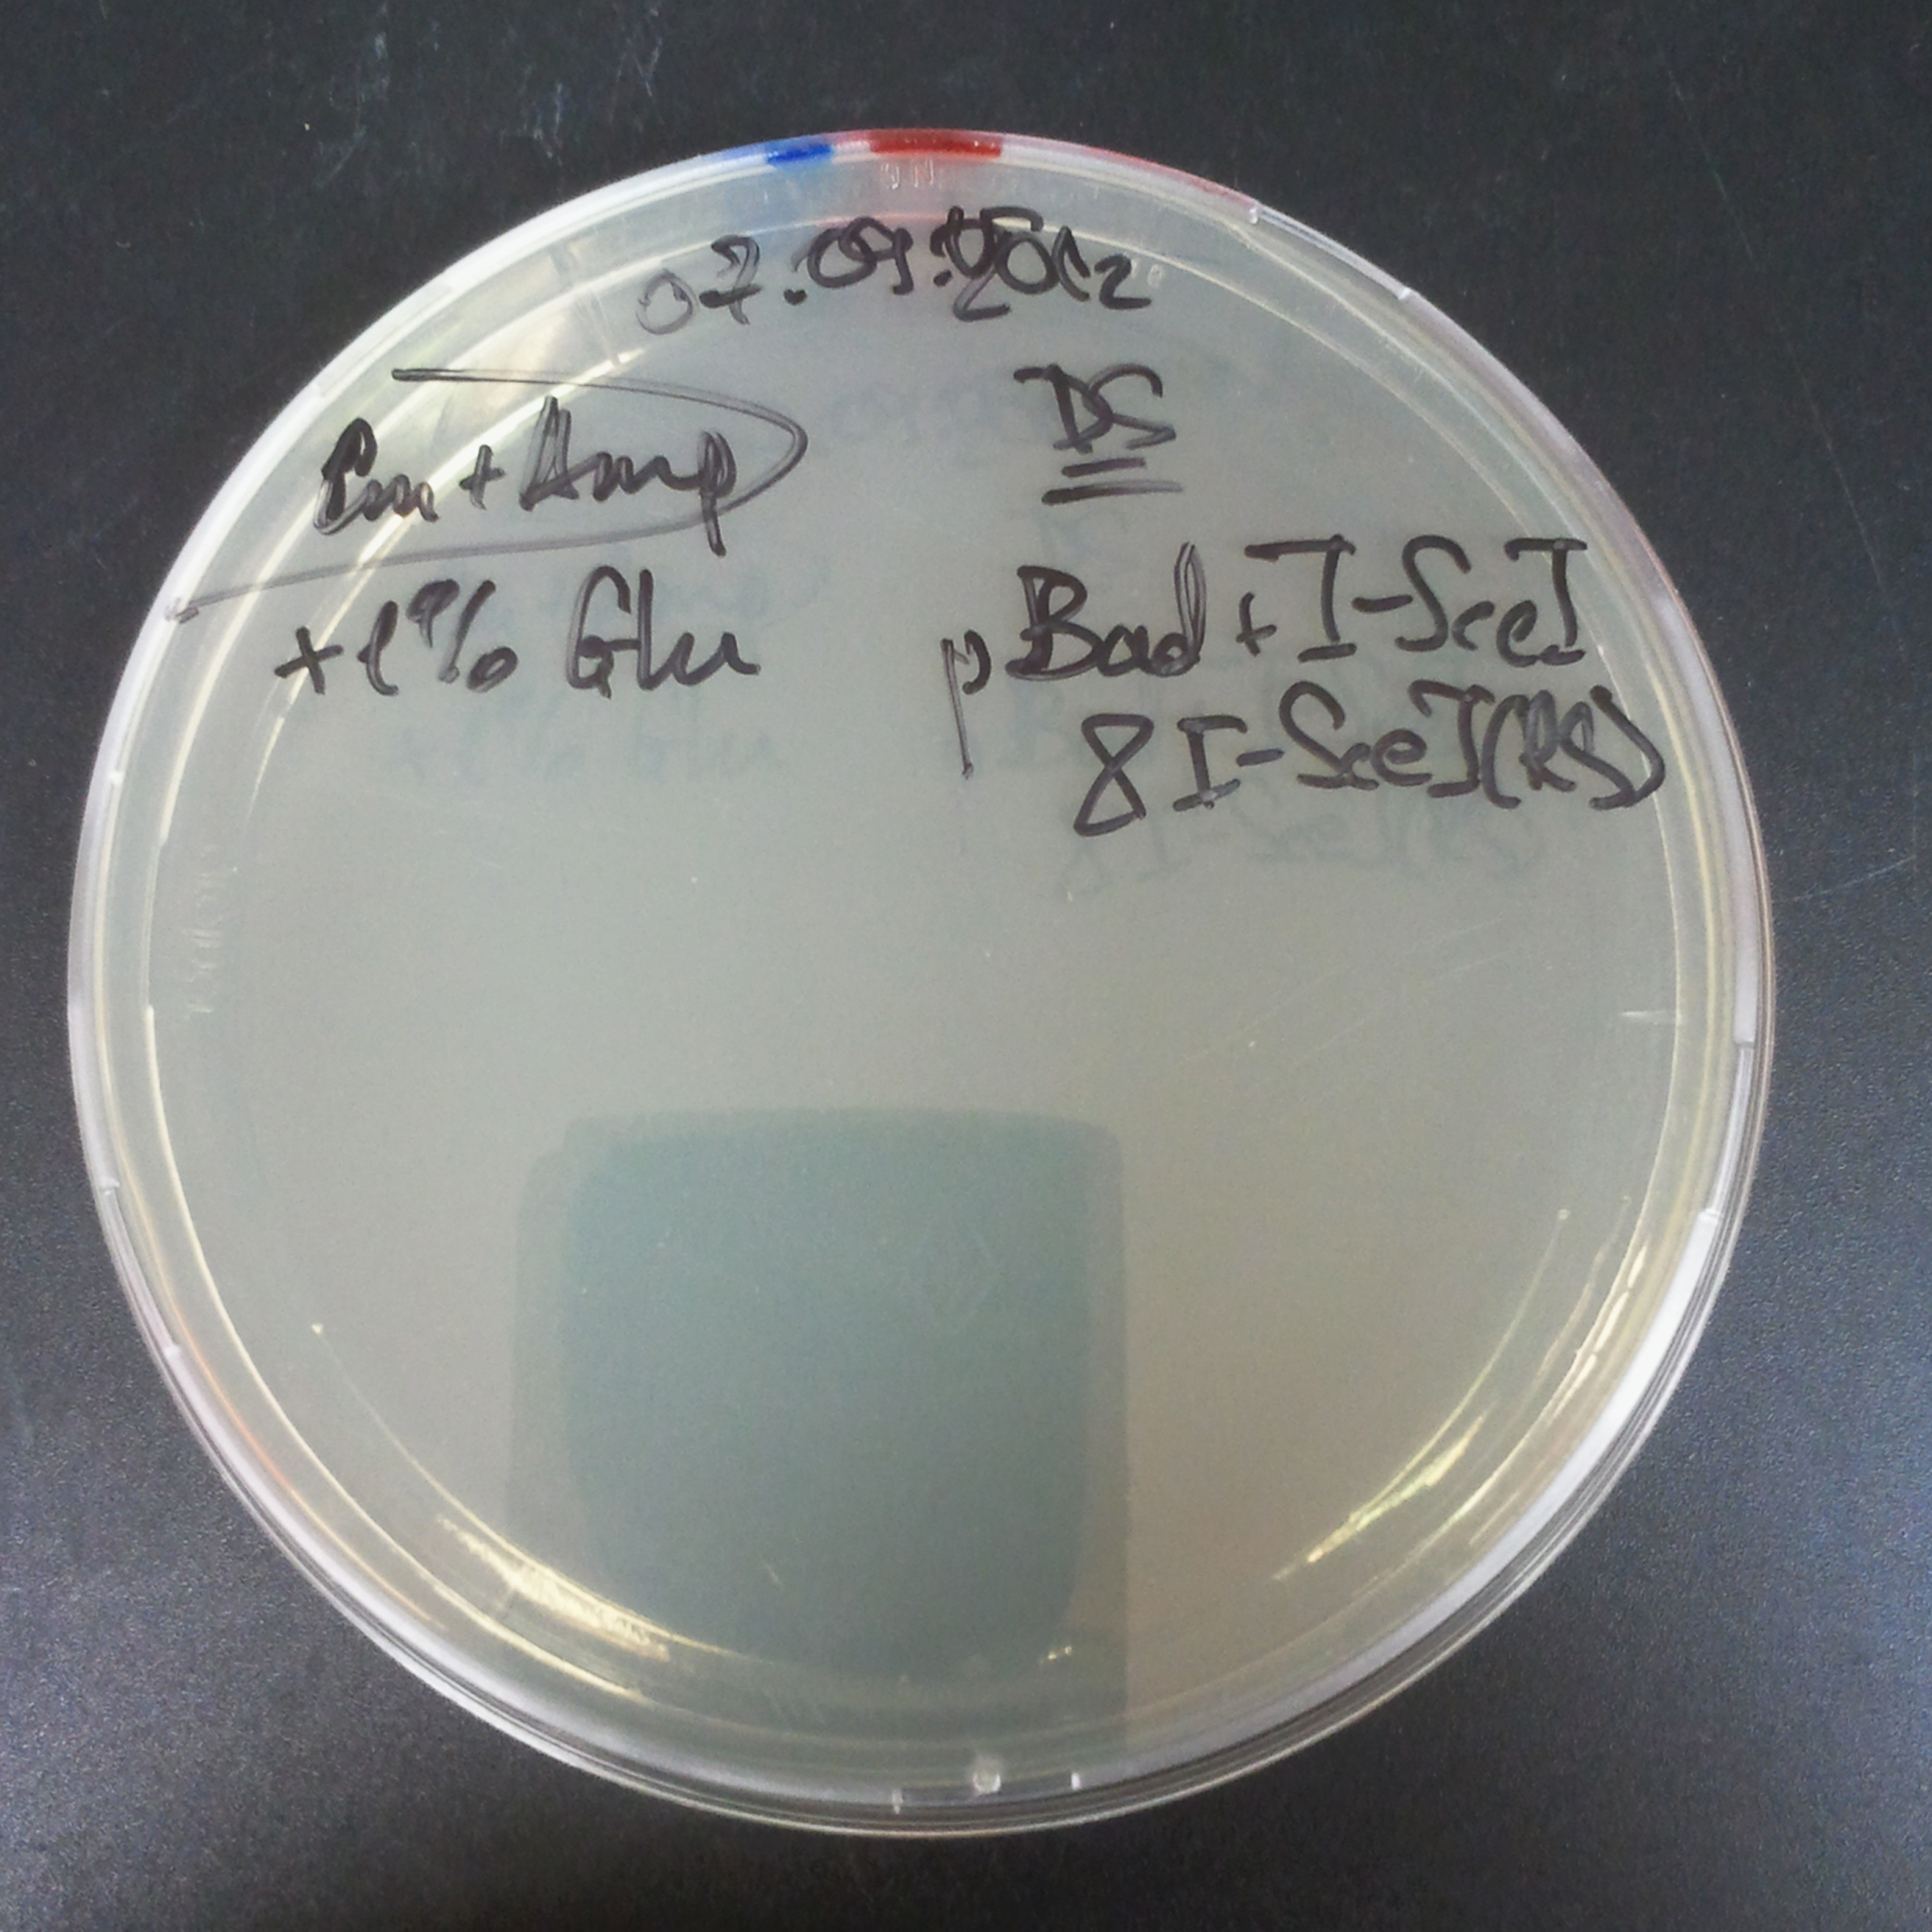
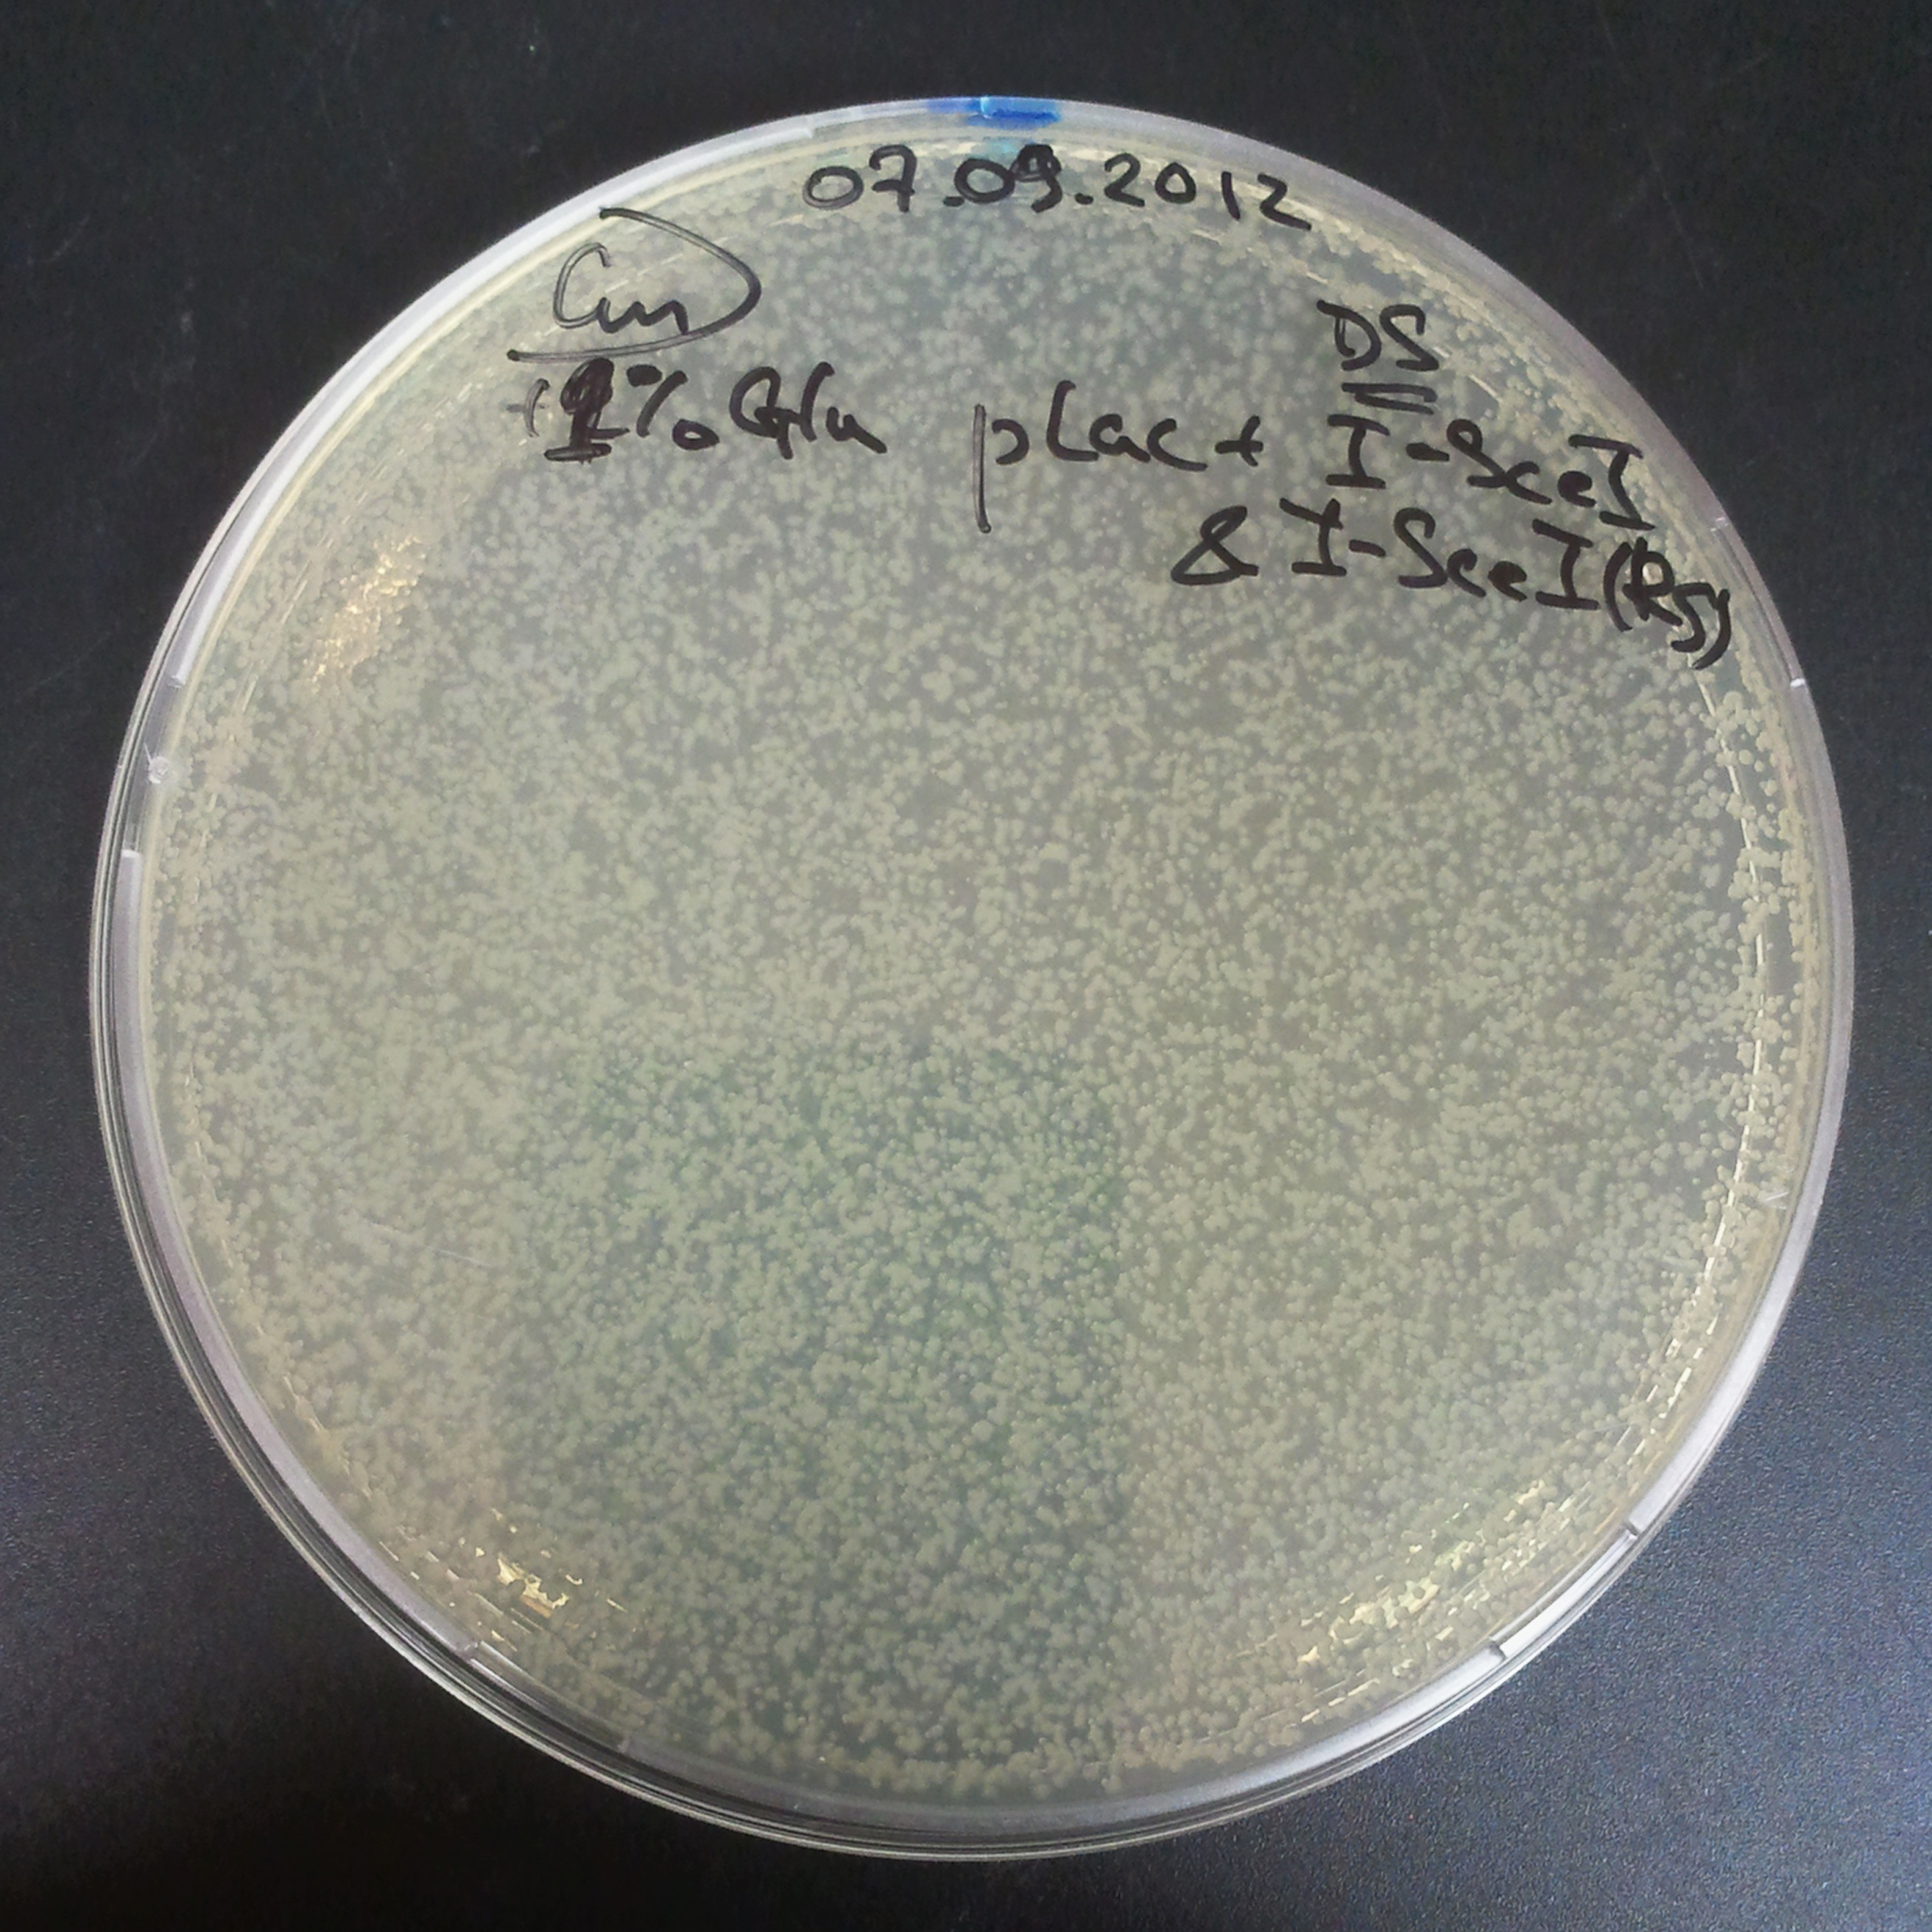
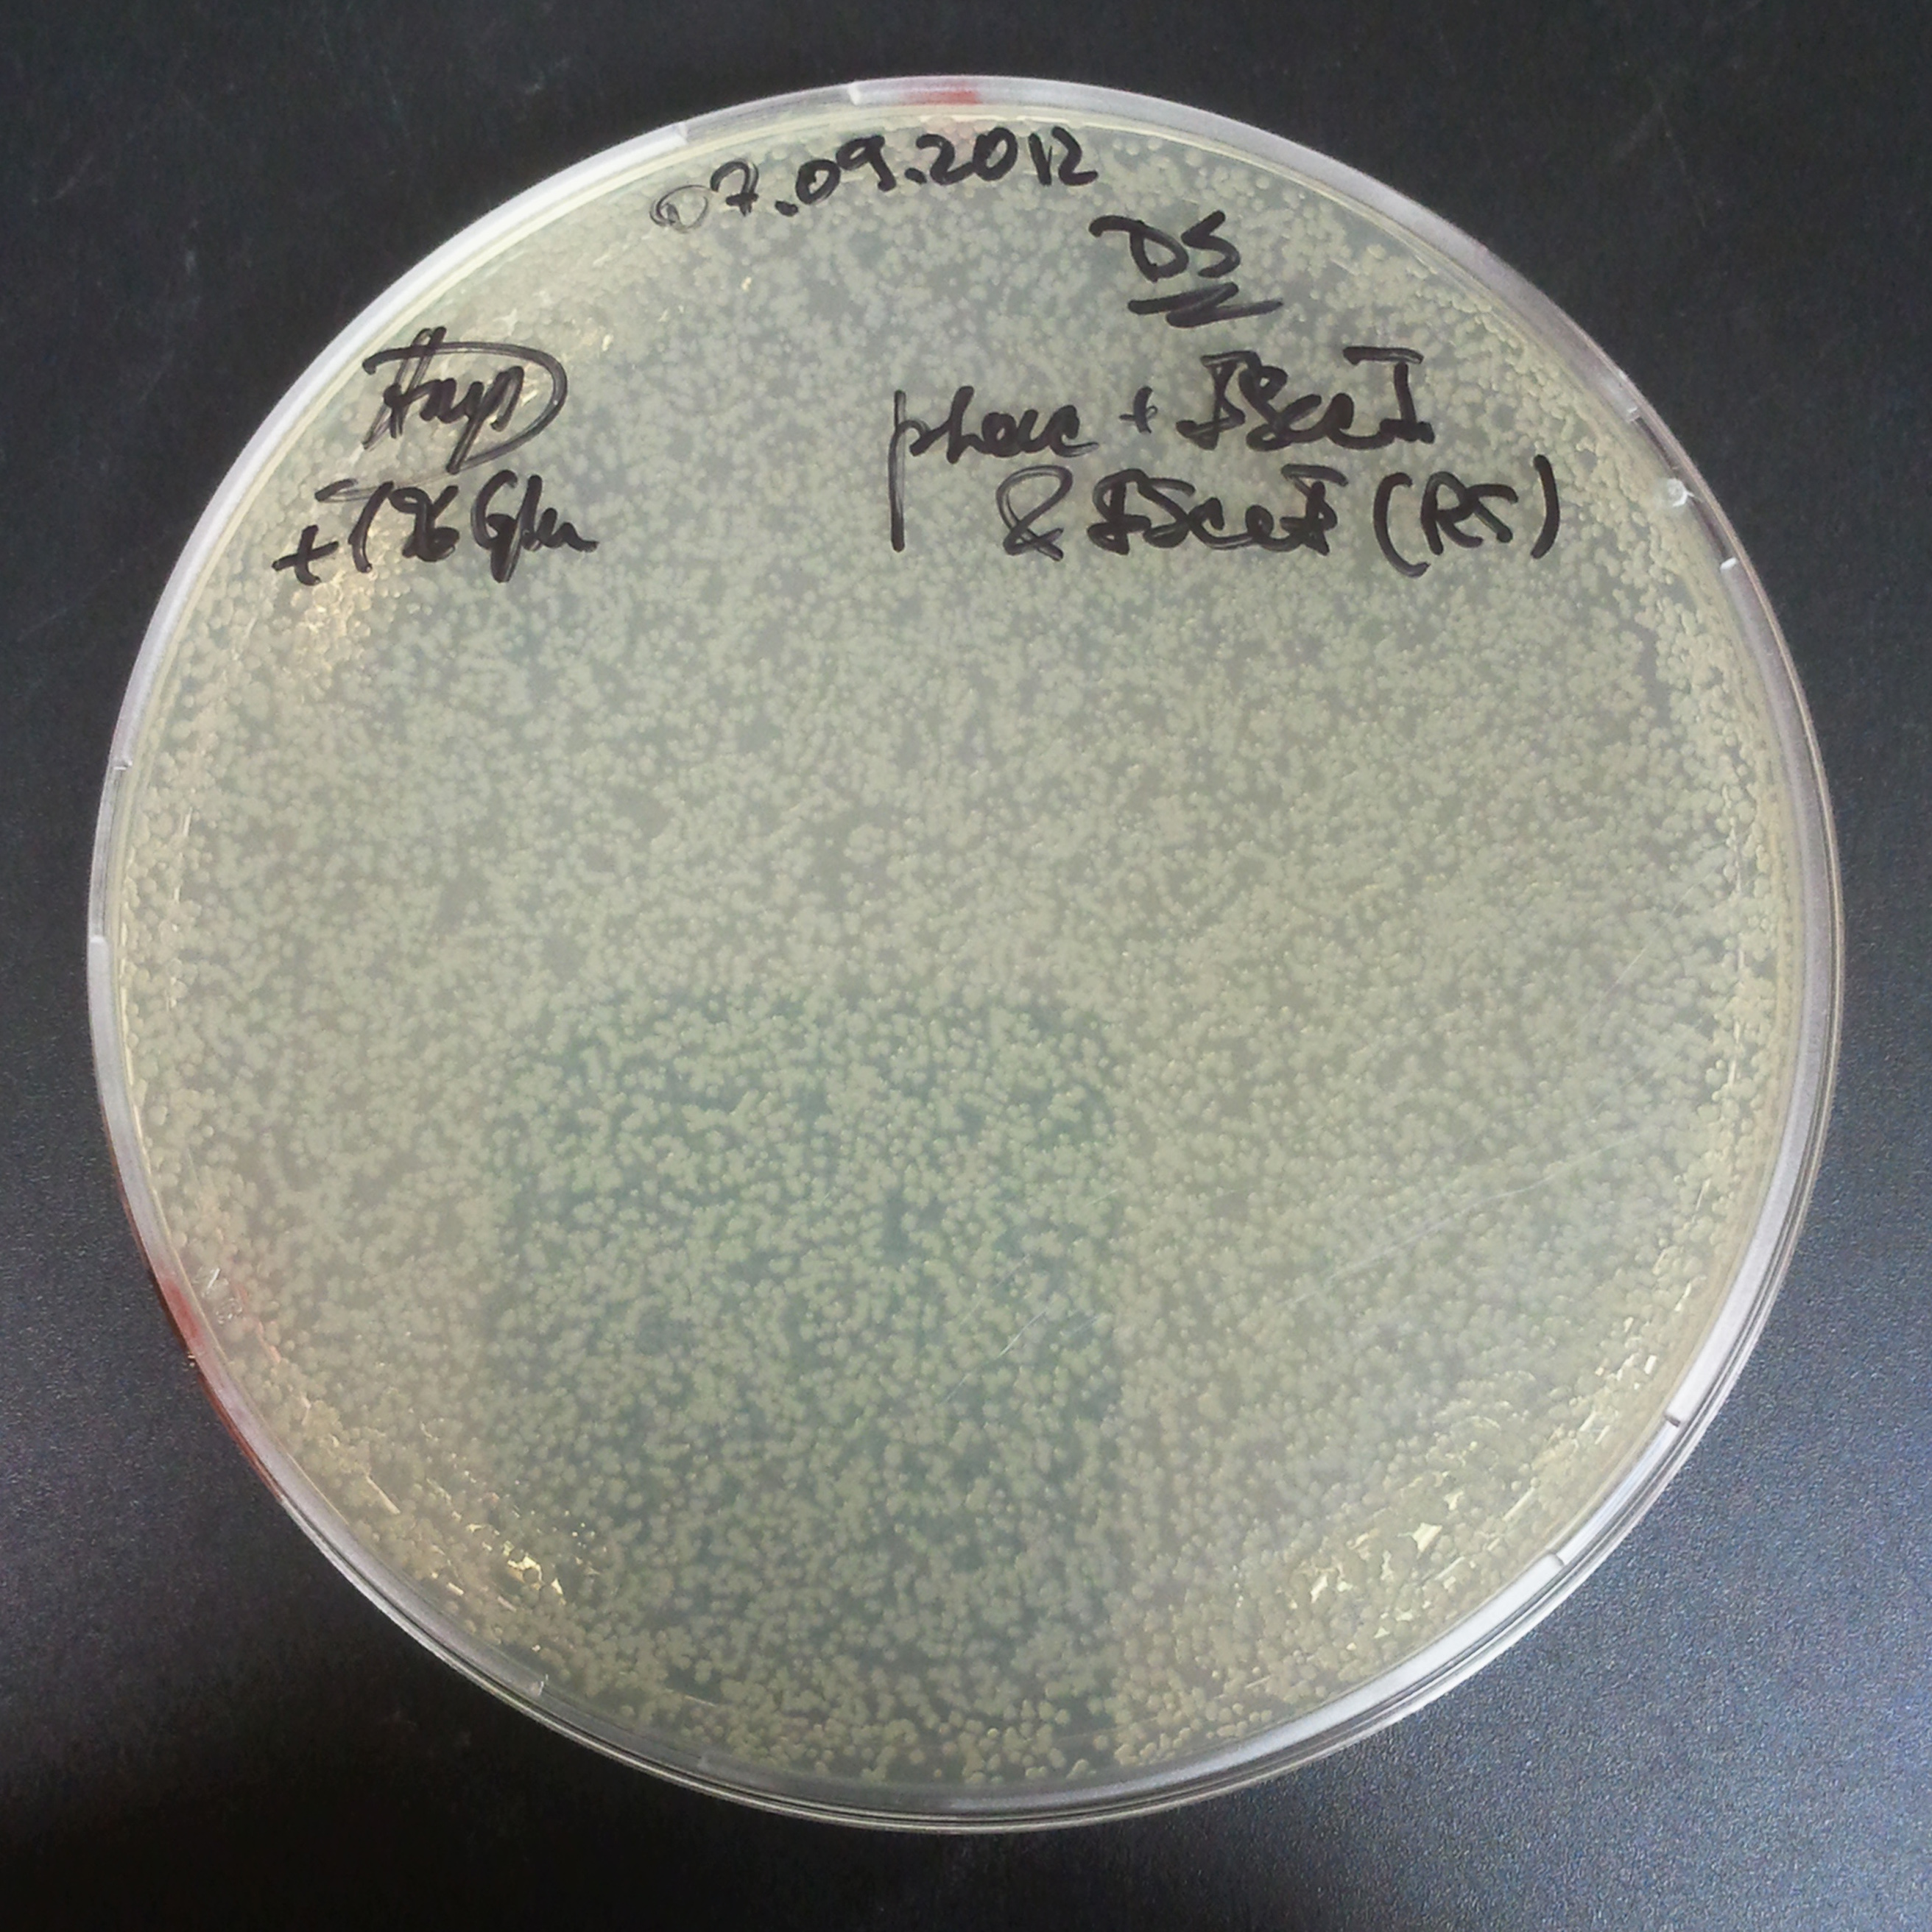
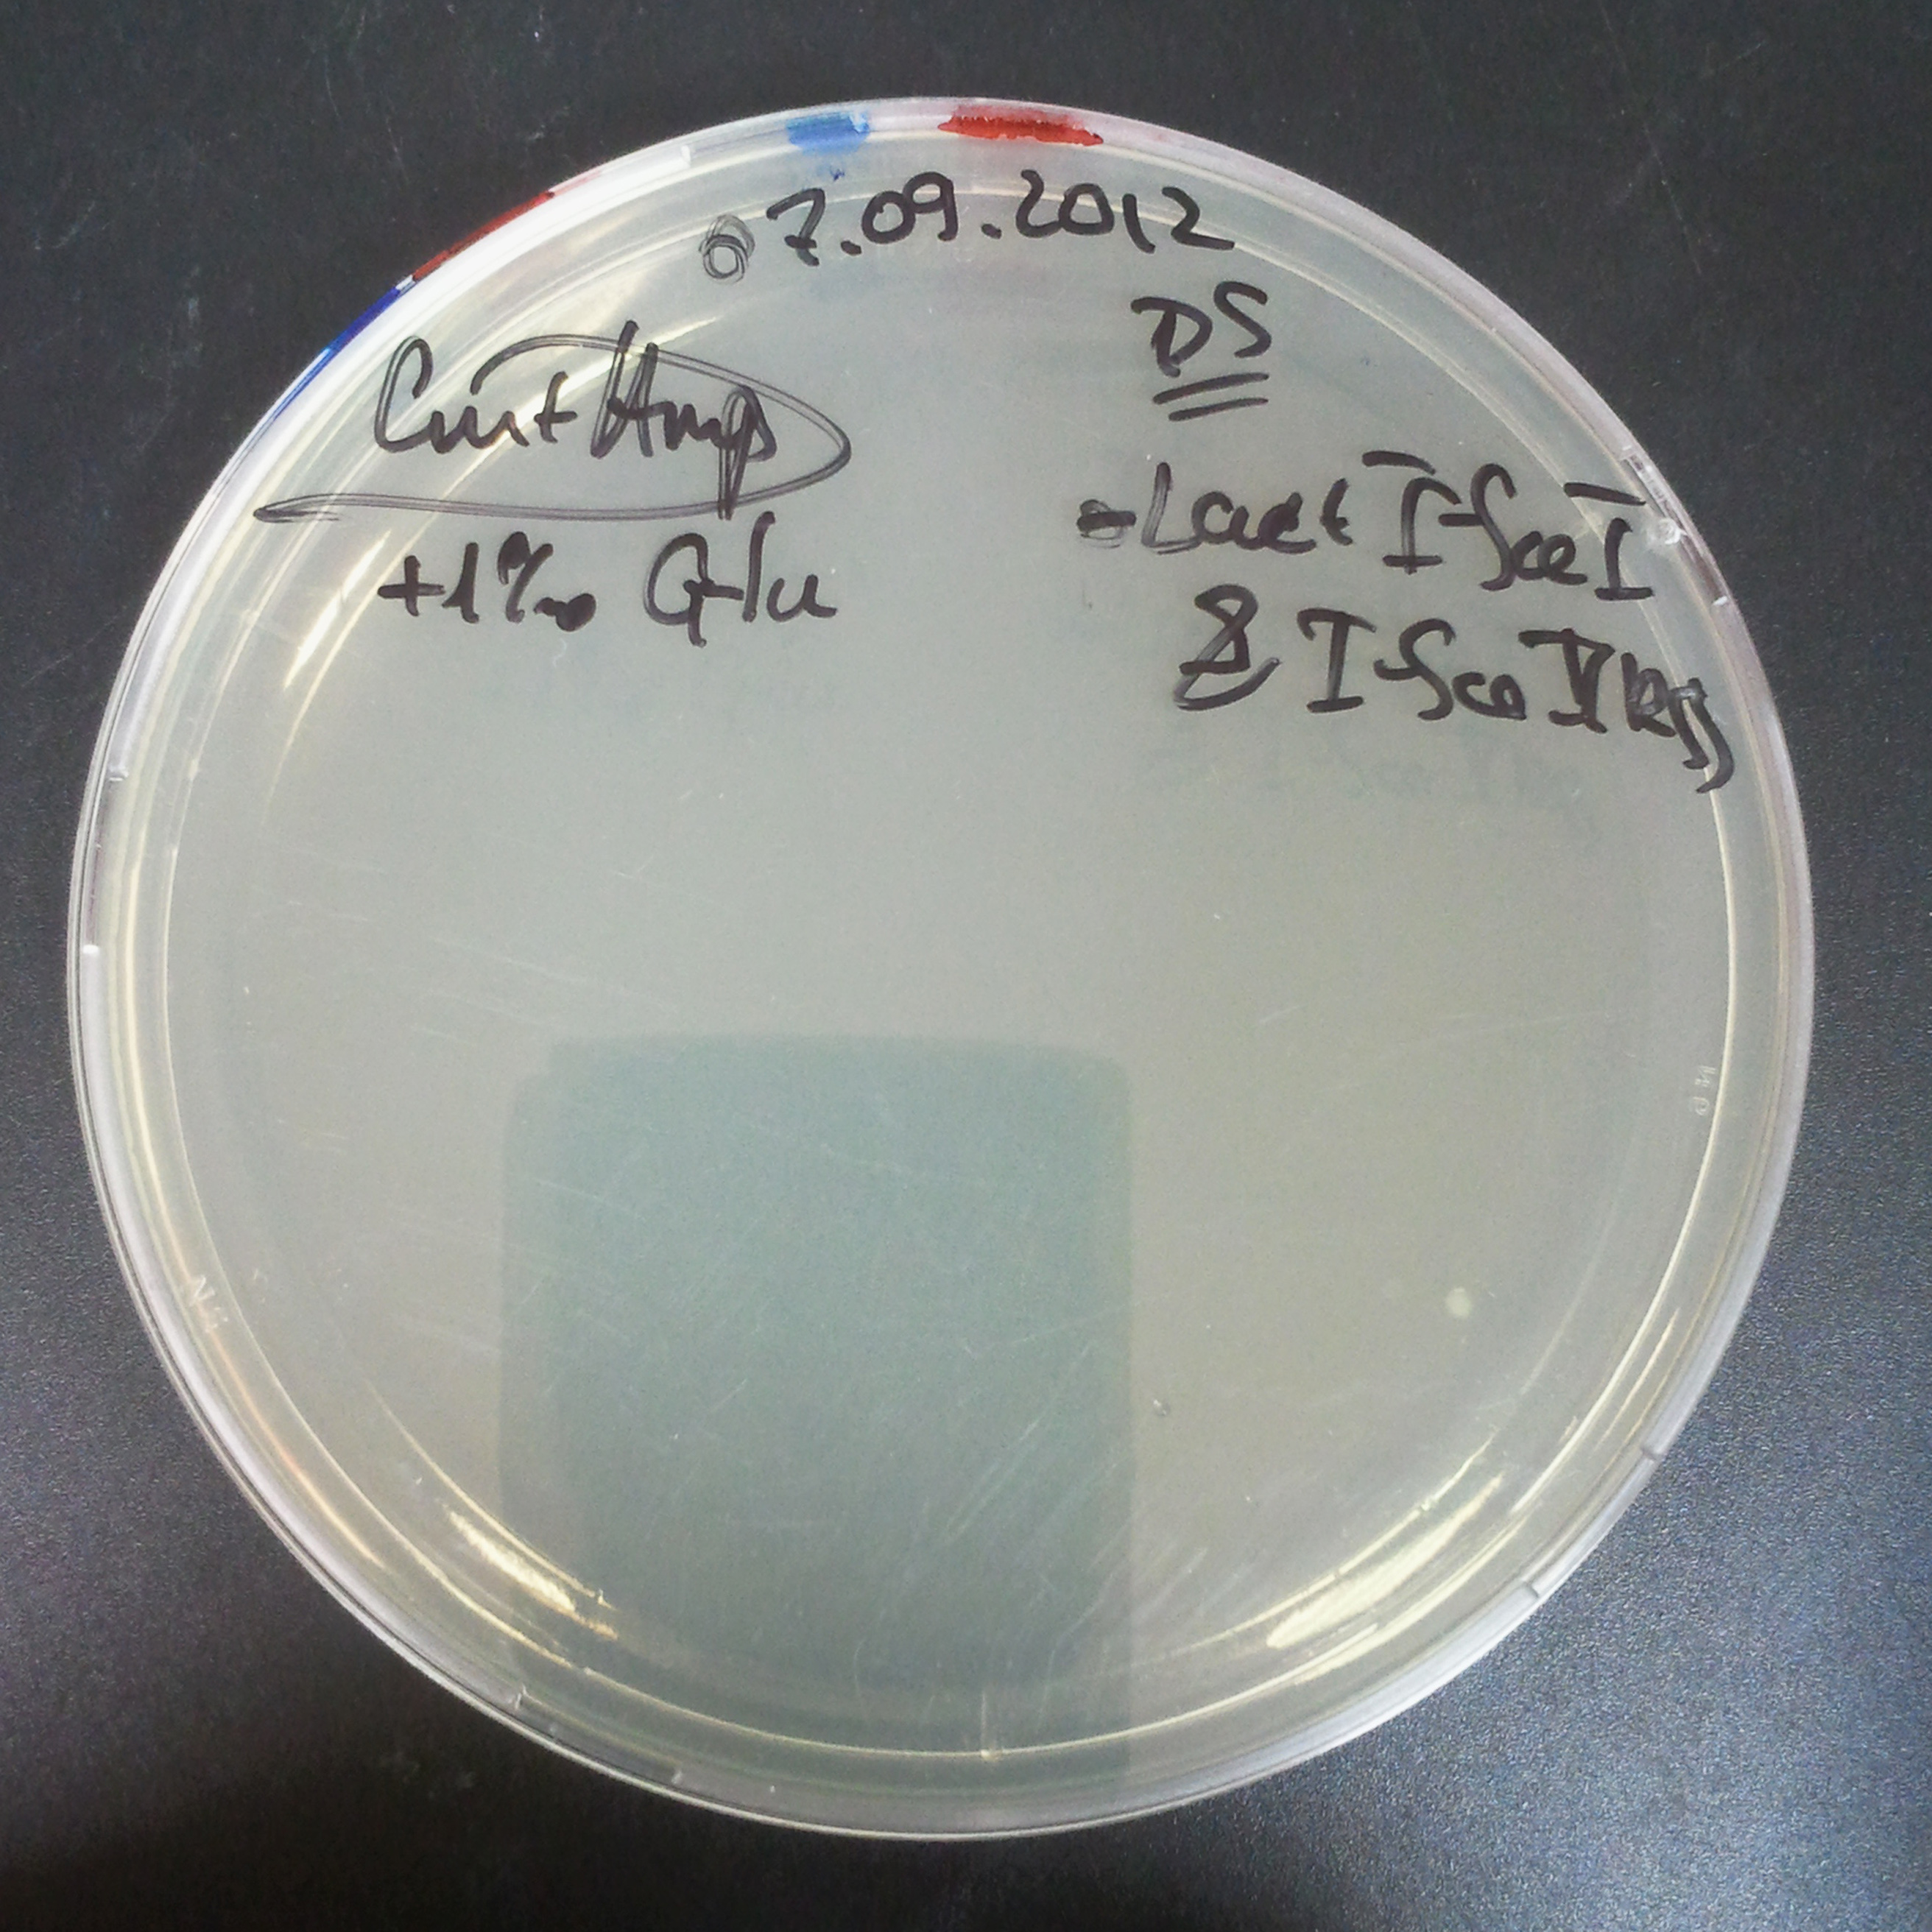
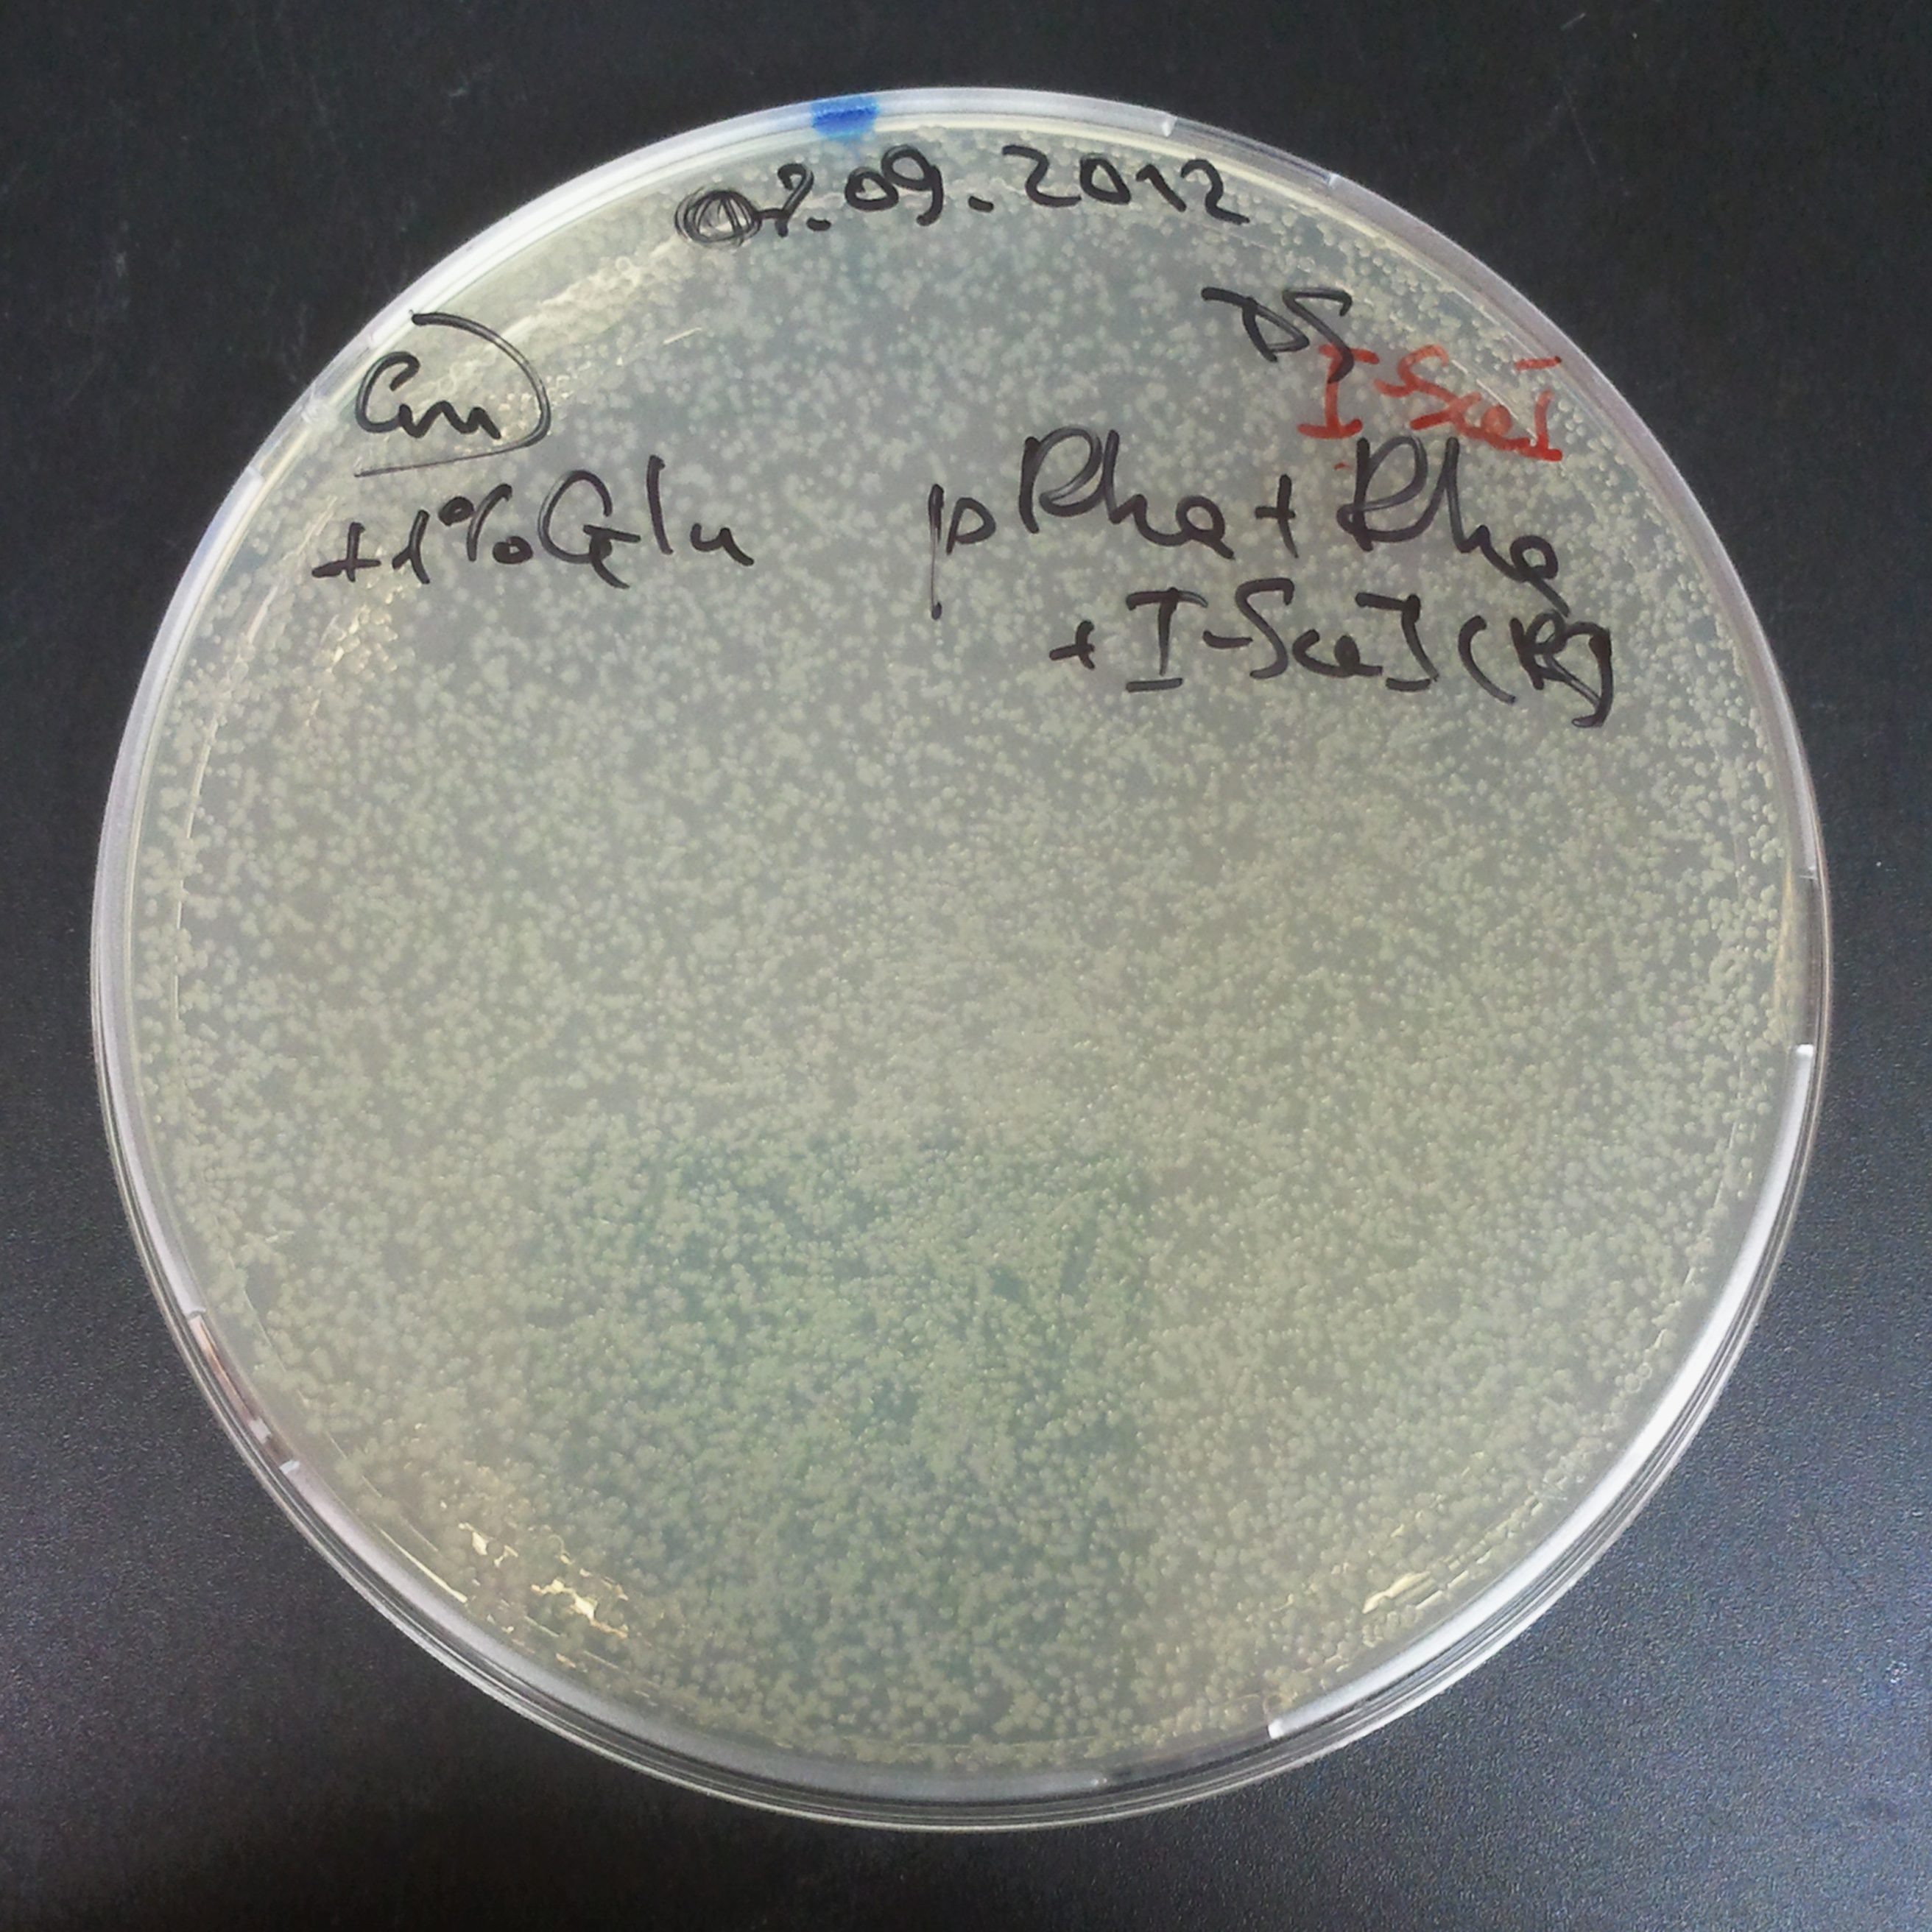
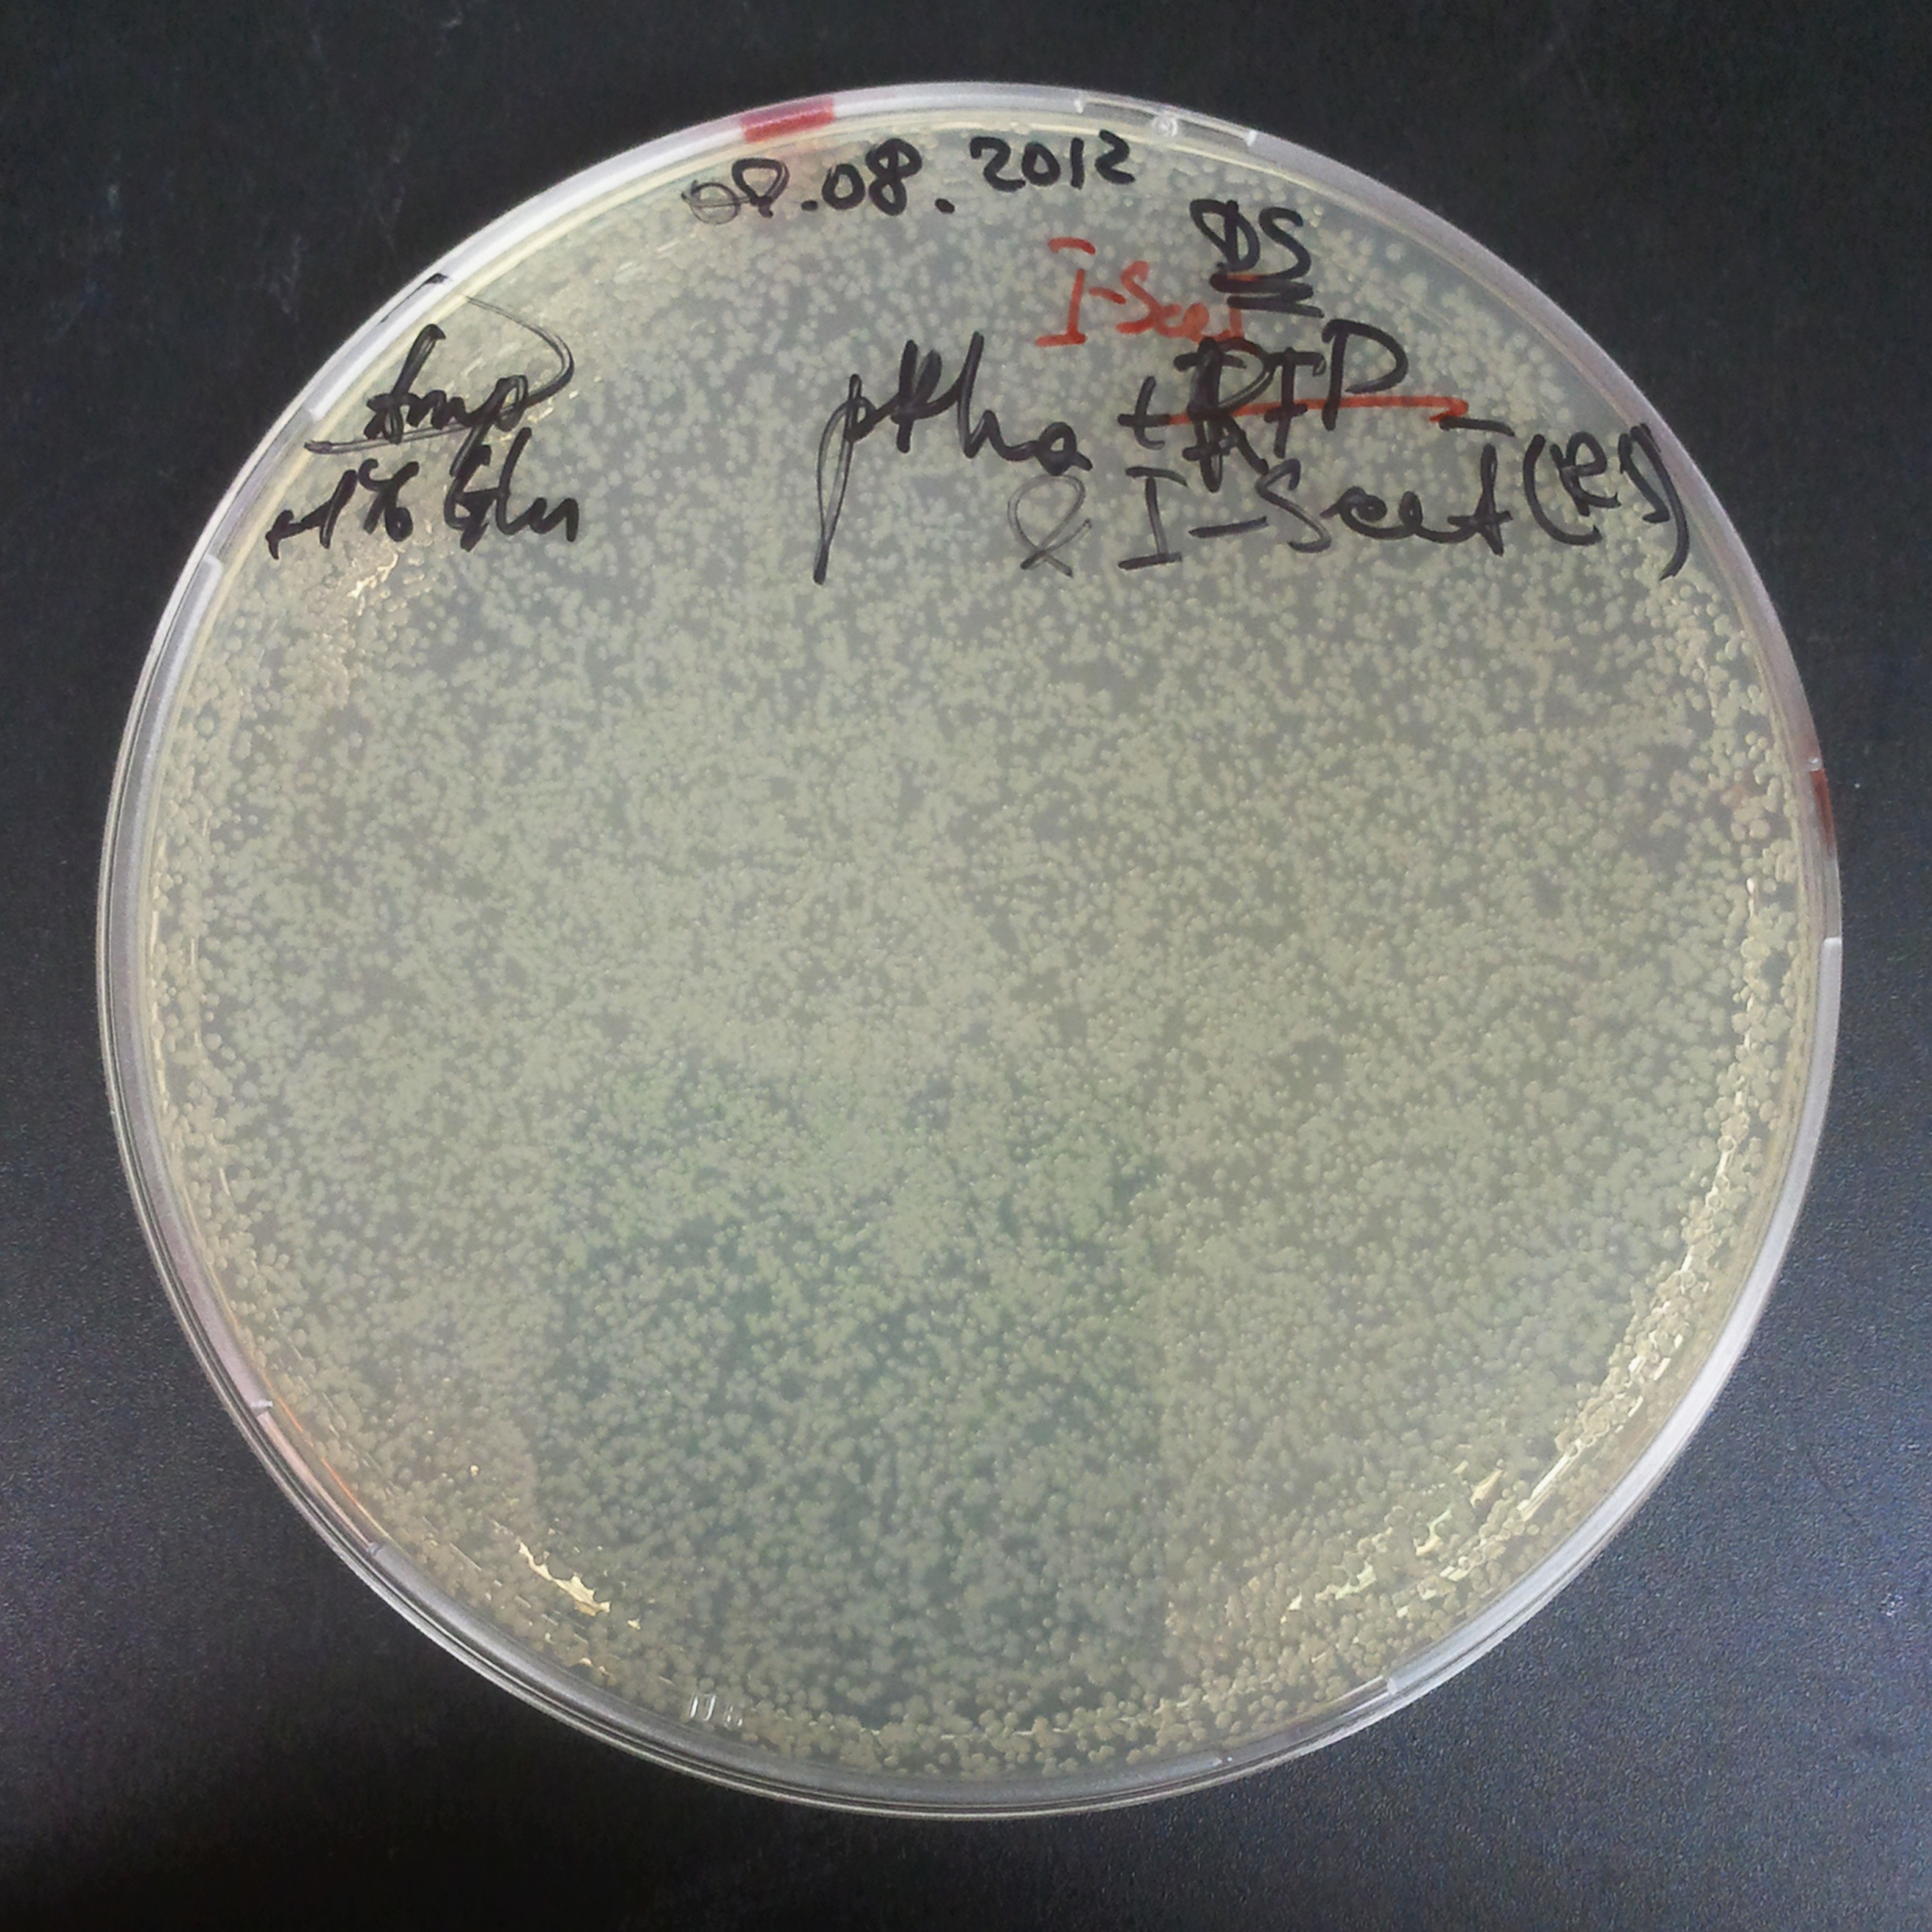
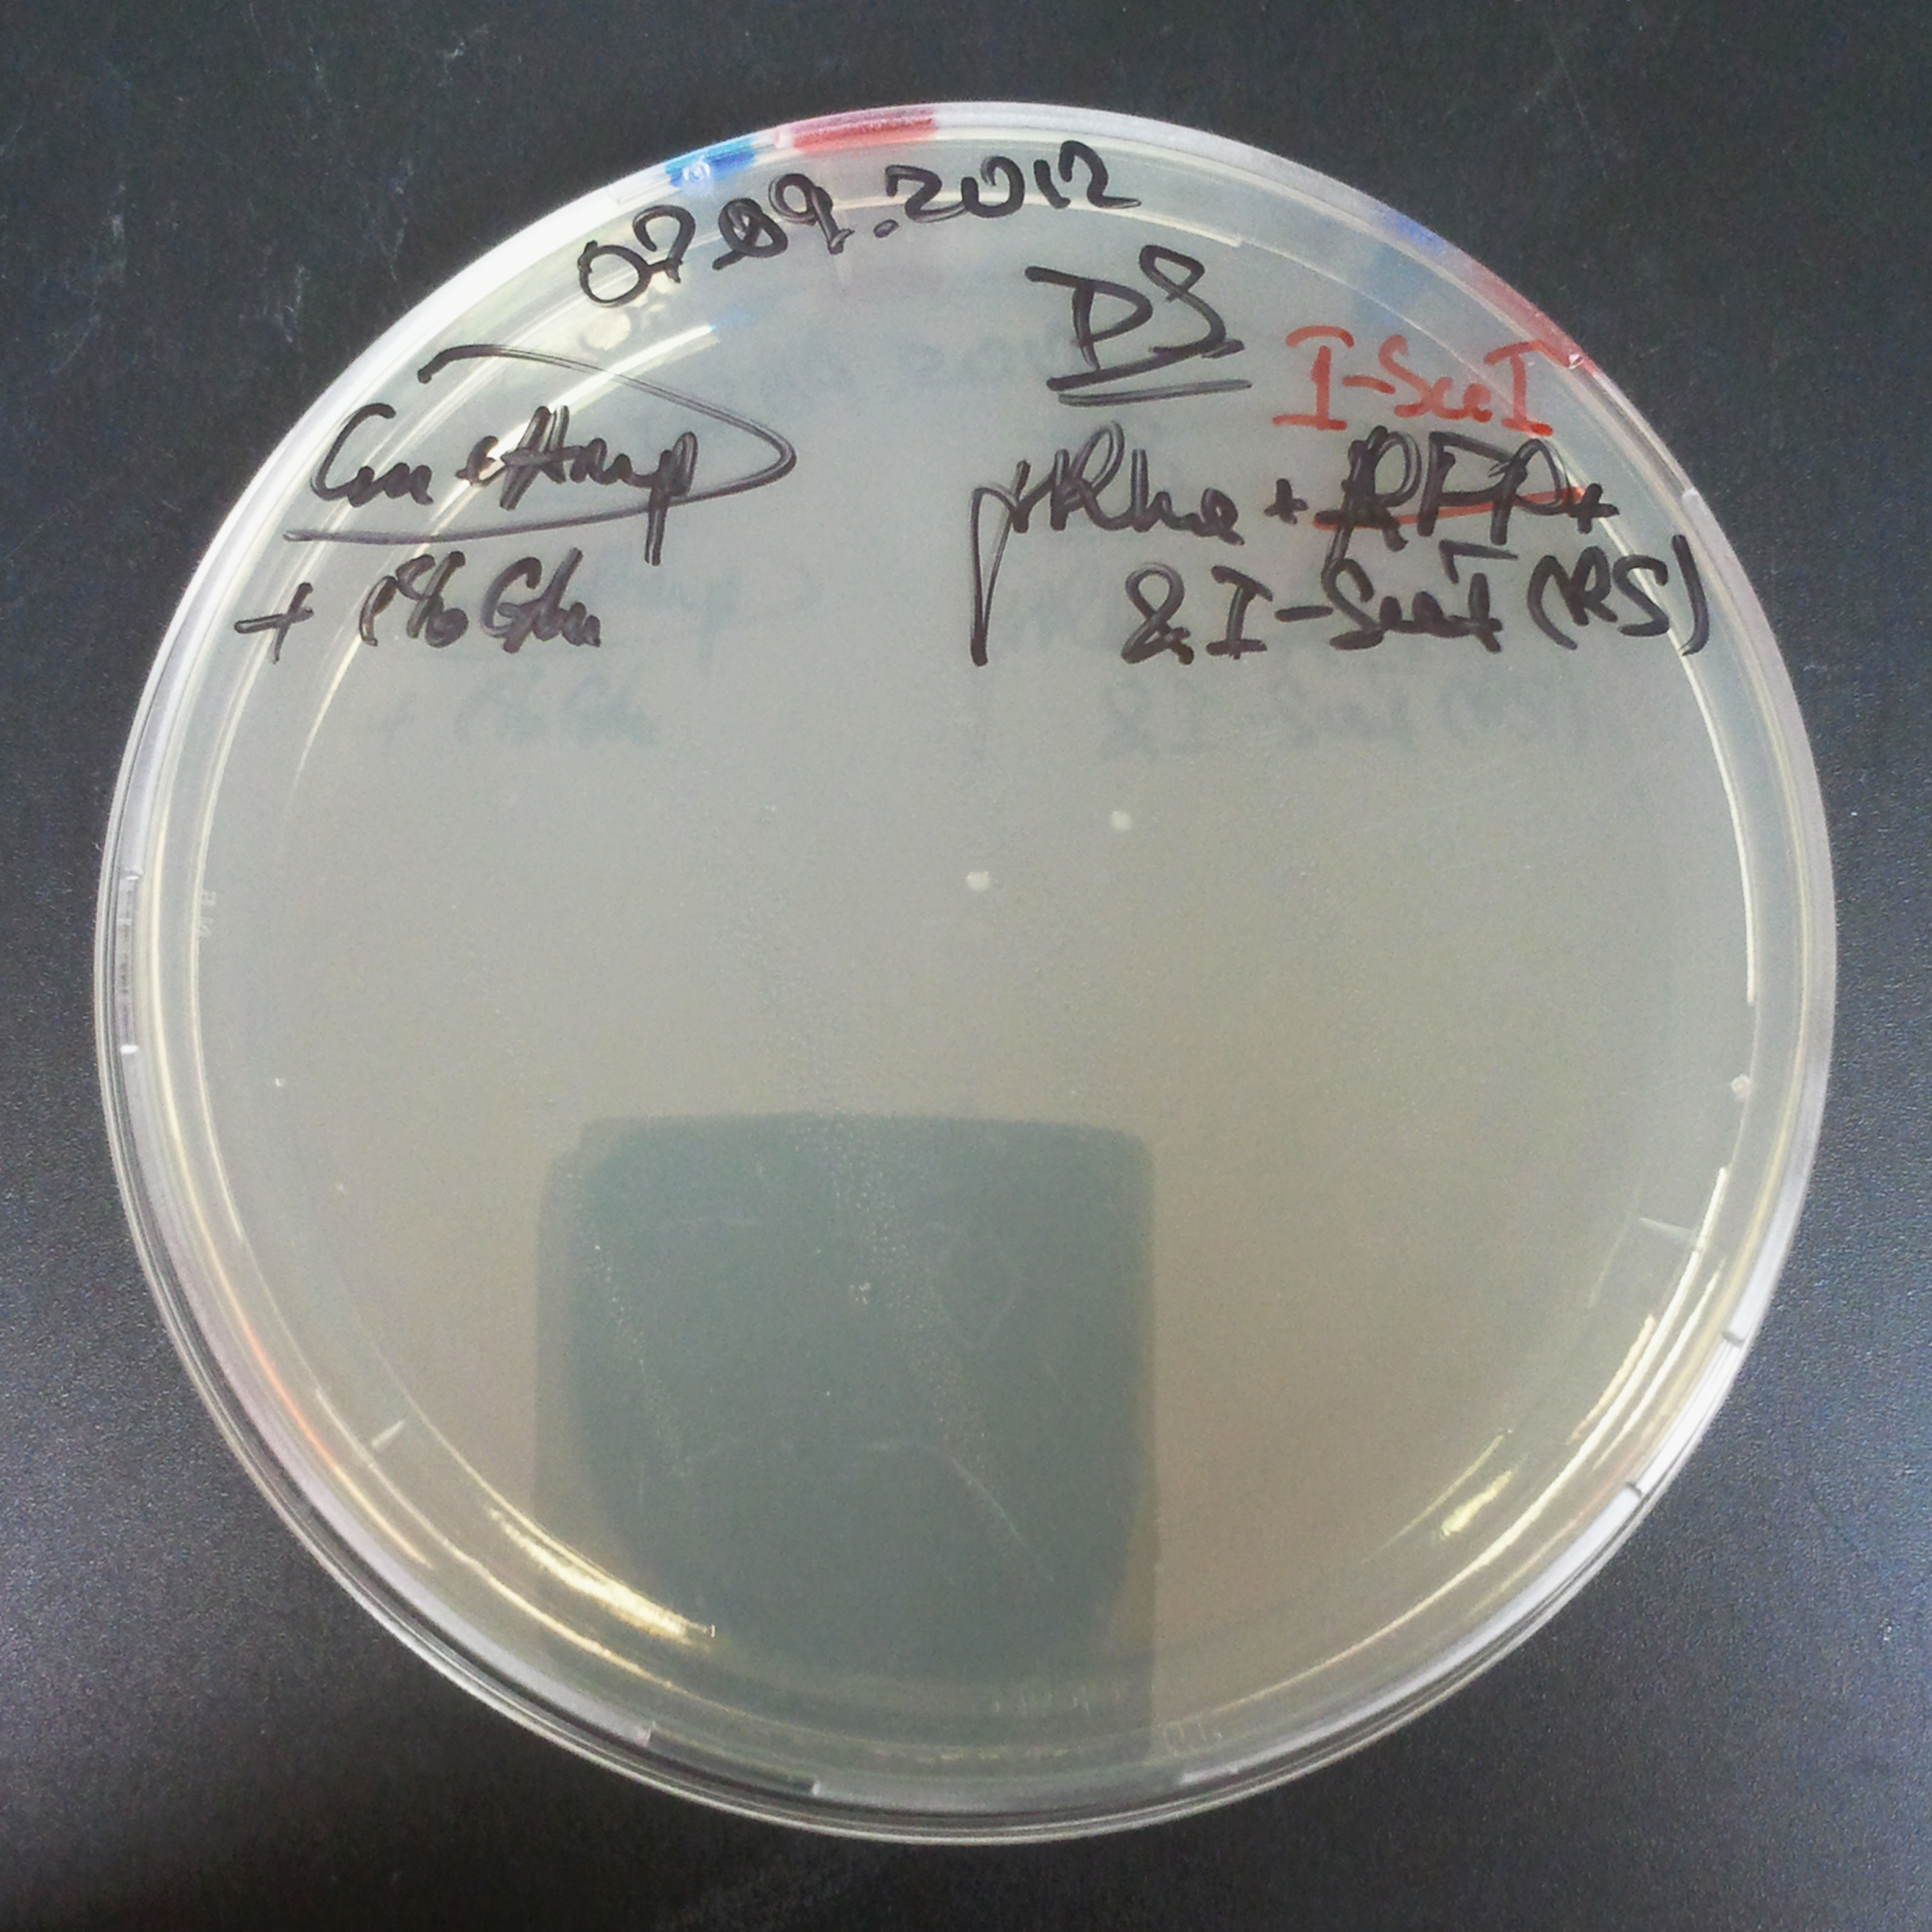
From the experiment we can clearly see that on plates with two antibiotics (Chloramphenicol, Cm; & Ampicillin, Amp) there are no colonies, while on plates with only one antibiotic Cm or Amp there are numerous colonies.
The first combination of plasmids:
- First plasmid: pBad & RBS & I-SceI [Cm]
- Second plasmid: I-SceI restriction site [Amp]
The second combination of plasmids:
- First plasmid: pLac & RBS & I-SceI [Cm]
- Second plasmid: I-SceI restriction site [Amp]
The third combination of plasmids:
- First plasmid: pRha & RBS & I-SceI [Cm]
- Second plasmid: I-SceI restriction site [Amp]
We suggested two hypotheses to explain the results:
- Those two plasmids are not compatible. Plasmids could have different origins of replication. That might be the reason why double transformation is unsuccessful.
- Our system works. Our system perfectly works, but there is some leakage in the promoter leading to the expression of I-SceI meganuclease. In such case, it very efficiently cuts I-SceI restriction site, digesting the second plasmid with ampicillin resistance.
First, we decided to check the hypothesis 1, and verify if two plasmids are compatible with each other.
Control for plasmid compatibility
As control experiment, we decided to trasform two plasmids into NEB Turbo E.Coli strain. The first plasmid in this experiment is analogous to the one from the previous experiment, but with GFP insted of I-SceI meganuclease; the second plasmid is the same as in the previous experiment:
- First plasmid: Low copy plasmid with encoded generator to express GFP meganucllease. Only the version with pLac promoter was tested, because they all have the same backbone plasmid, and consequently the same replication prigin.
- Backbone: pSB3C5
- Resistance: Chloramphenicol
- Origin of Replication: modified pMB1 derived from pUC19
- Second plasmid: High copy plasmid with encoded I-SceI restriction site, [http://partsregistry.org/Part:BBa_K175027 K175027].
- Backbone: pSB1AK3
- Resistance: Ampicillin and Kanamycin
- Origin of Replication: modified pMB1 derived from pUC19
We expected to have colonies on both type of plates: firstly, on plates with one antibiotic (Chloramphenicol & Ampicillin), secondly, on plates with both antibiotics.
Our expectations became true, and our cells expressed GFP, so we conclude these two plasmids have compatible replication origins, and there should be nothing preventing the I-SceI from being expressed in the previous experiment. That means that our circuits work, but there is some leaky expression of I-SceI meganuclease that leads to a very efficient digestion of the plasmid carrying the Ampicillin antibiotic.
Day light photos:
Photos of fluorescence:
To avoid leakage, in the next experiment we tried to recover cells after transformation and plate it in the presence of glucose that represses the pLac promoter.
Recovery in glucose
The first combination of plasmids:
- First plasmid: pBad & RBS & I-SceI [Cm]
- Second plasmid: I-SceI restriction site [Amp]
The second combination of plasmids:
- First plasmid: pLac & RBS & I-SceI [Cm]
- Second plasmid: I-SceI restriction site [Amp]
The third combination of plasmids:
- First plasmid: pRha & RBS & I-SceI [Cm]
- Second plasmid: I-SceI restriction site [Amp]
Results
Even if we recover the double transformants in the presence of Glucose to tightly repress the expression of the meganuclease, we still have no colonies on the plates containing both Amp and Cm. This is a sign that our construct is leaky, and the expression and function of I-SceI is so efficient that it digests all plasmids containing the corresponding restriction site, and the cells are no longer resistant to Amp.
Measuring the I-SceI efficiency (TUDelft parts)
In 2009, TUDelft iGEM Team has already tried to design a Self Destructive Plasmid based on I-SceI meganuclease. For their experiments, they designed a generator to produce I-SceI meganuclease and used the same pLac promoter, but they had two essential differences with our system:
- They used a [http://partsregistry.org/wiki/index.php?title=Part:BBa_B0030 strong RBS].
- I-SceI meganuclease they used had an LVA tag.
Moreover, they didn't submit the meganuclease alone as a biobrick, so it couldn't be used for constructing new composite biobricks controlled by other promoters, which would be very useful for the modularity of our system. That is why we started working on our own constructions of meganuclease first. However, we asked TUDelft to send us two plasmids that they designed, so that we can test and characterize them:
- First plasmid: High copy plasmid with encoded generator to express I-SceI meganucllease, [http://partsregistry.org/Part:BBa_K175041 BBa_K175041]:
- Backbone: pSB1C3
- Resistance: Chloramphenicol
- Origin of Replication: modified pMB1 derived from pUC19
- Second plasmid: High copy plasmid with encoded I-SceI restriction site, [http://partsregistry.org/Part:BBa_K175027 K175027]:
- Backbone: pSB1AK3
- Resistance: Ampicillin and Kanamycin
- Origin of Replication: modified pMB1 derived from pUC19
Step 1
To mesure the efficiency of I-SceI from TUDelft parts, we proceeded in the same way as for the characterization of our own designs: we transformed two plasmids with different antibiotic resistances into NEB Turbo E.Coli strain.
The transformation was successful.
Step 2
We followed the following protocol:
- Pick a colony and start a liquid culture with both antibiotic resistances (Amp and Cm).
- Incubate at 37°C until optical density (OD) reaches 0.5
- Pellet and wash cells to remove Amp and Cm.
- Re-dilute them in the same volume of LB.
- From each of those two tubes, start two liquid cultures:
- The first culture with Cm and w/o IPTG.
- The second culture with Cm and IPTG.
- Incubate overnight at 37°C
Step 3
Plate colonies from each tube on two different plates:
- Selection with Cm and Amp.
- Selection with Cm.
Results
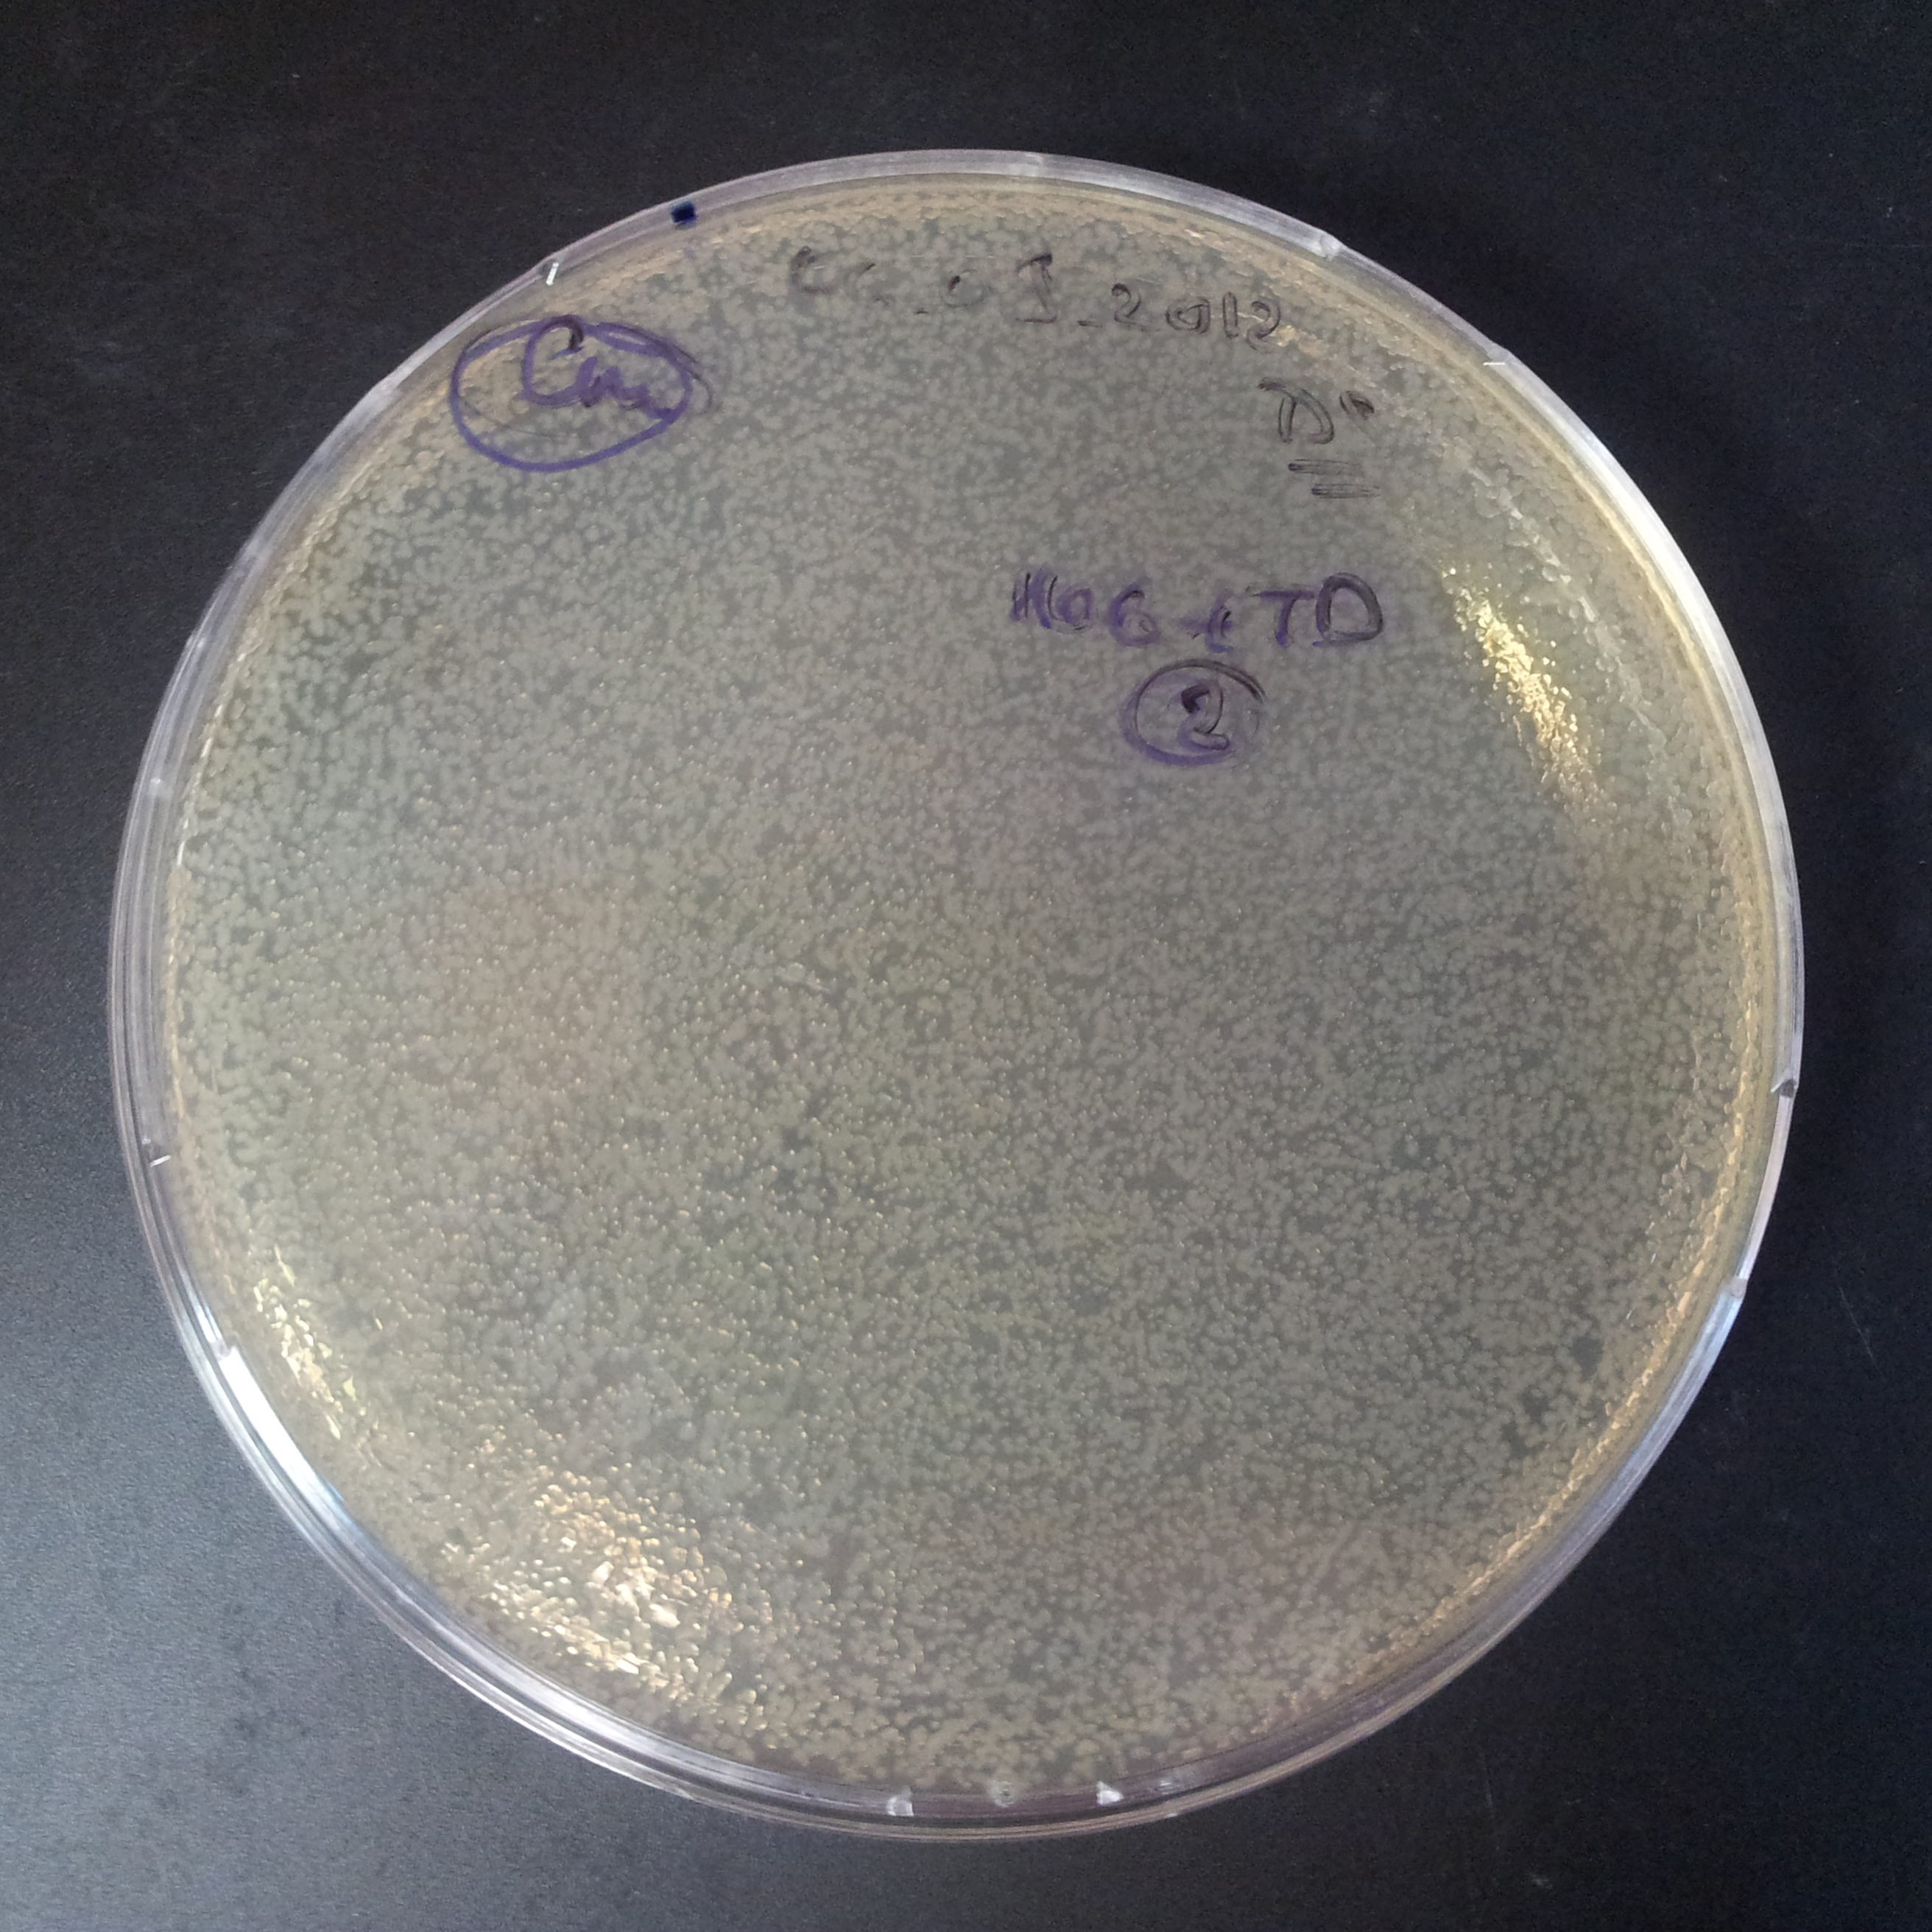
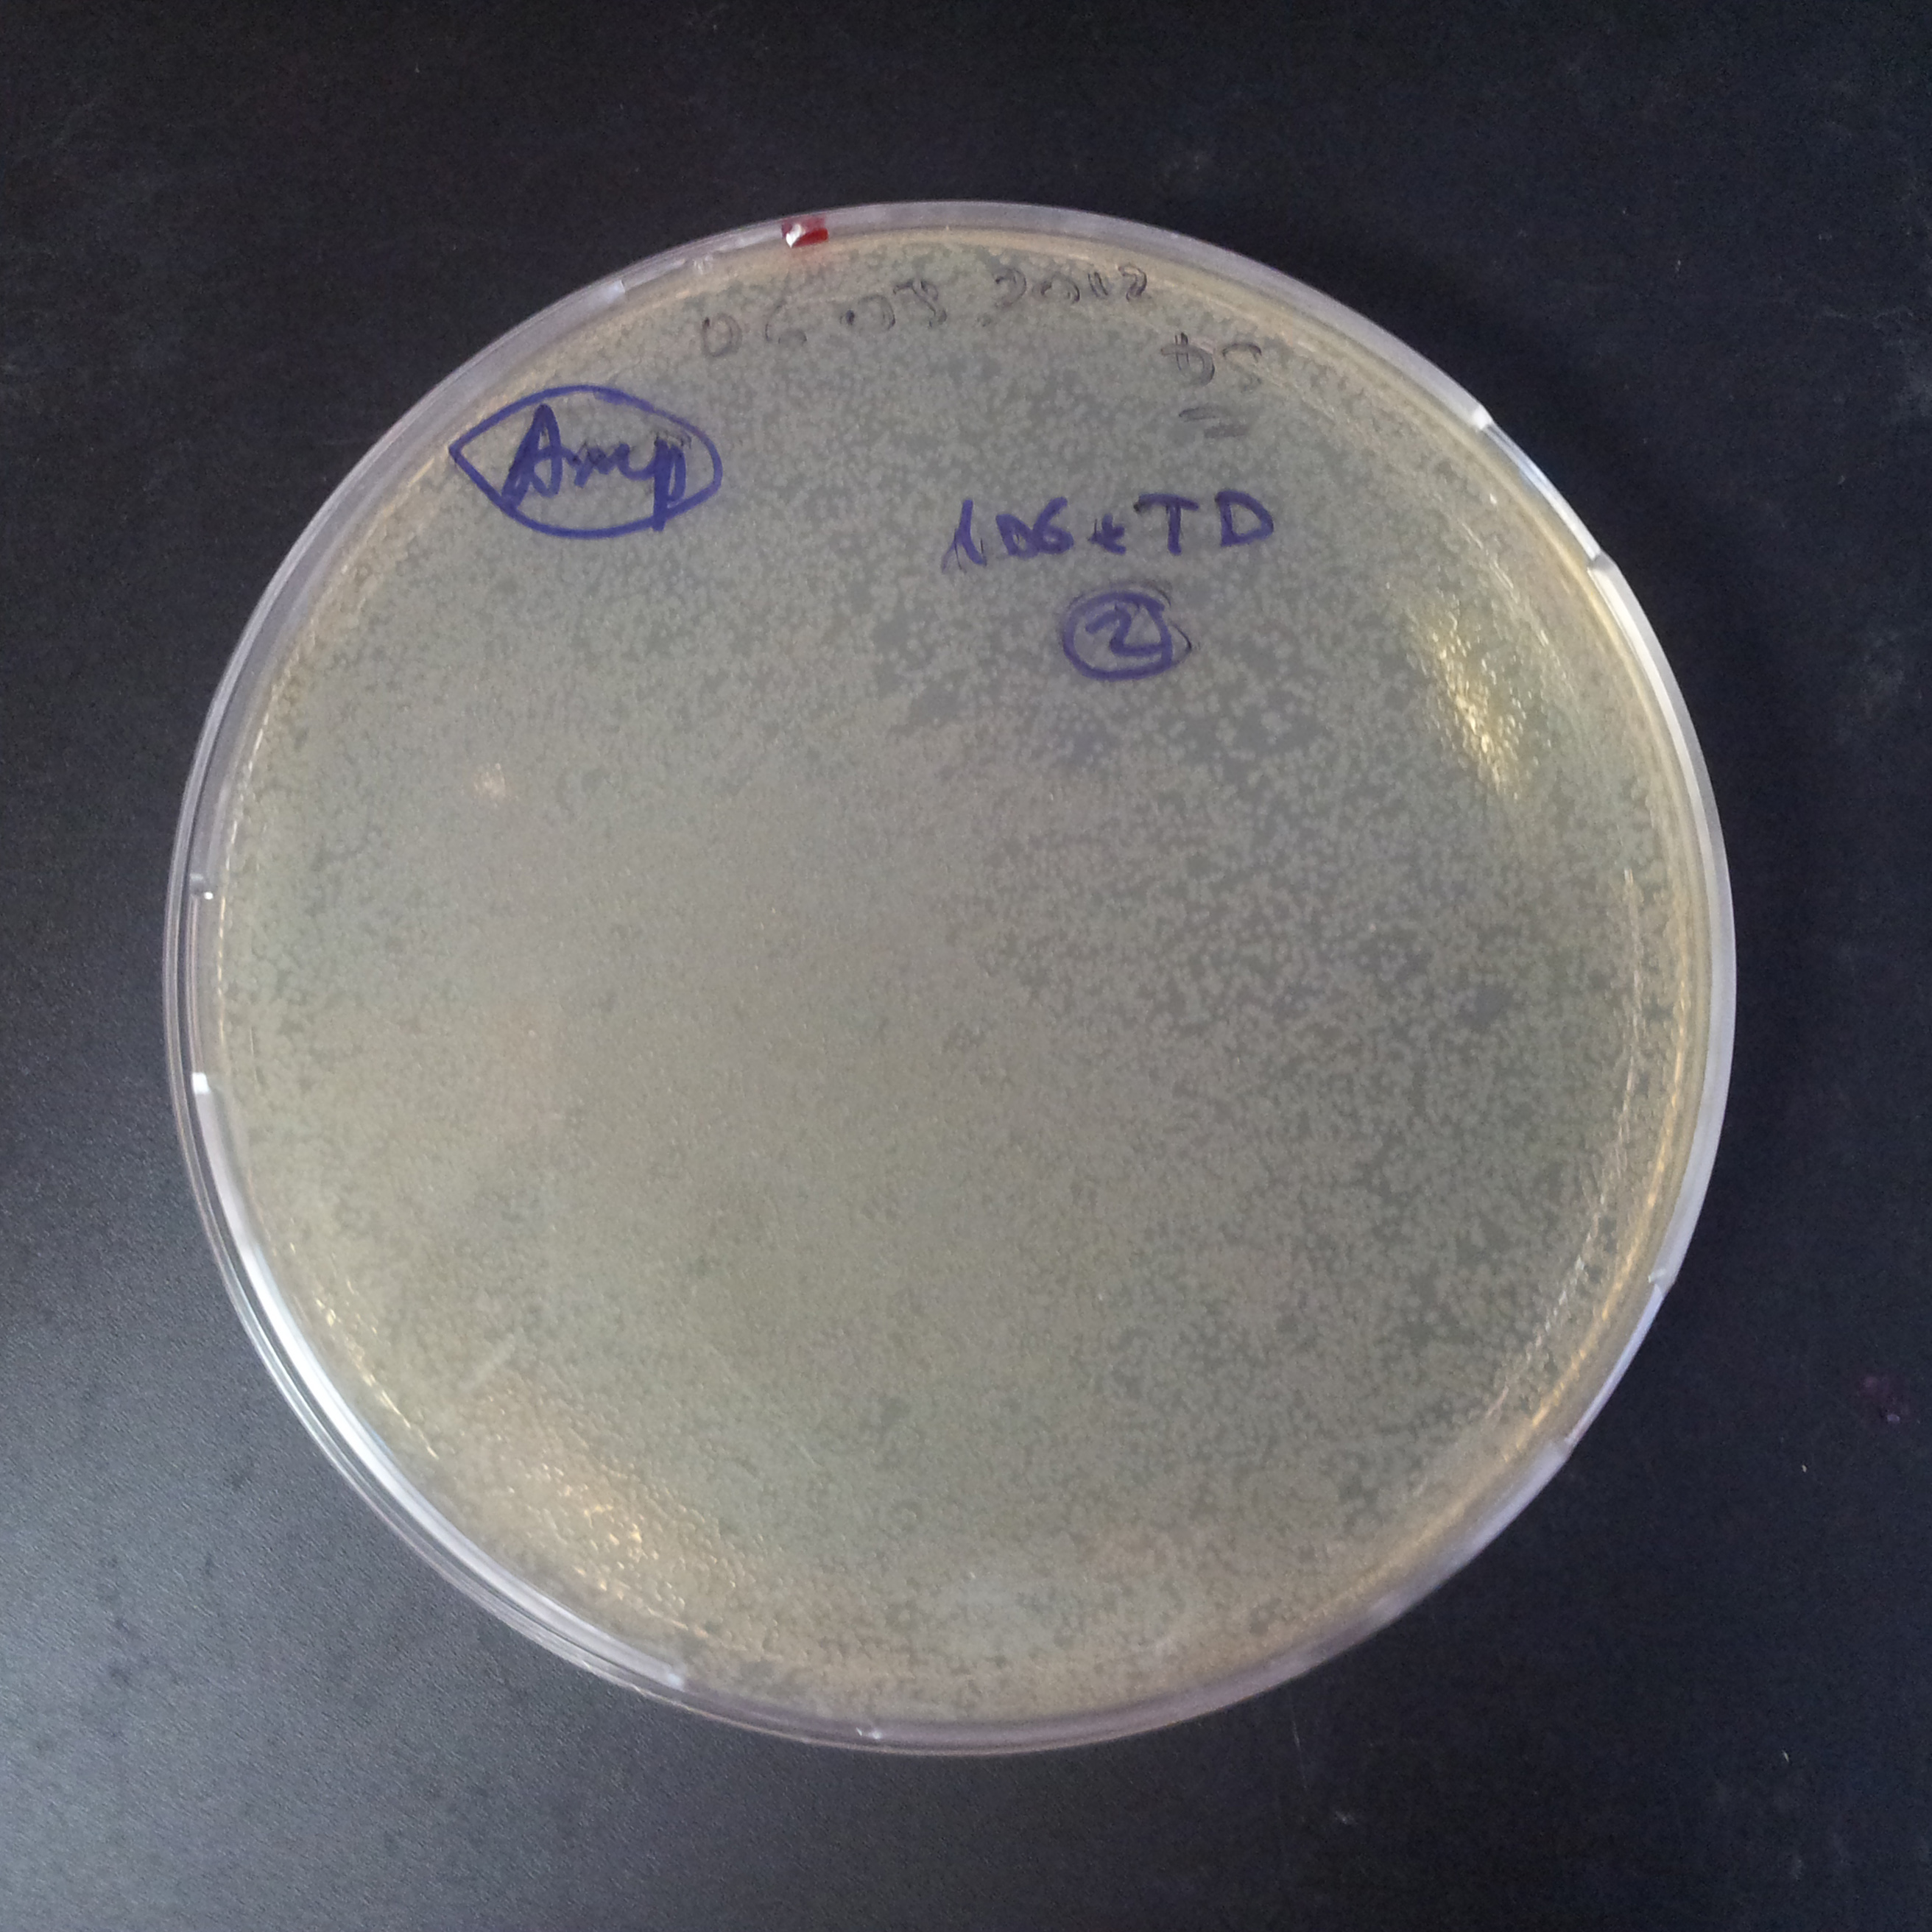
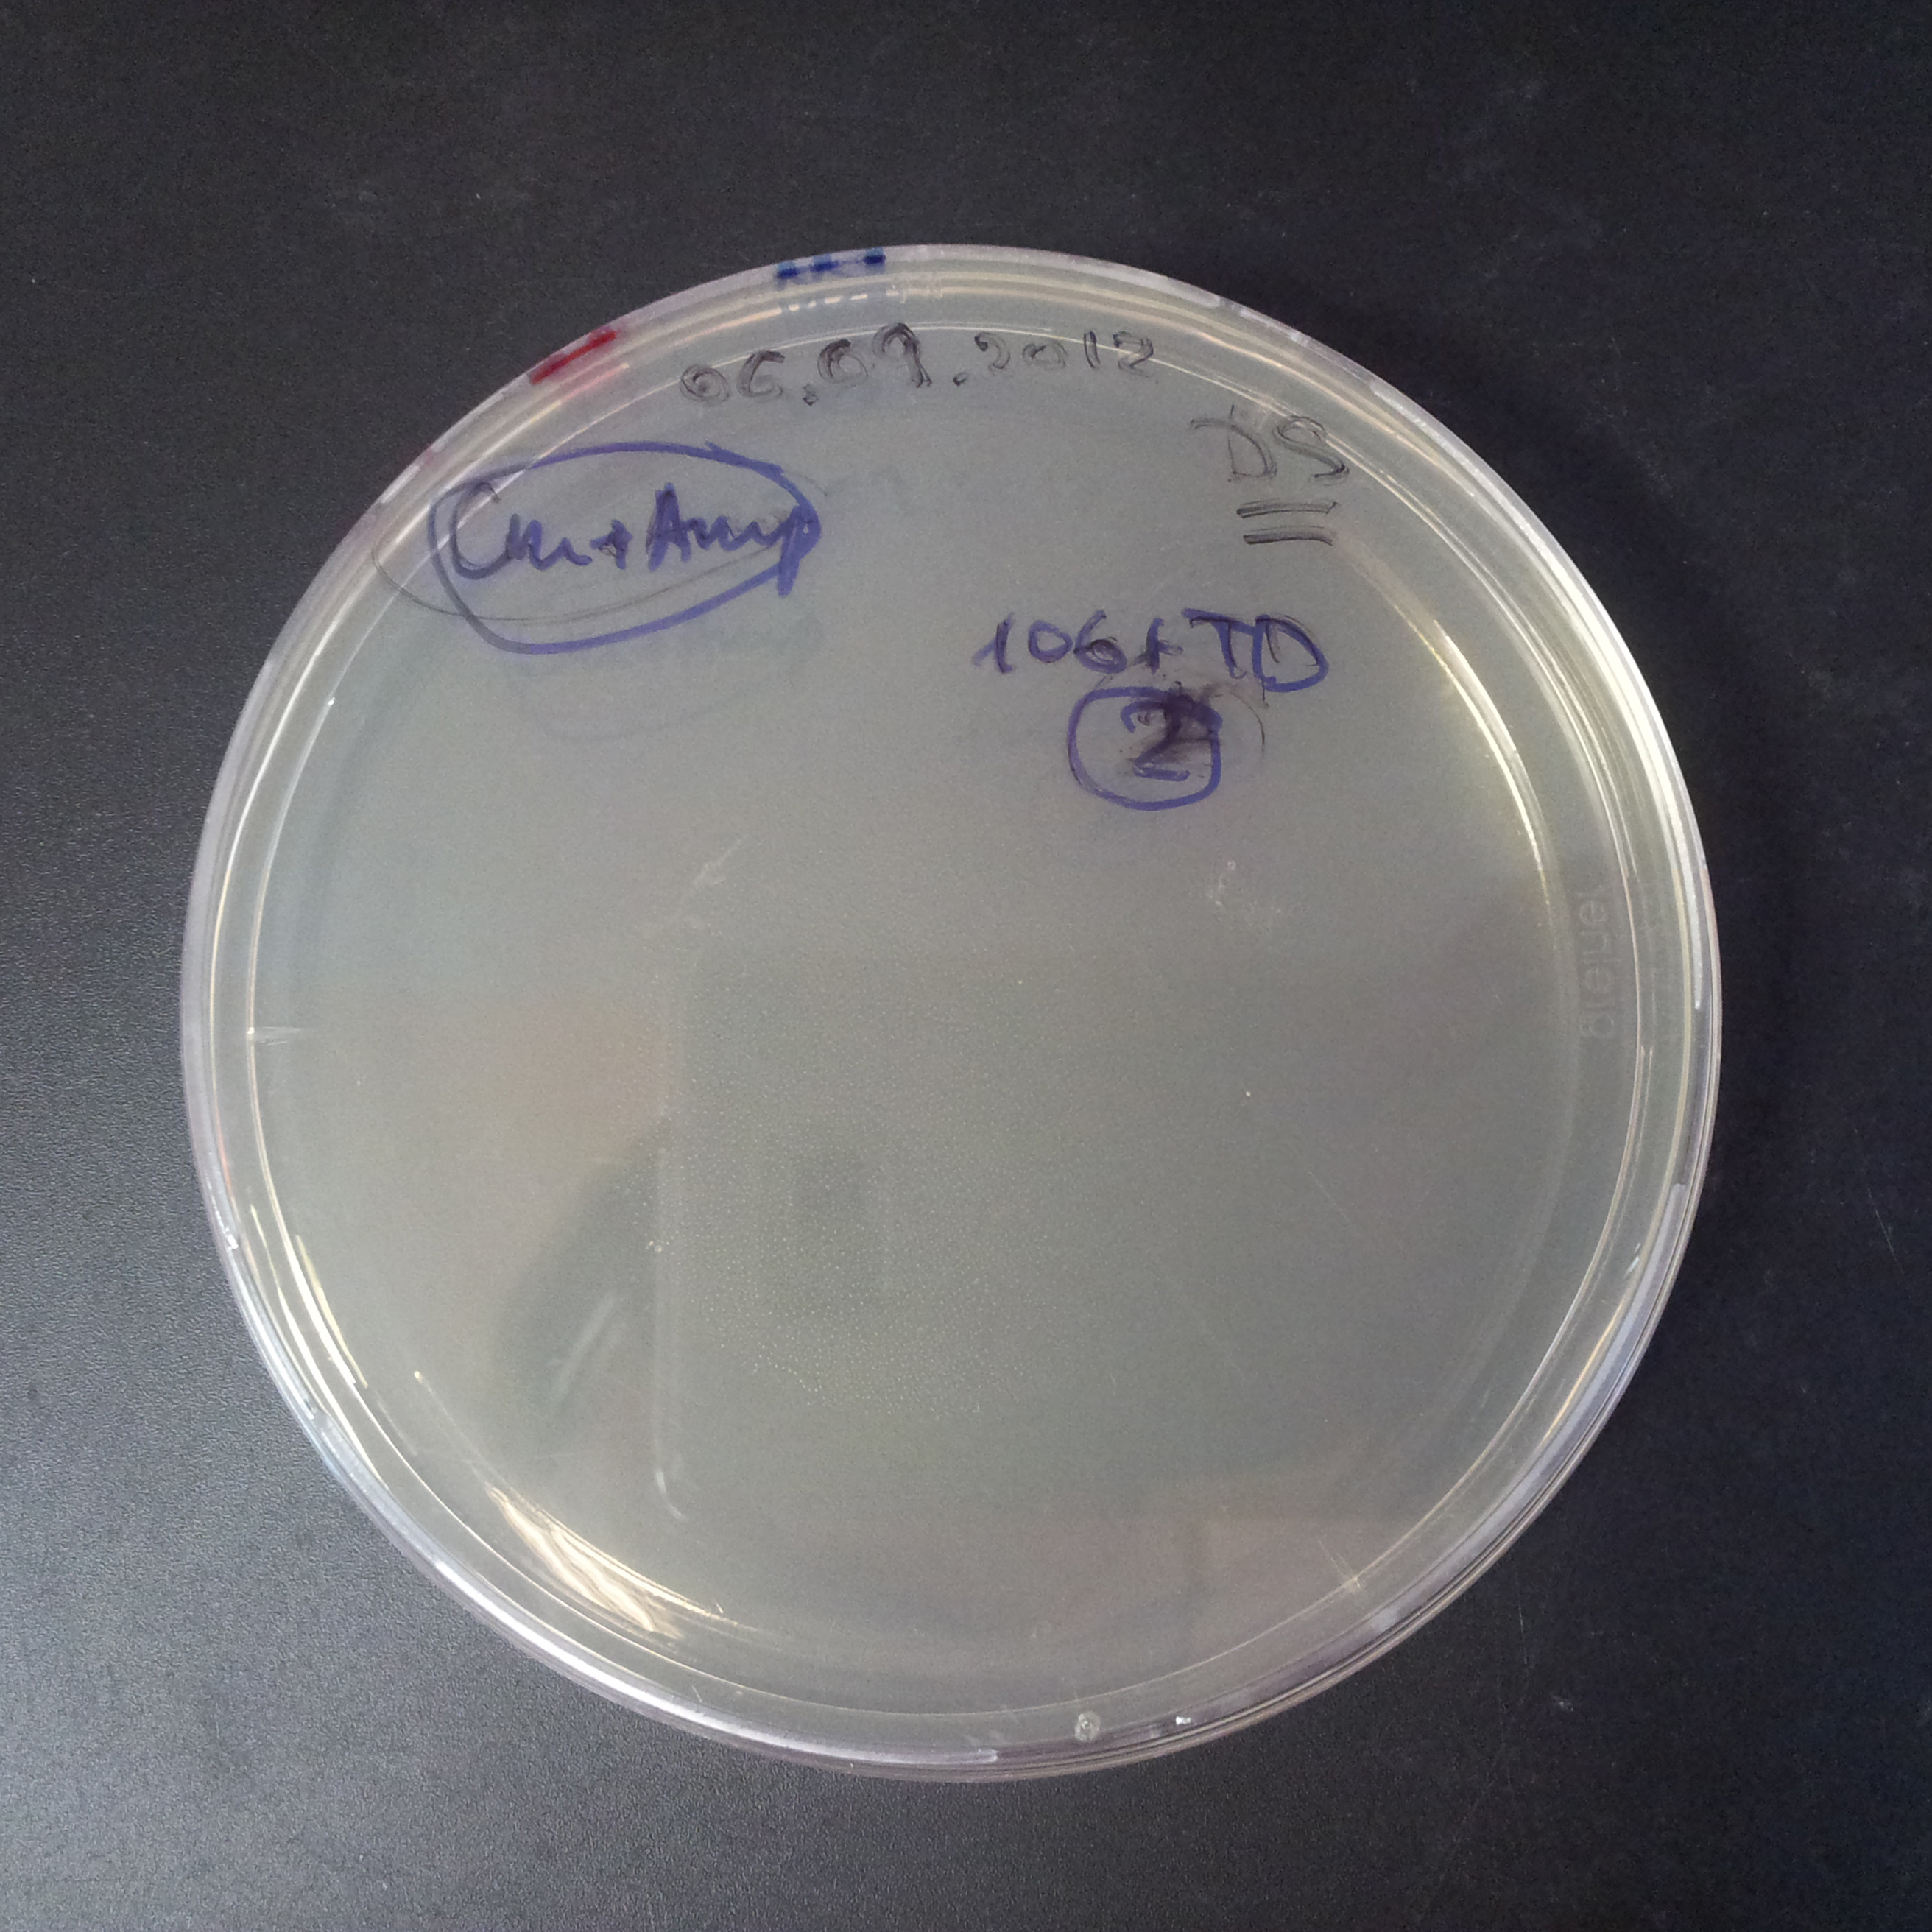
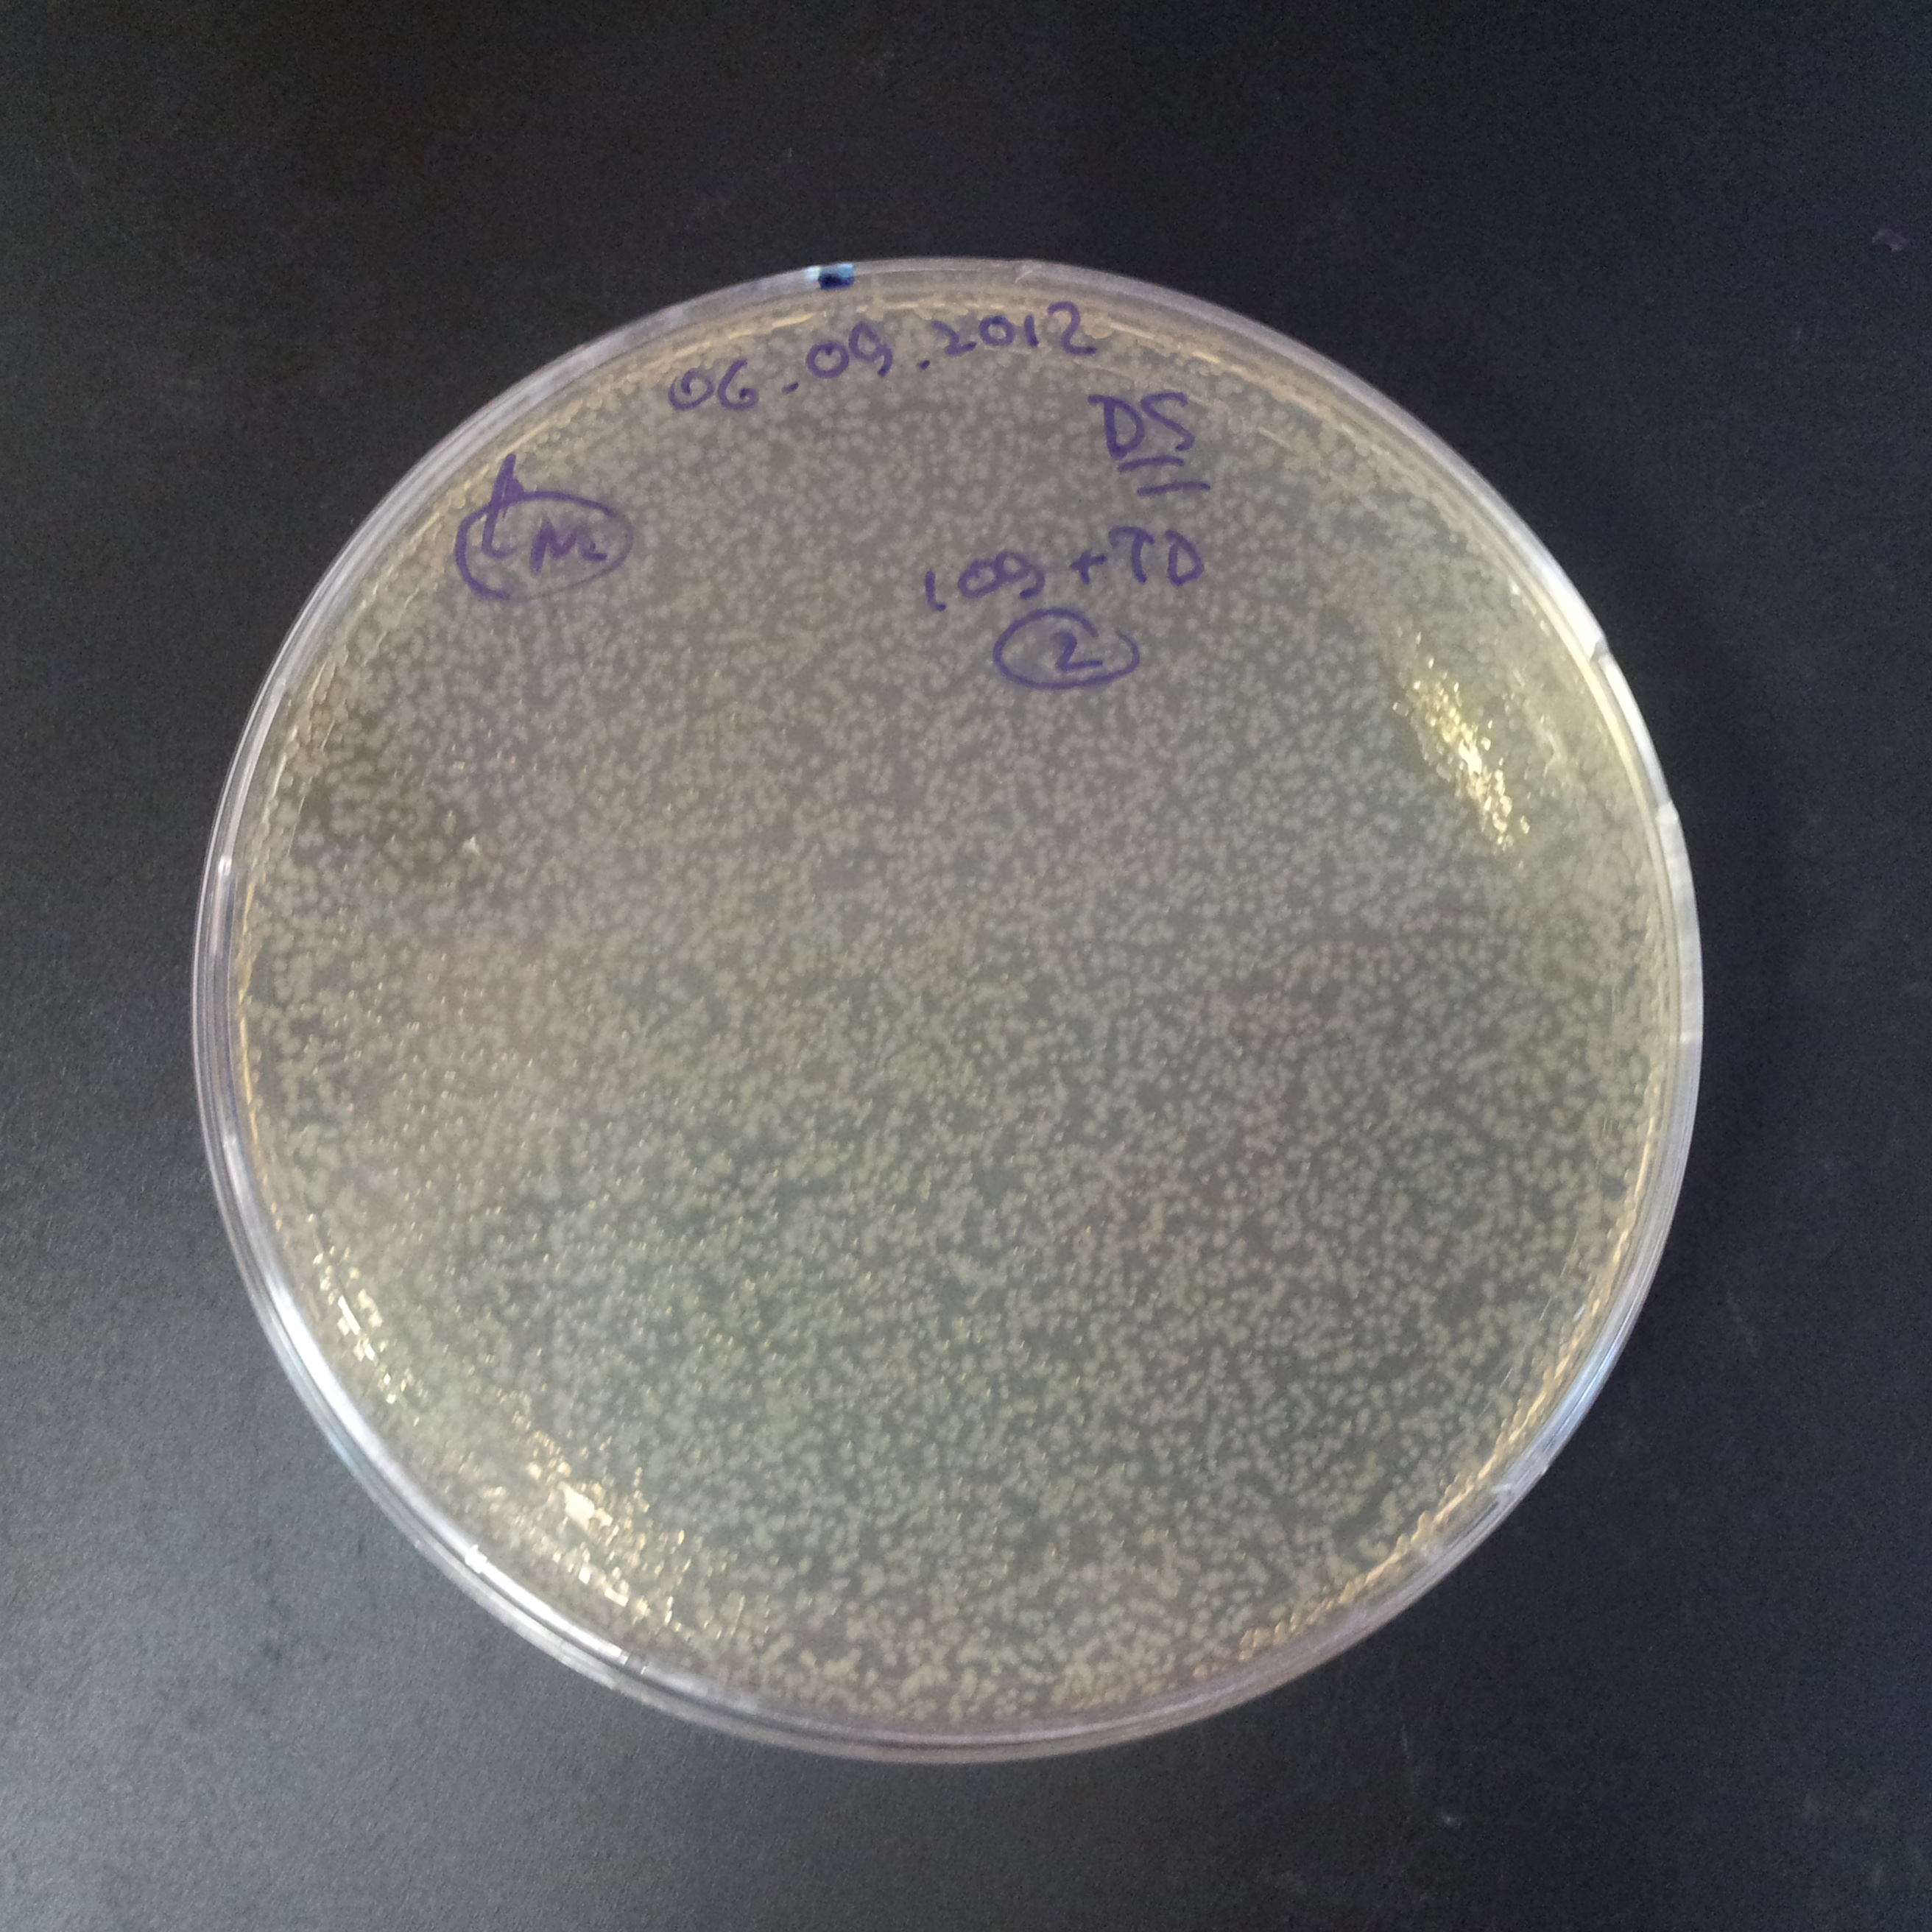
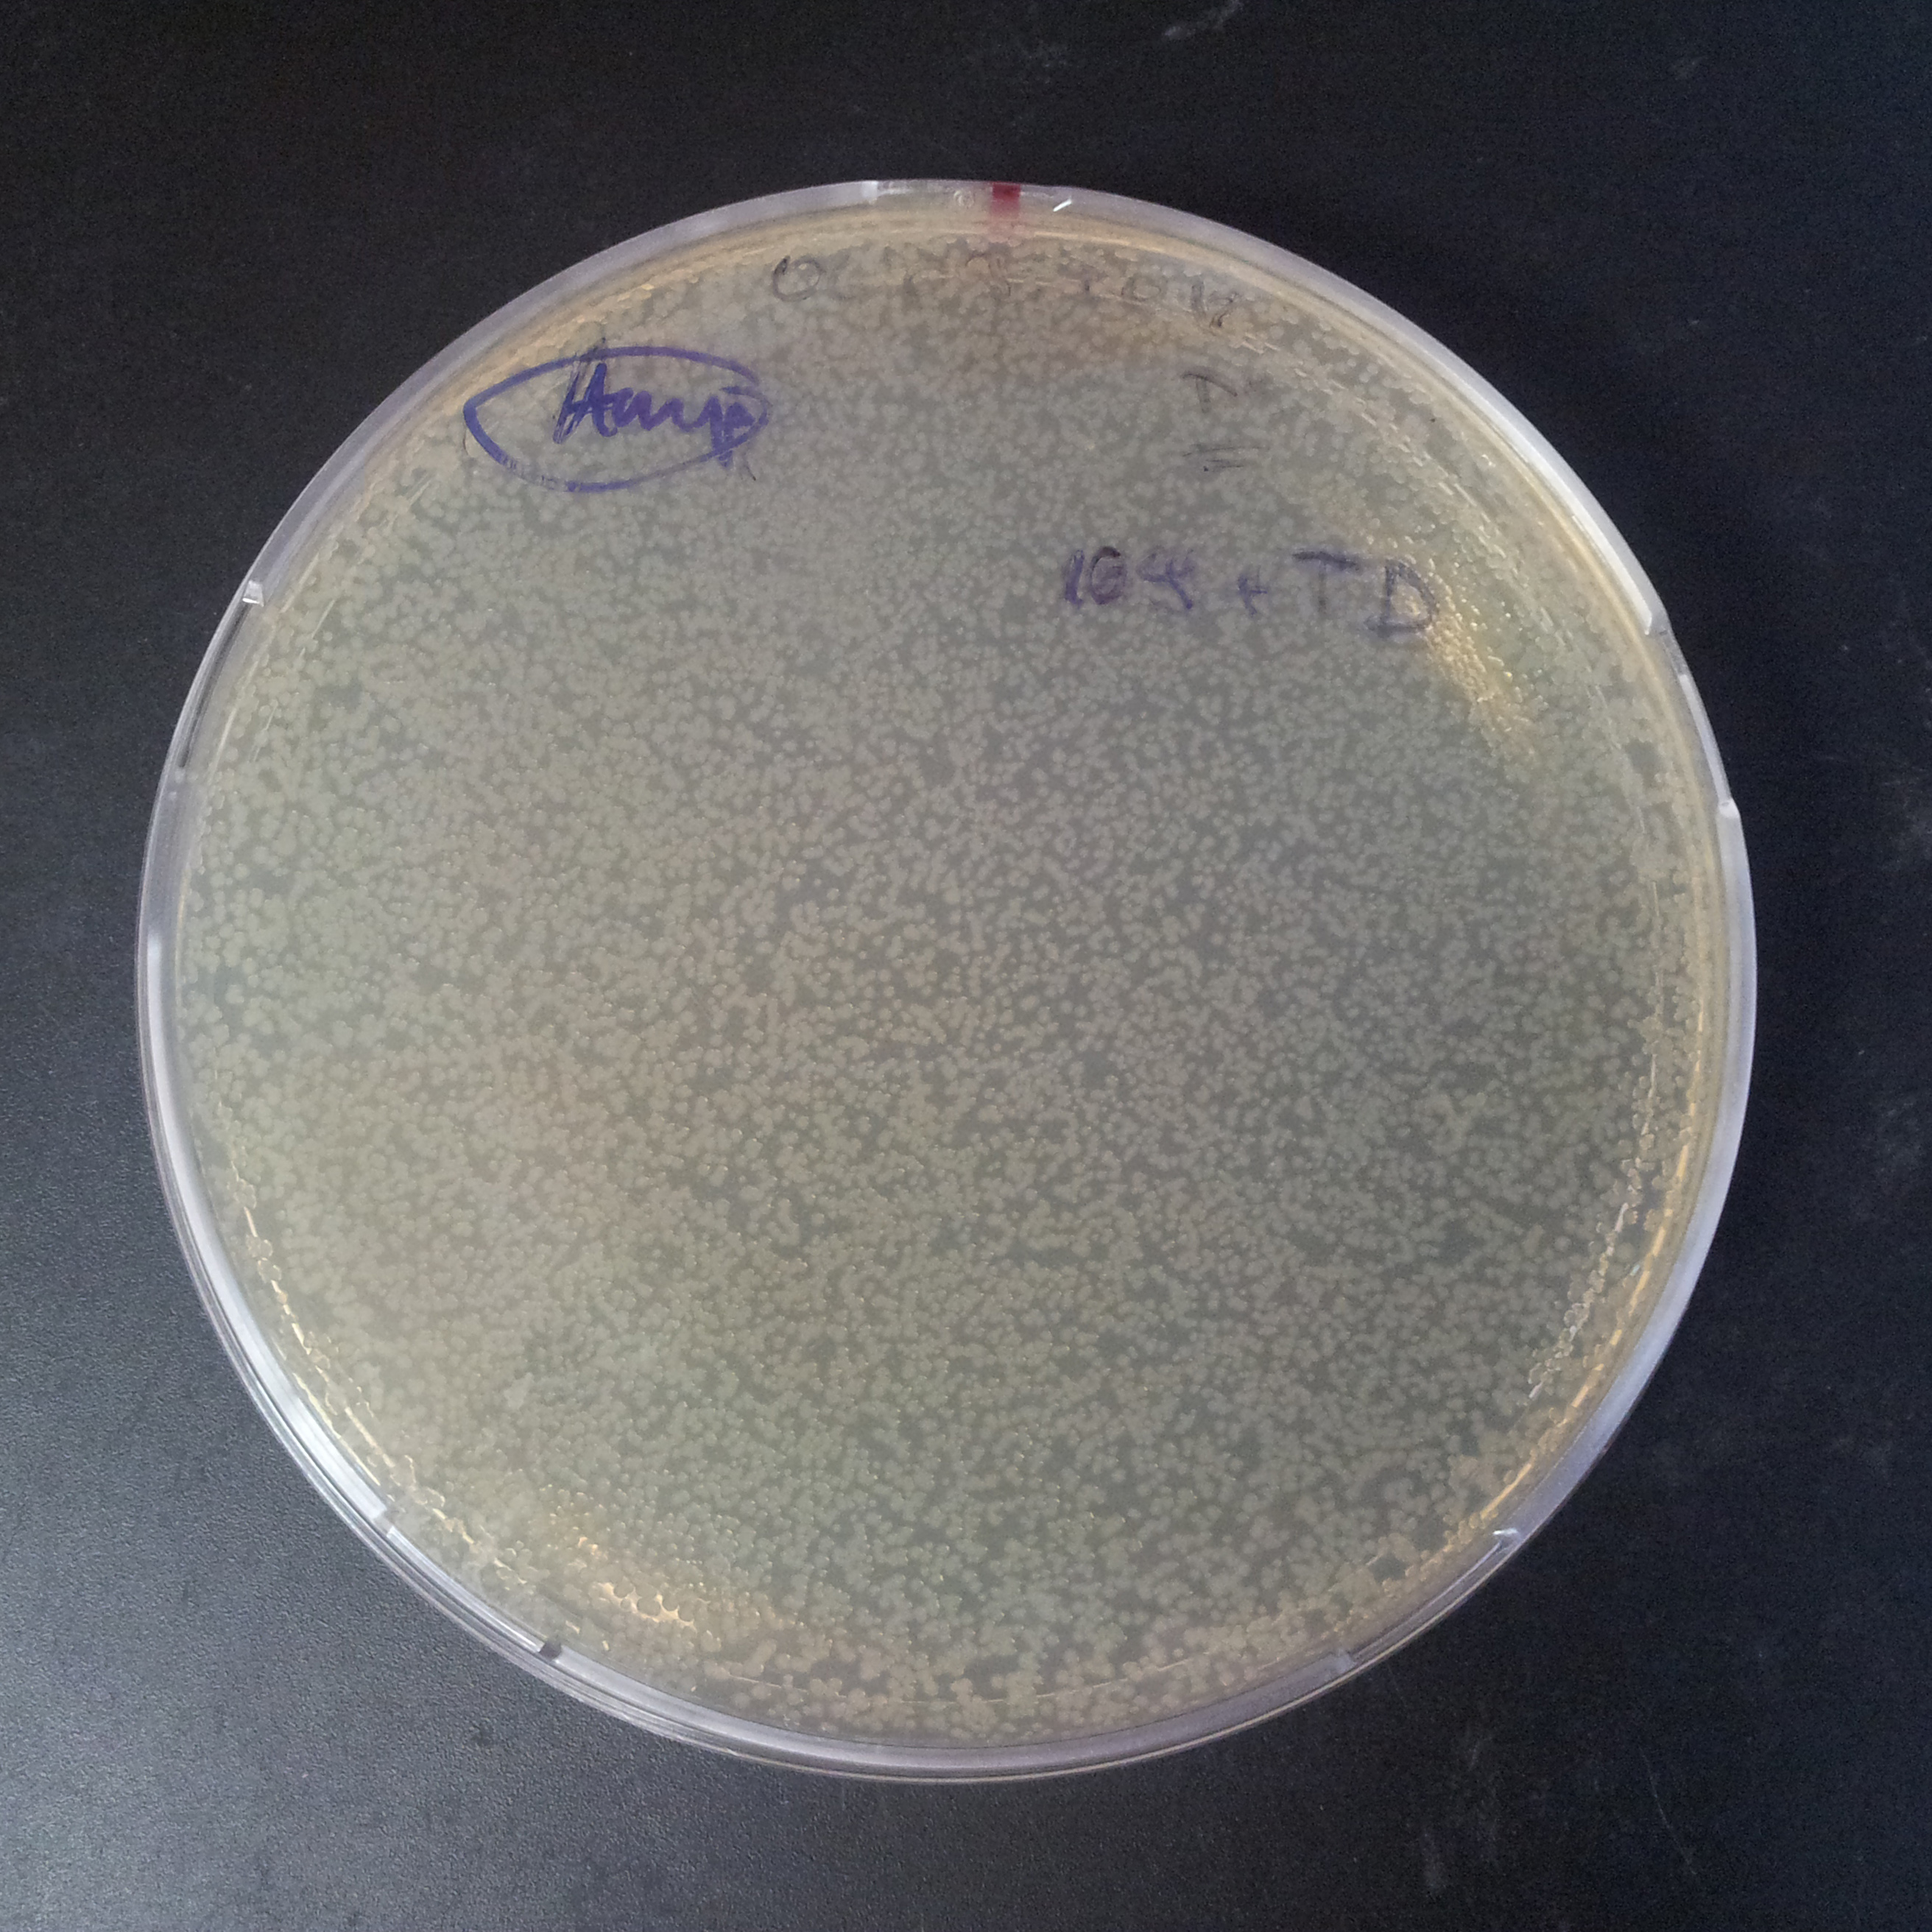
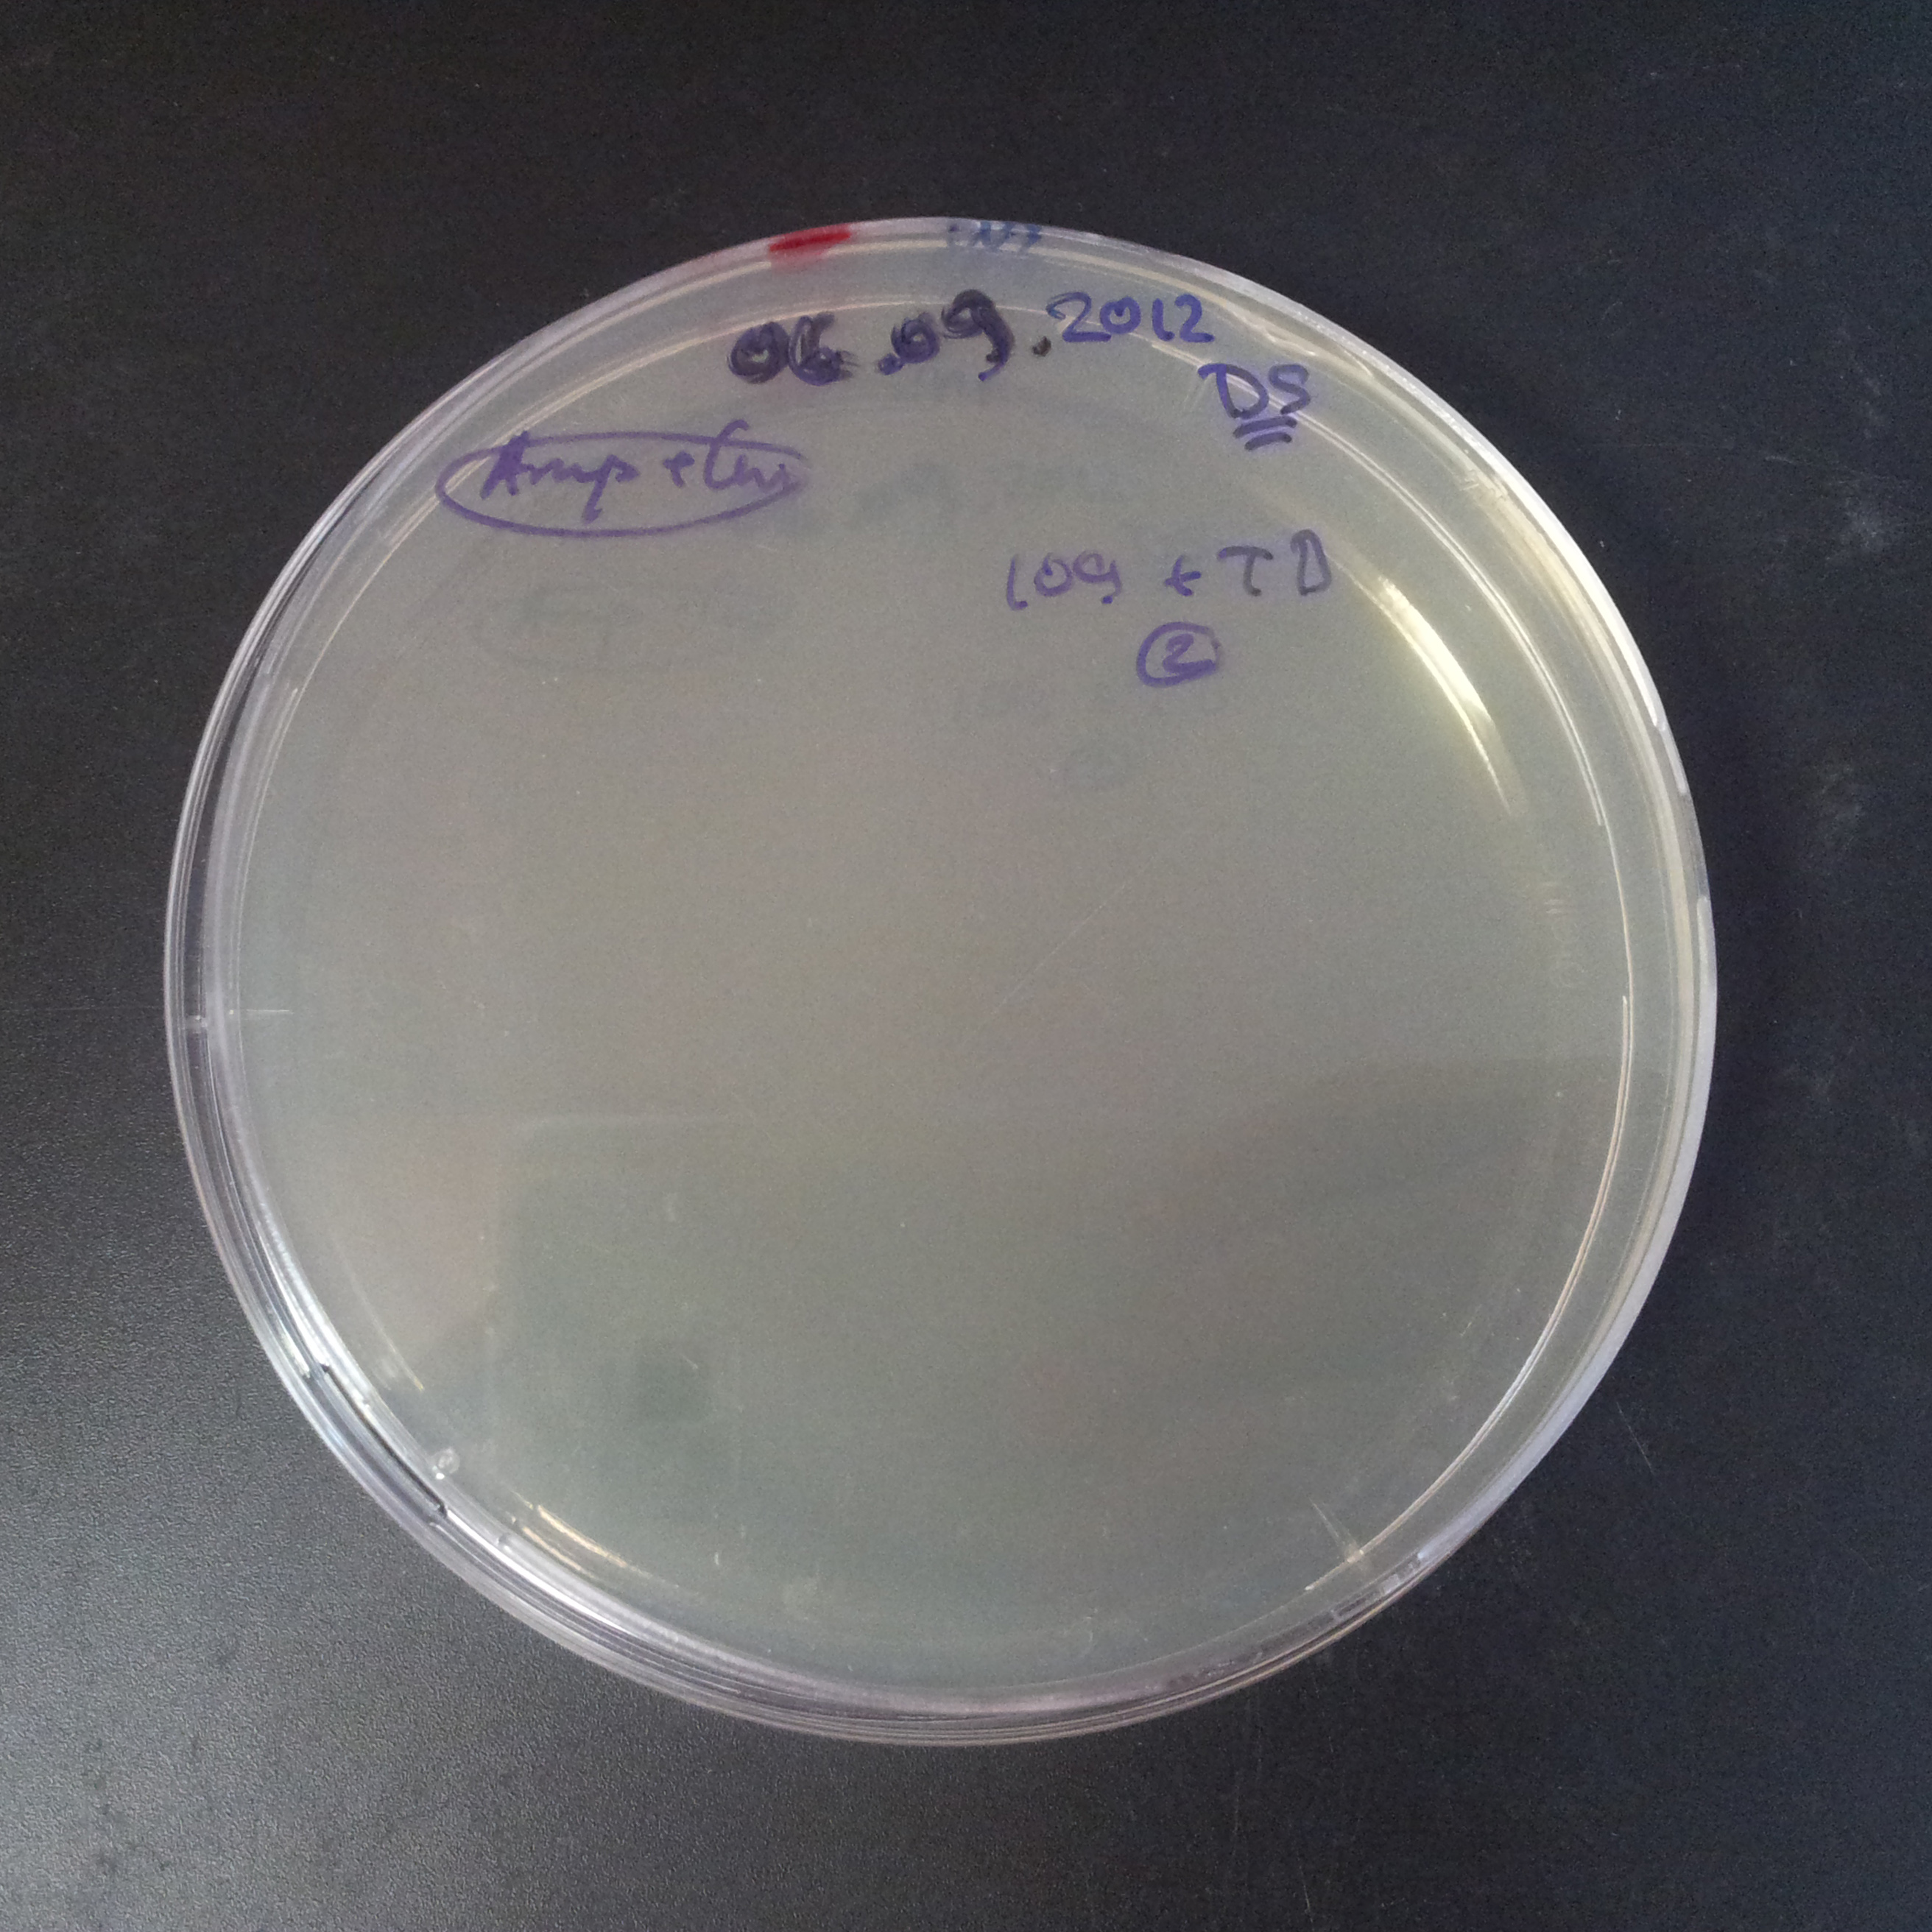
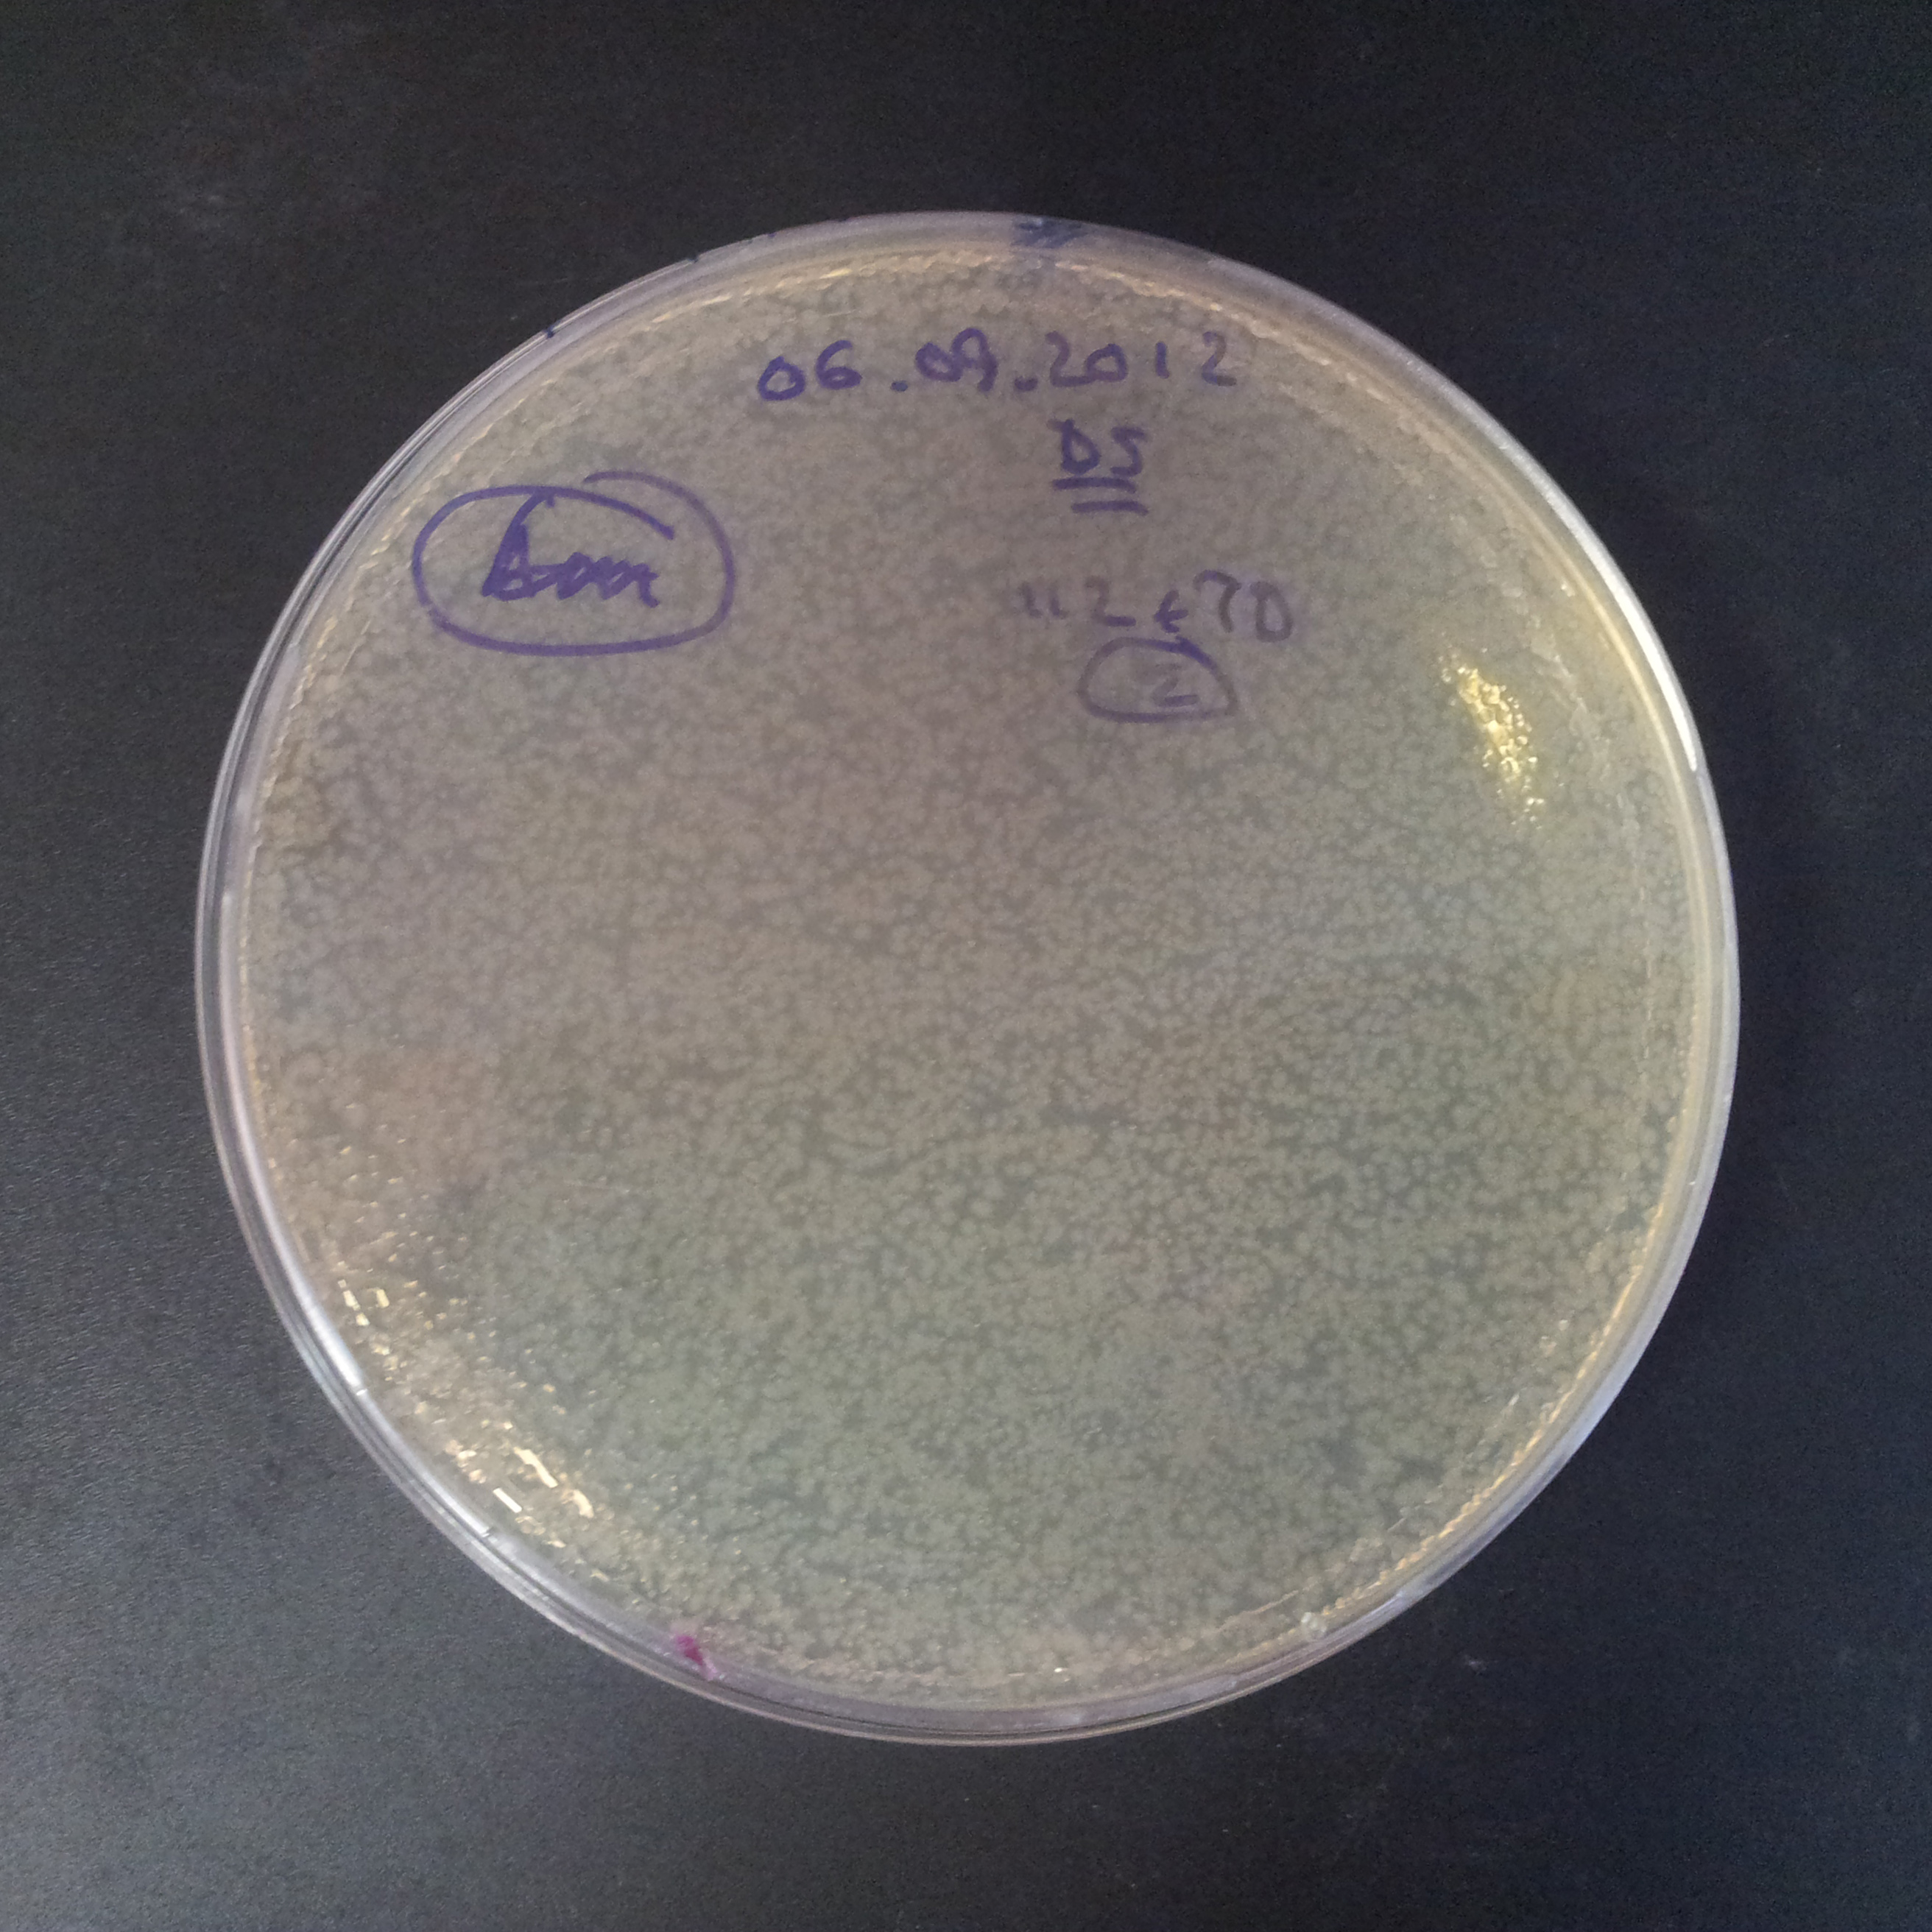
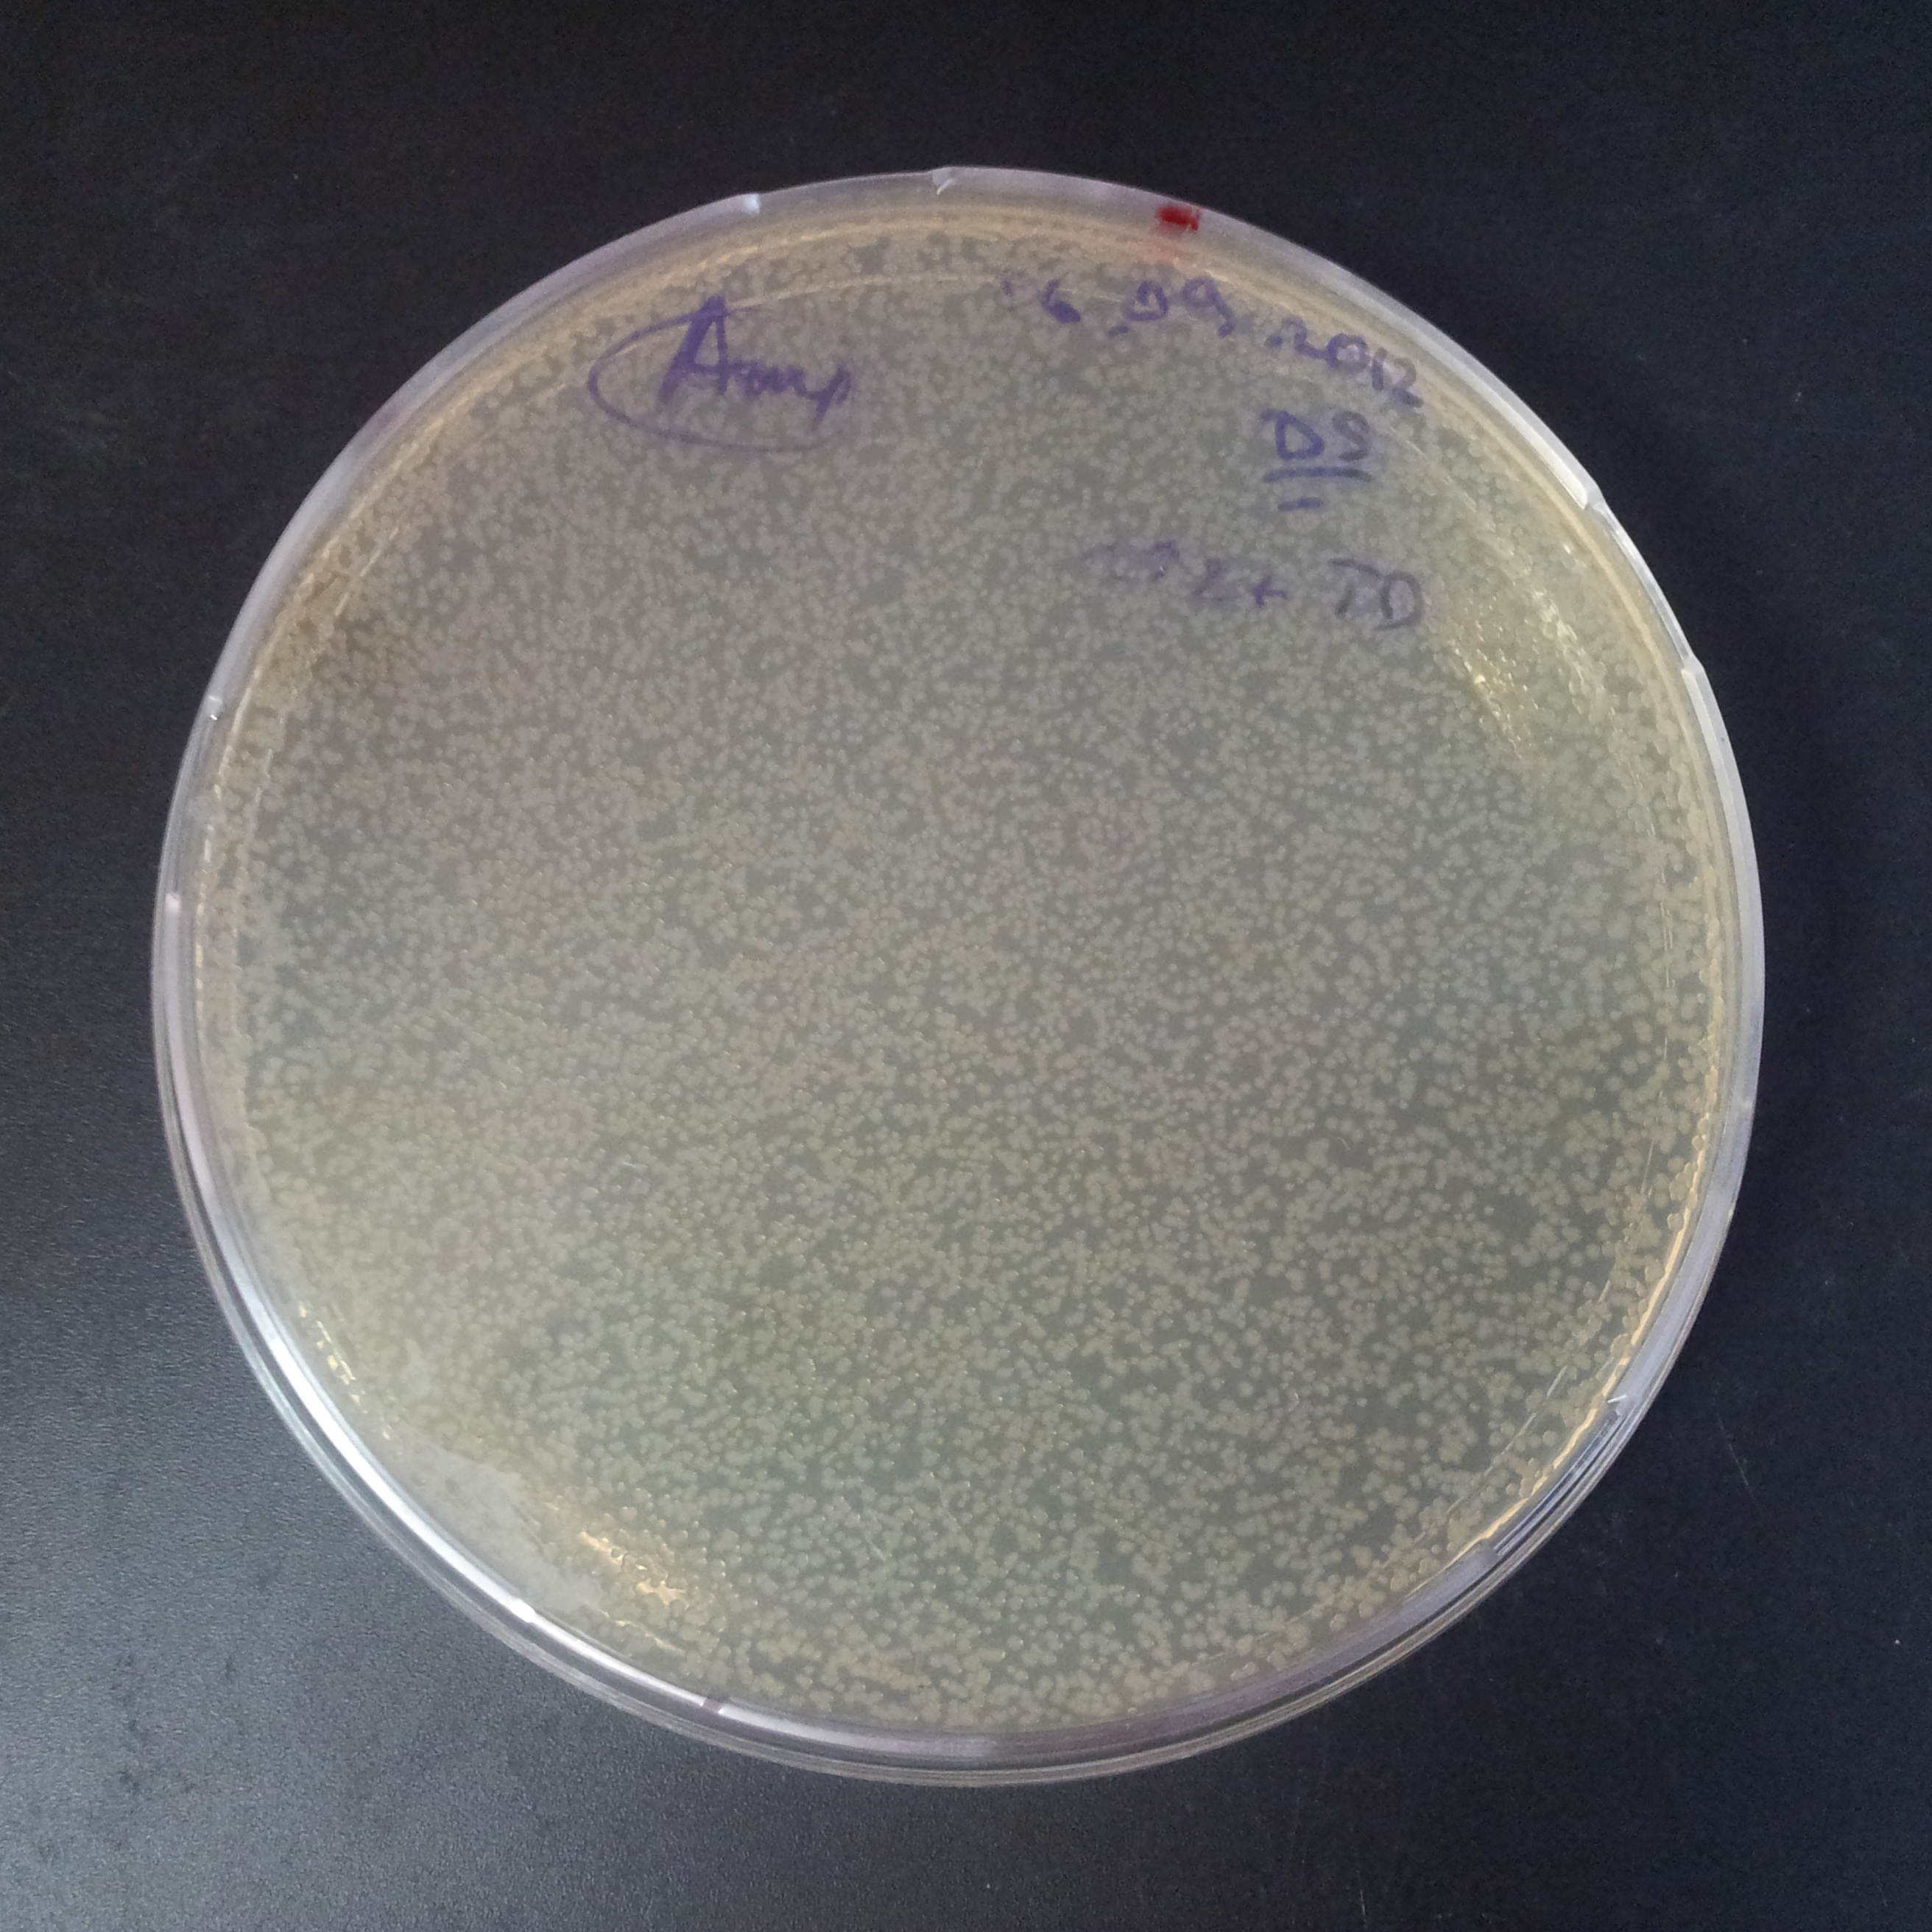
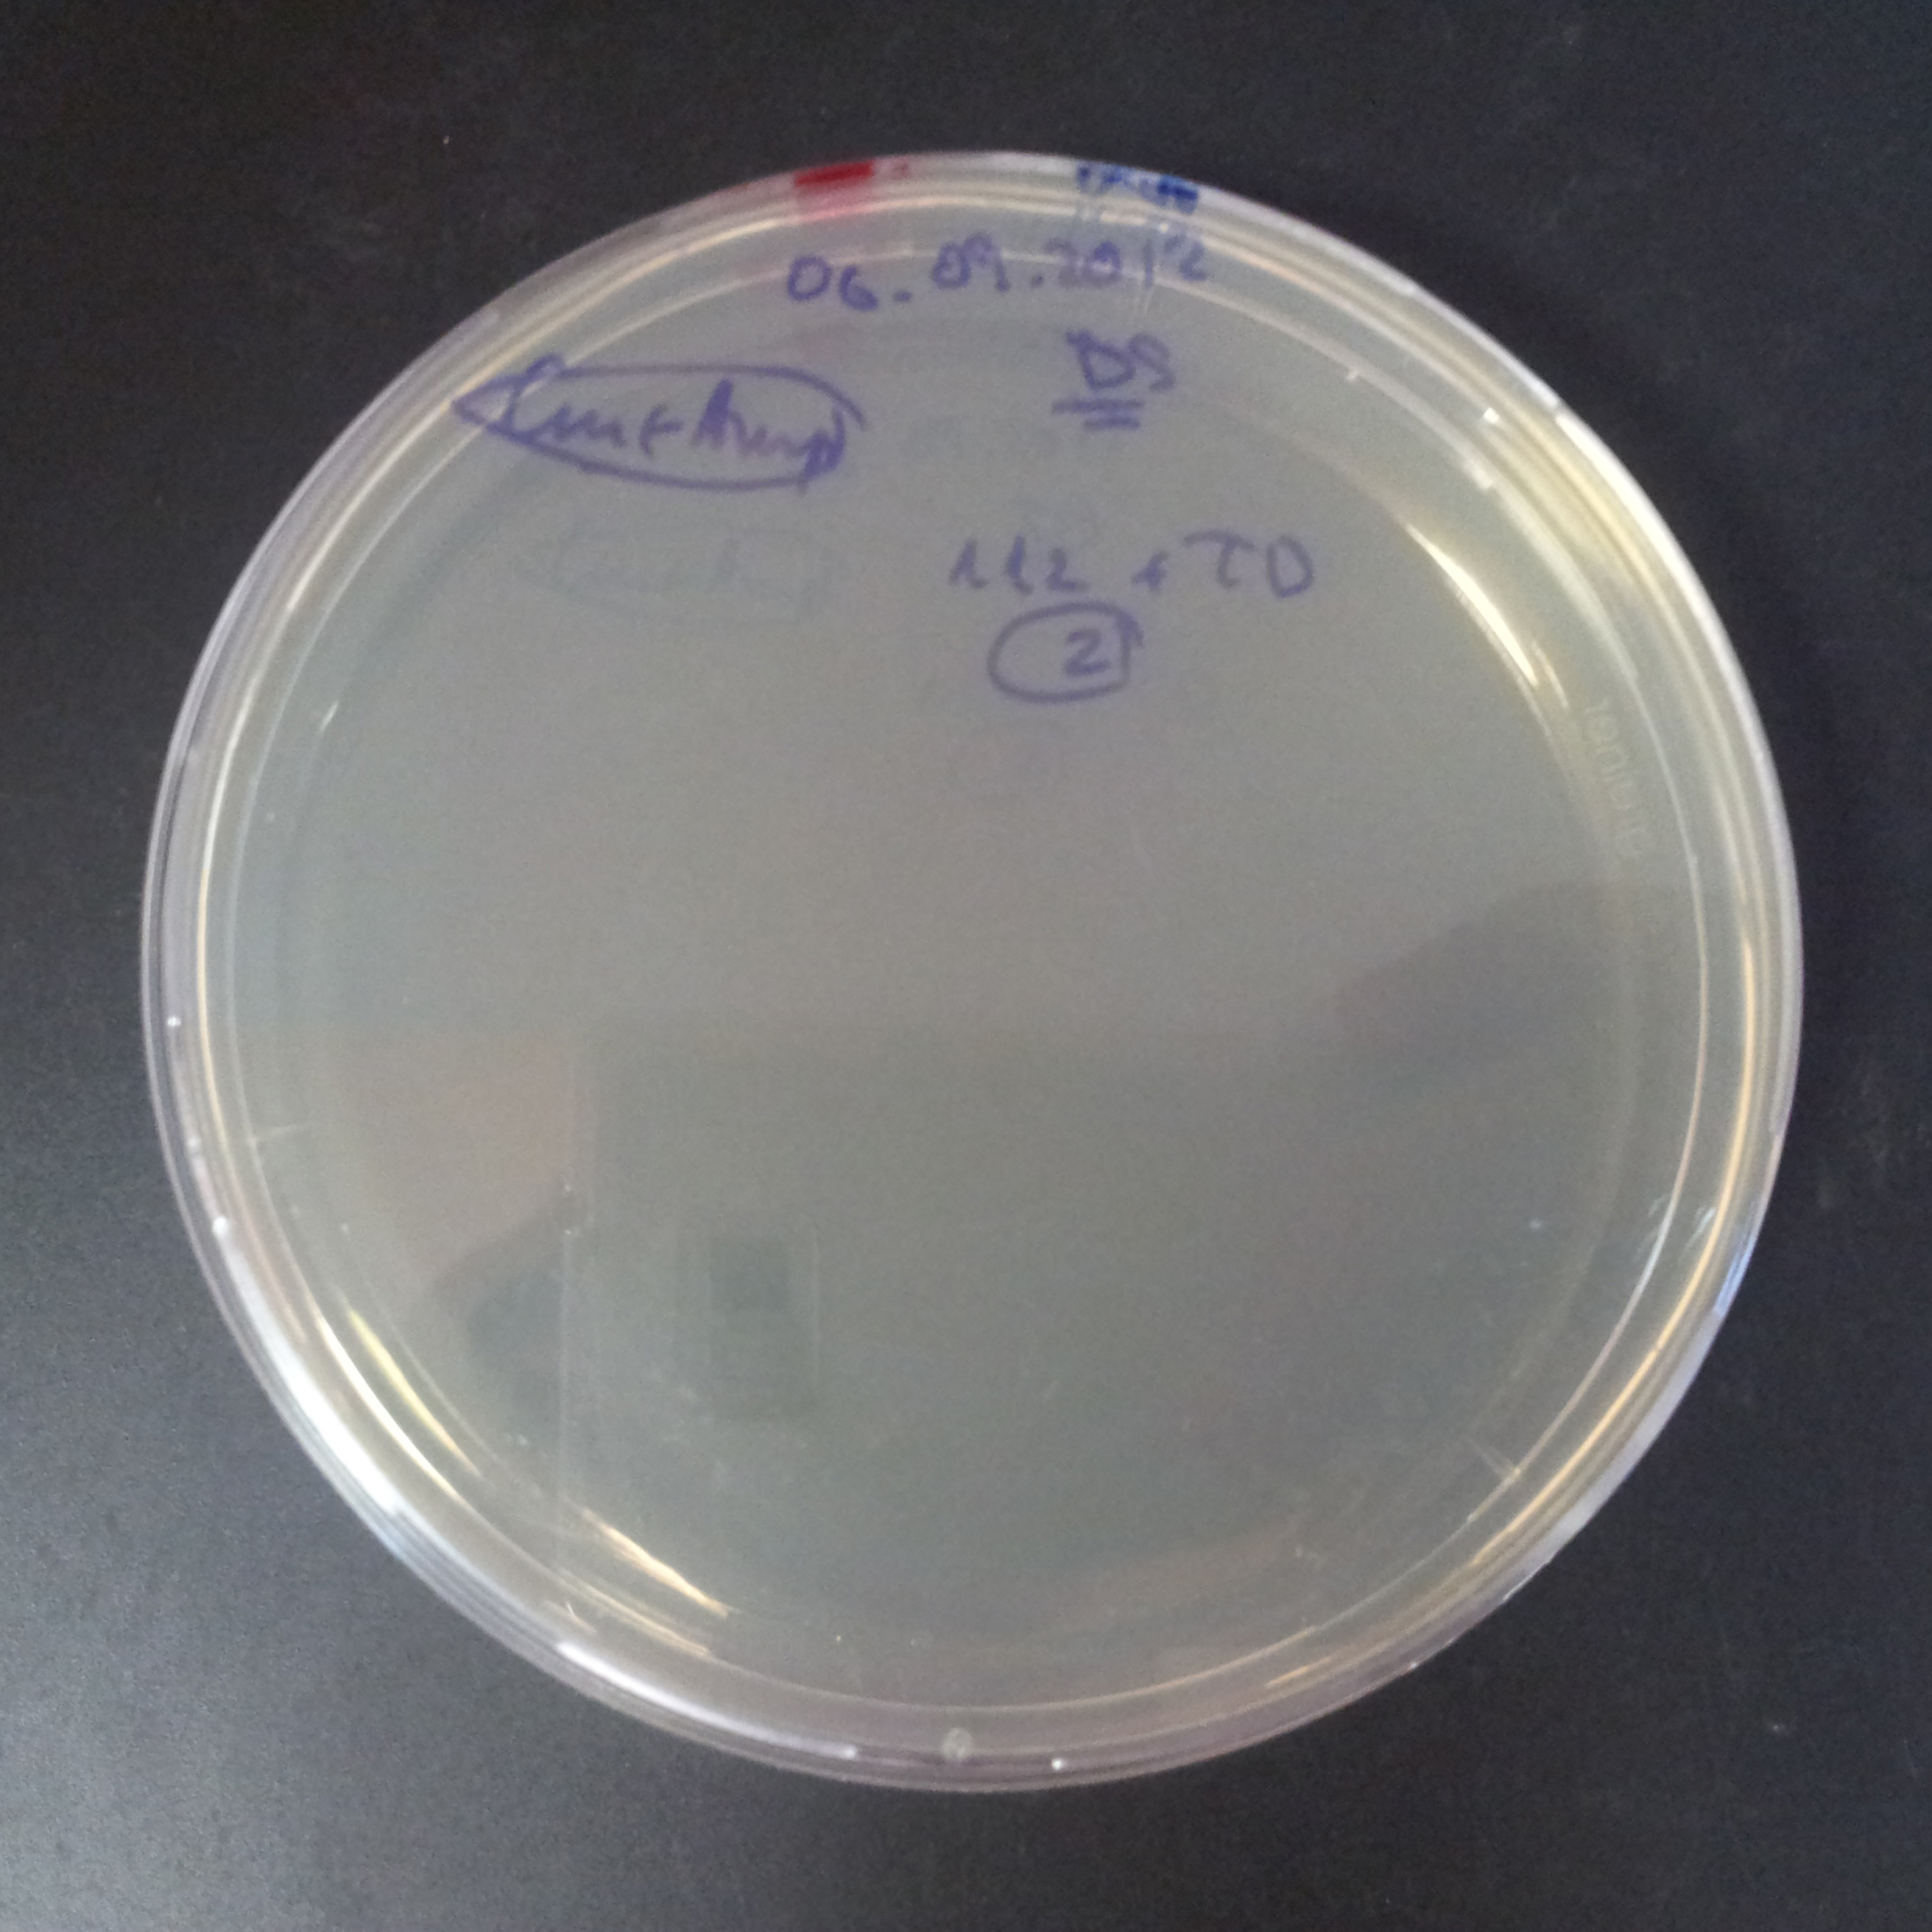
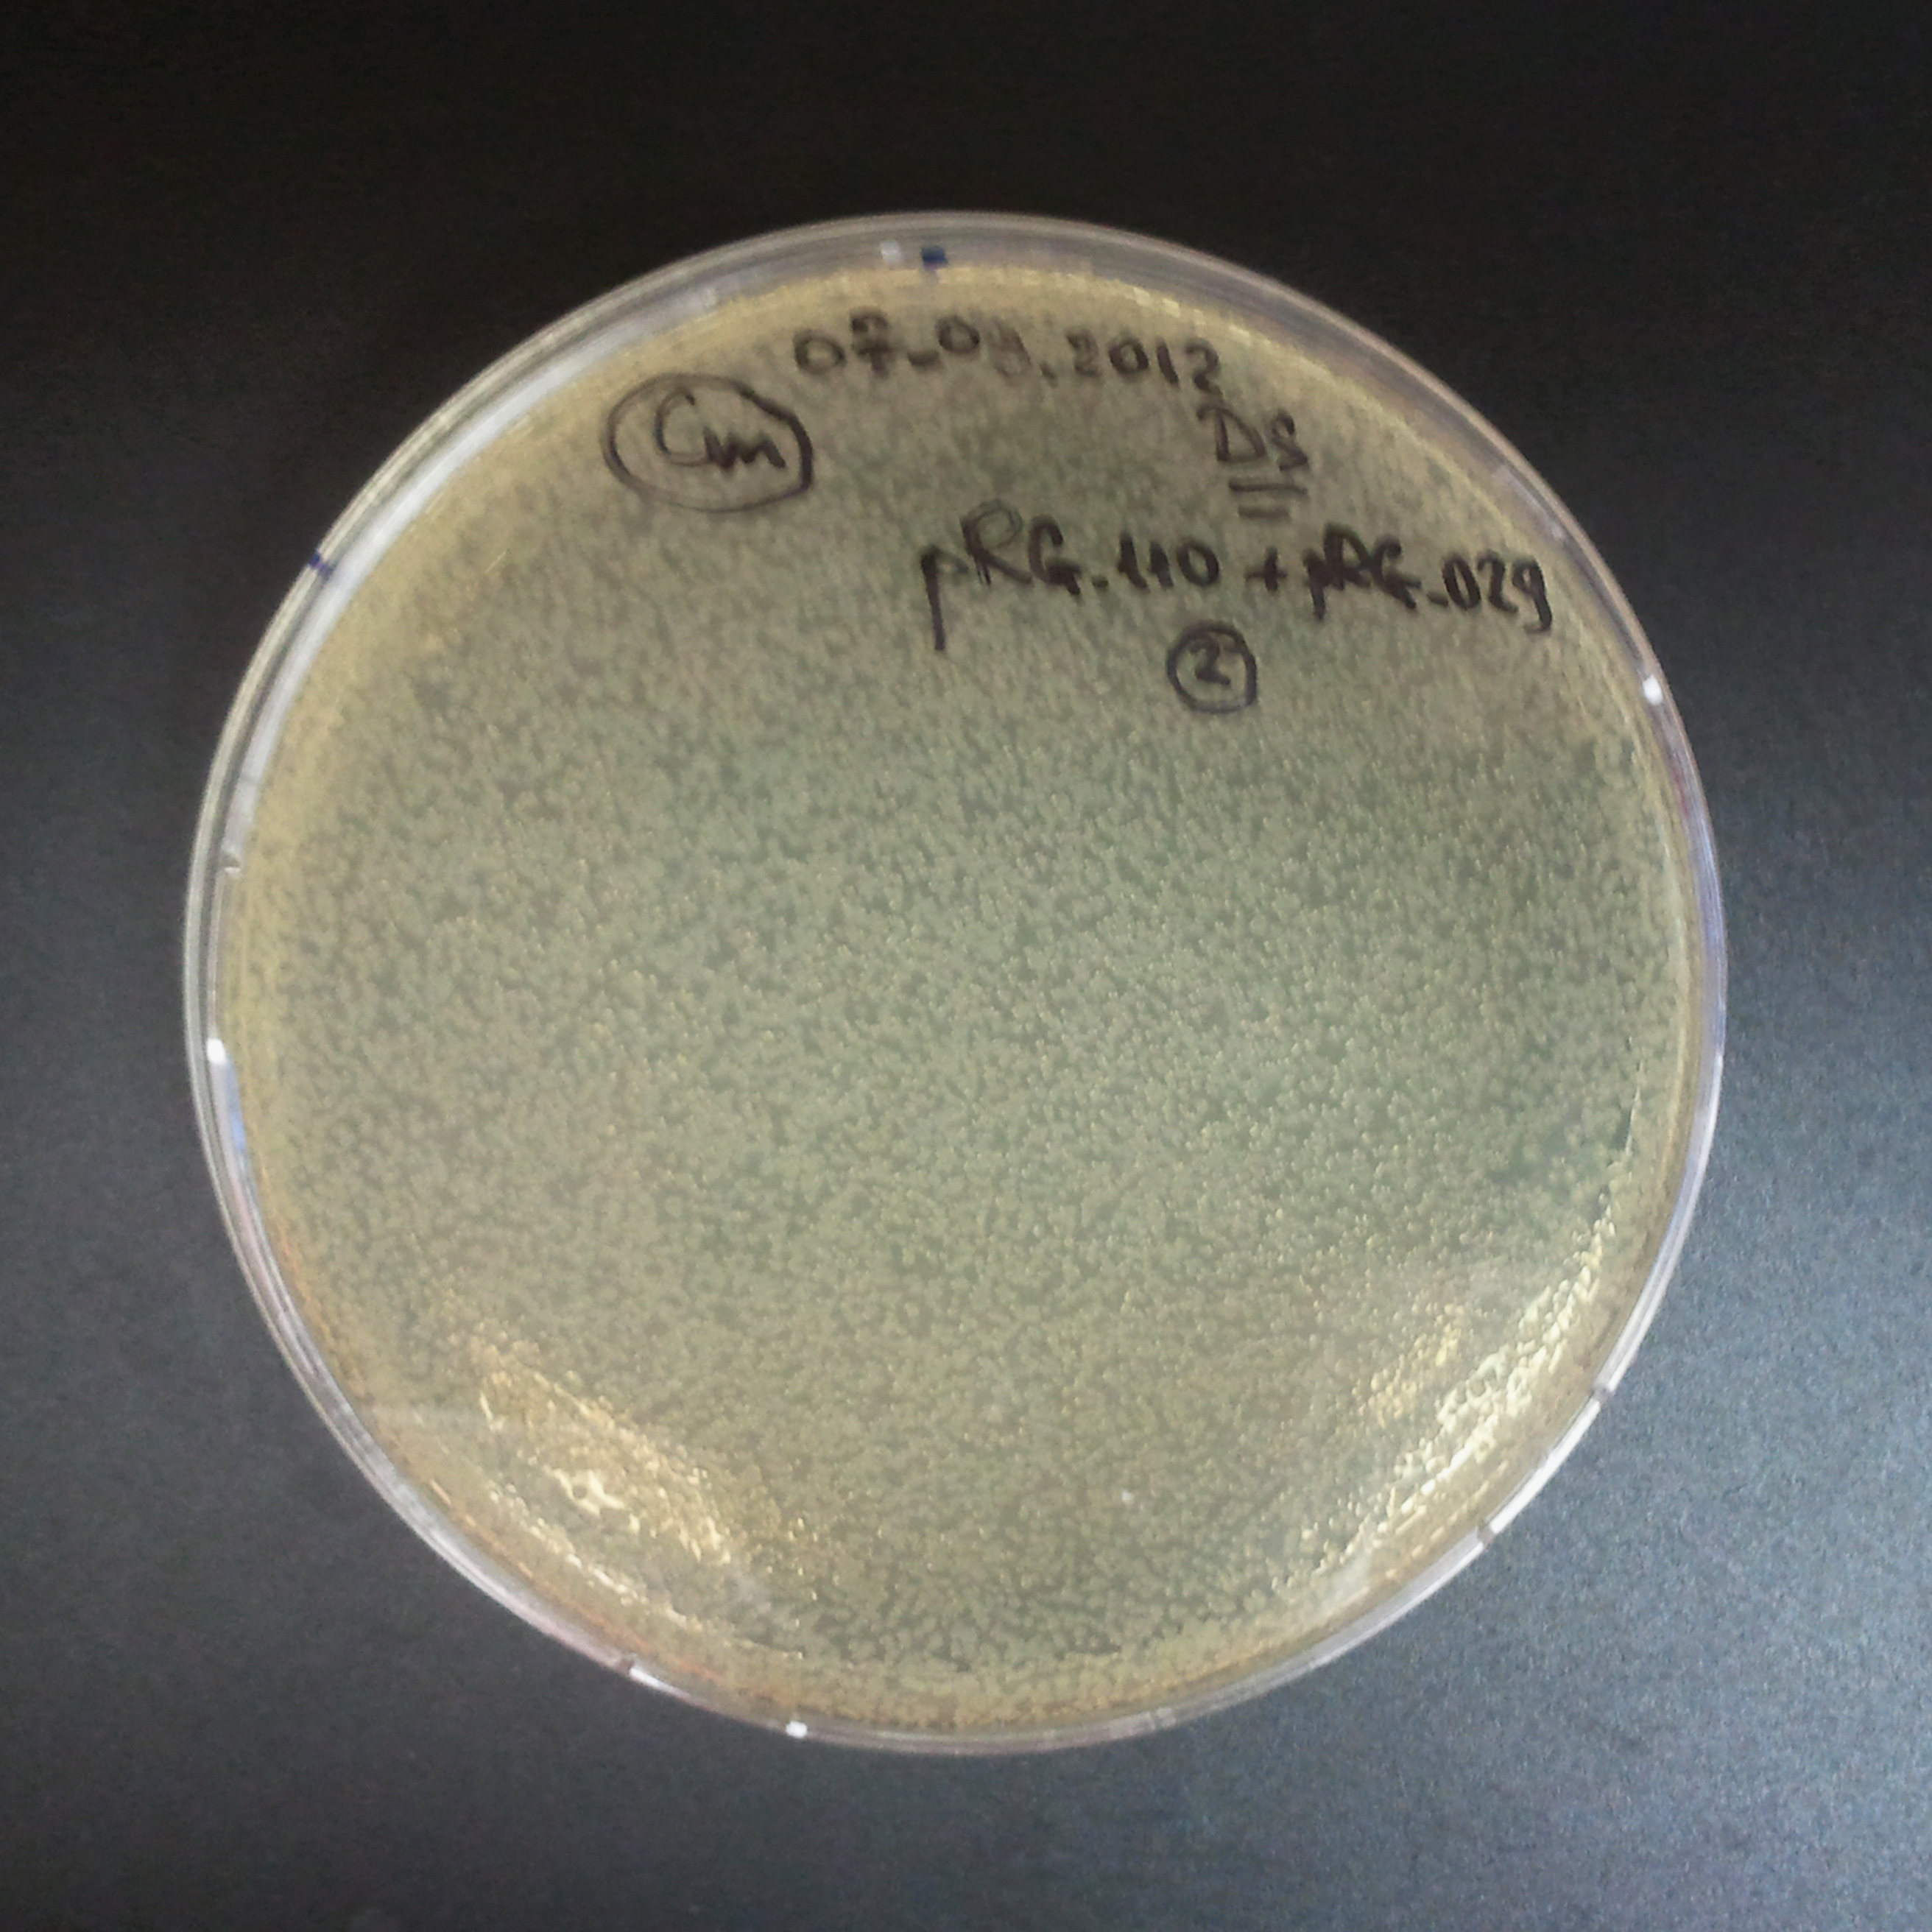
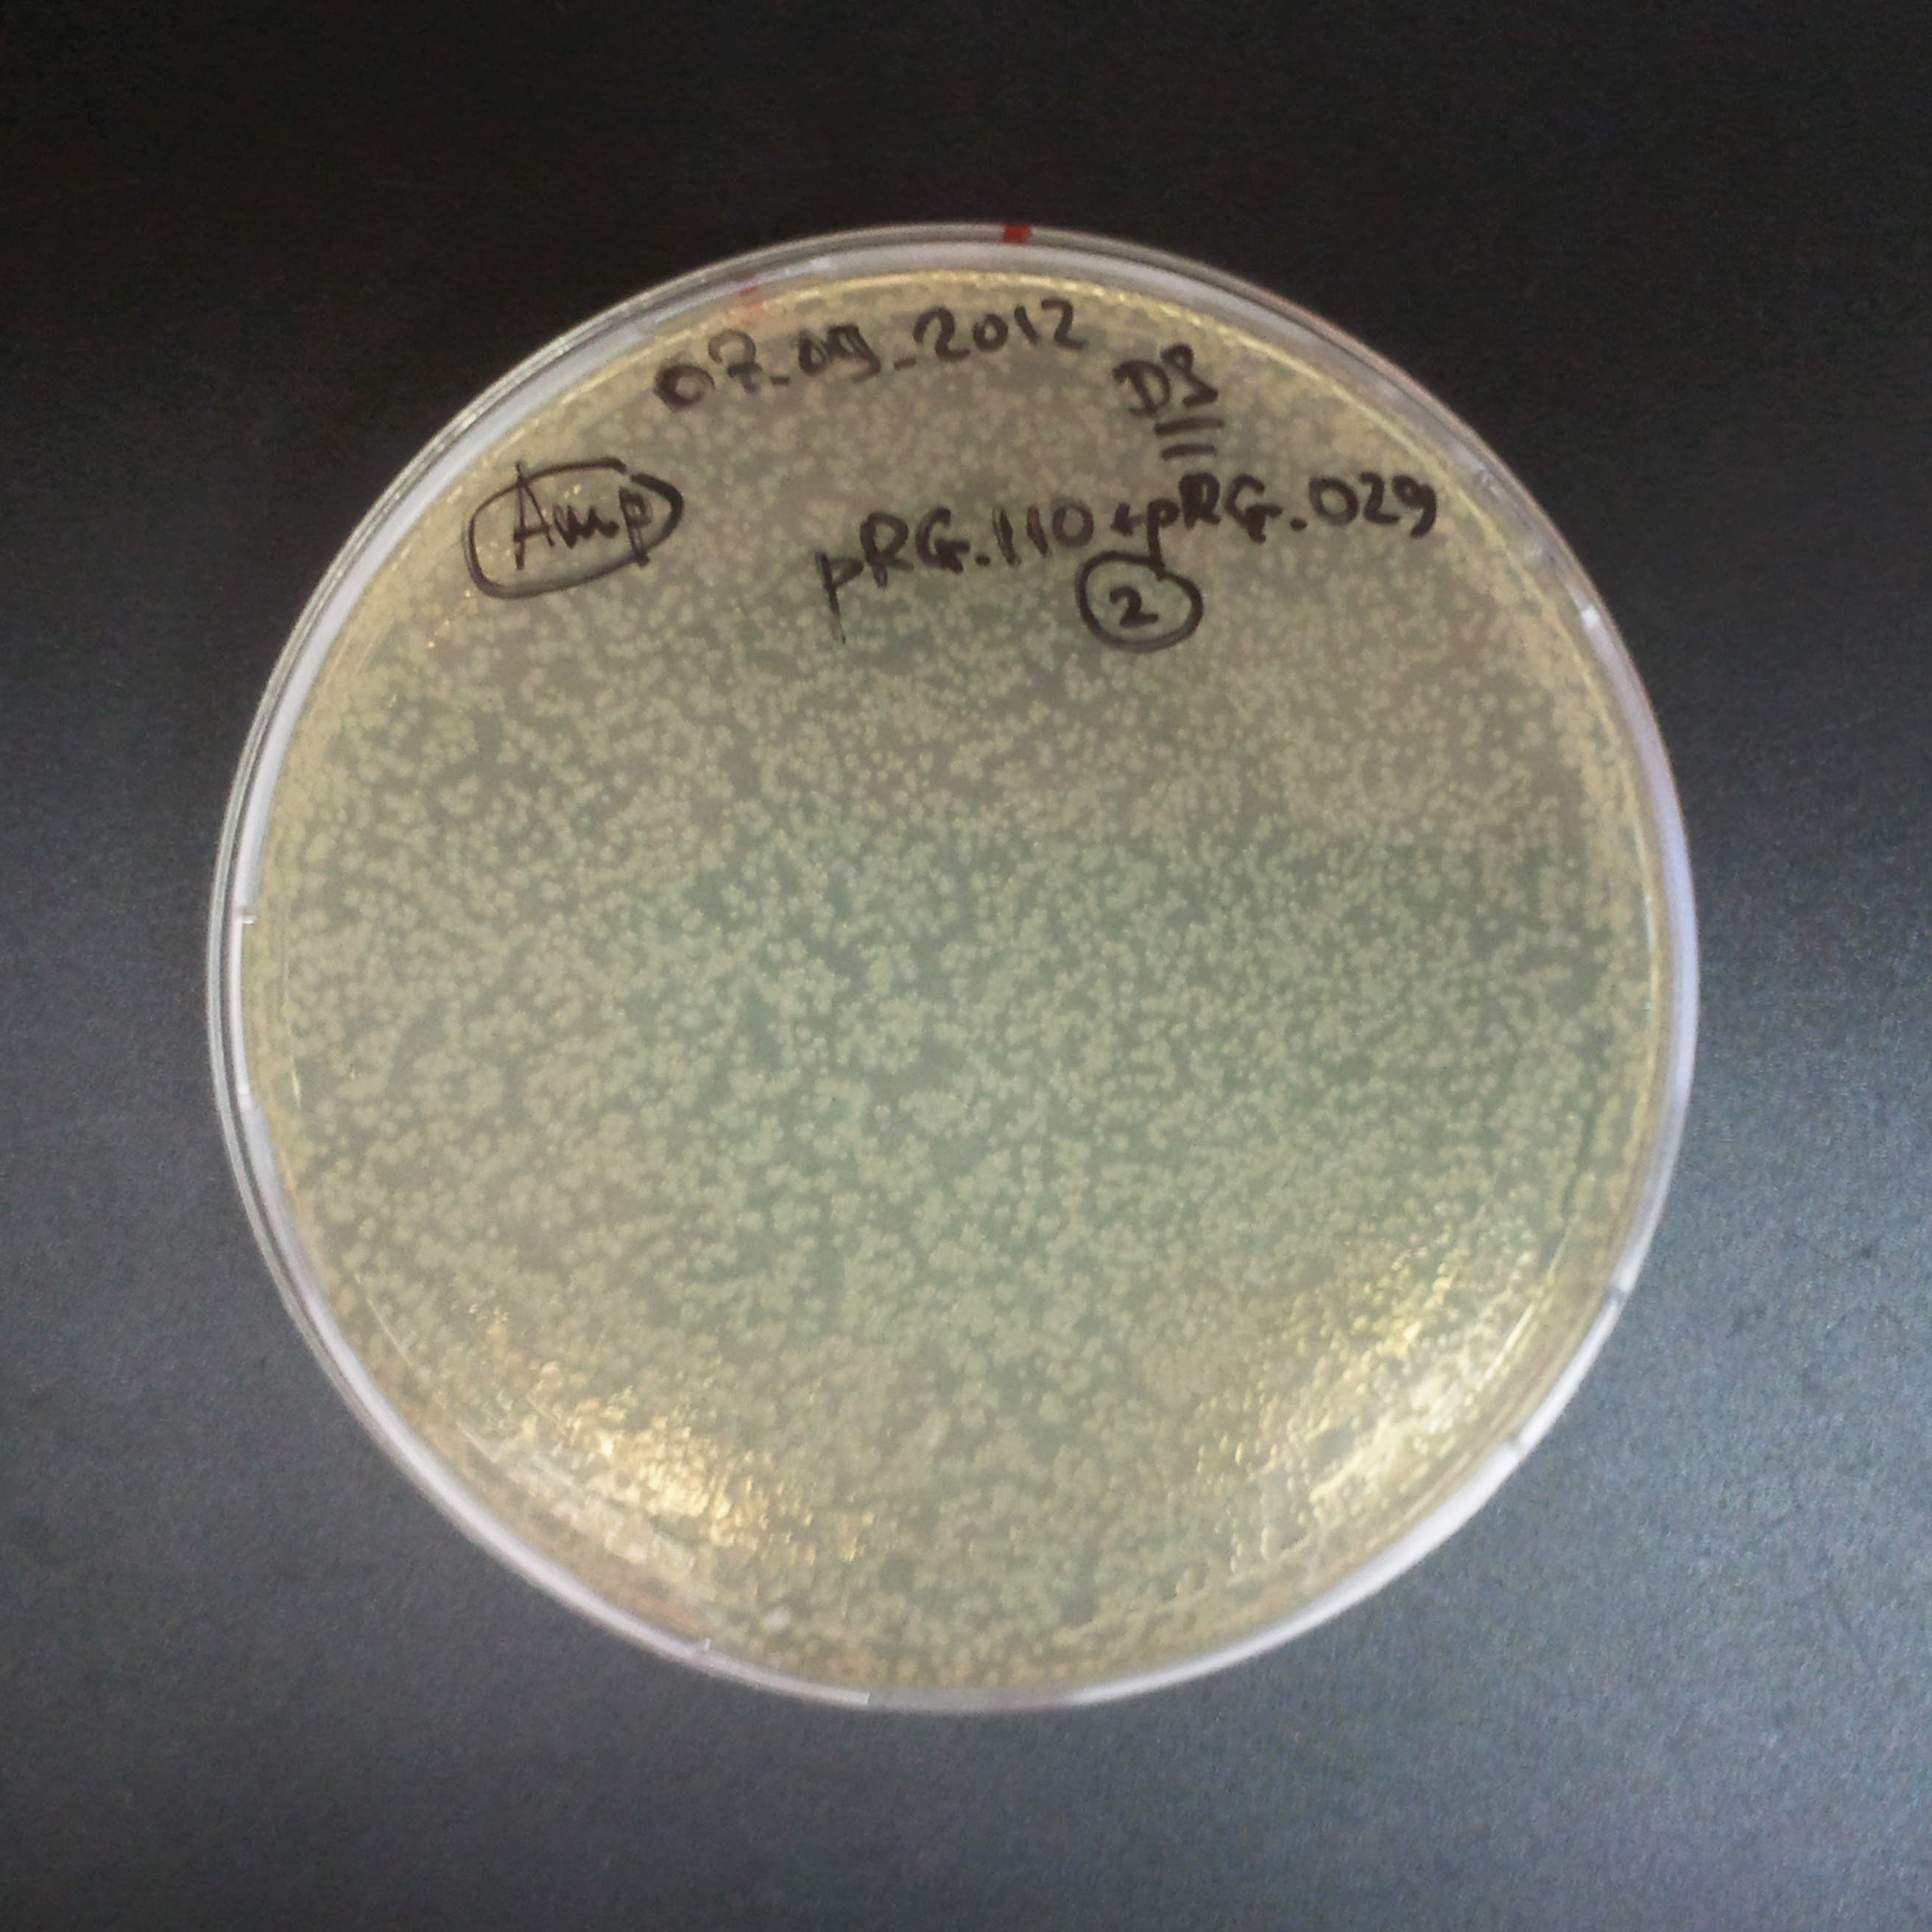
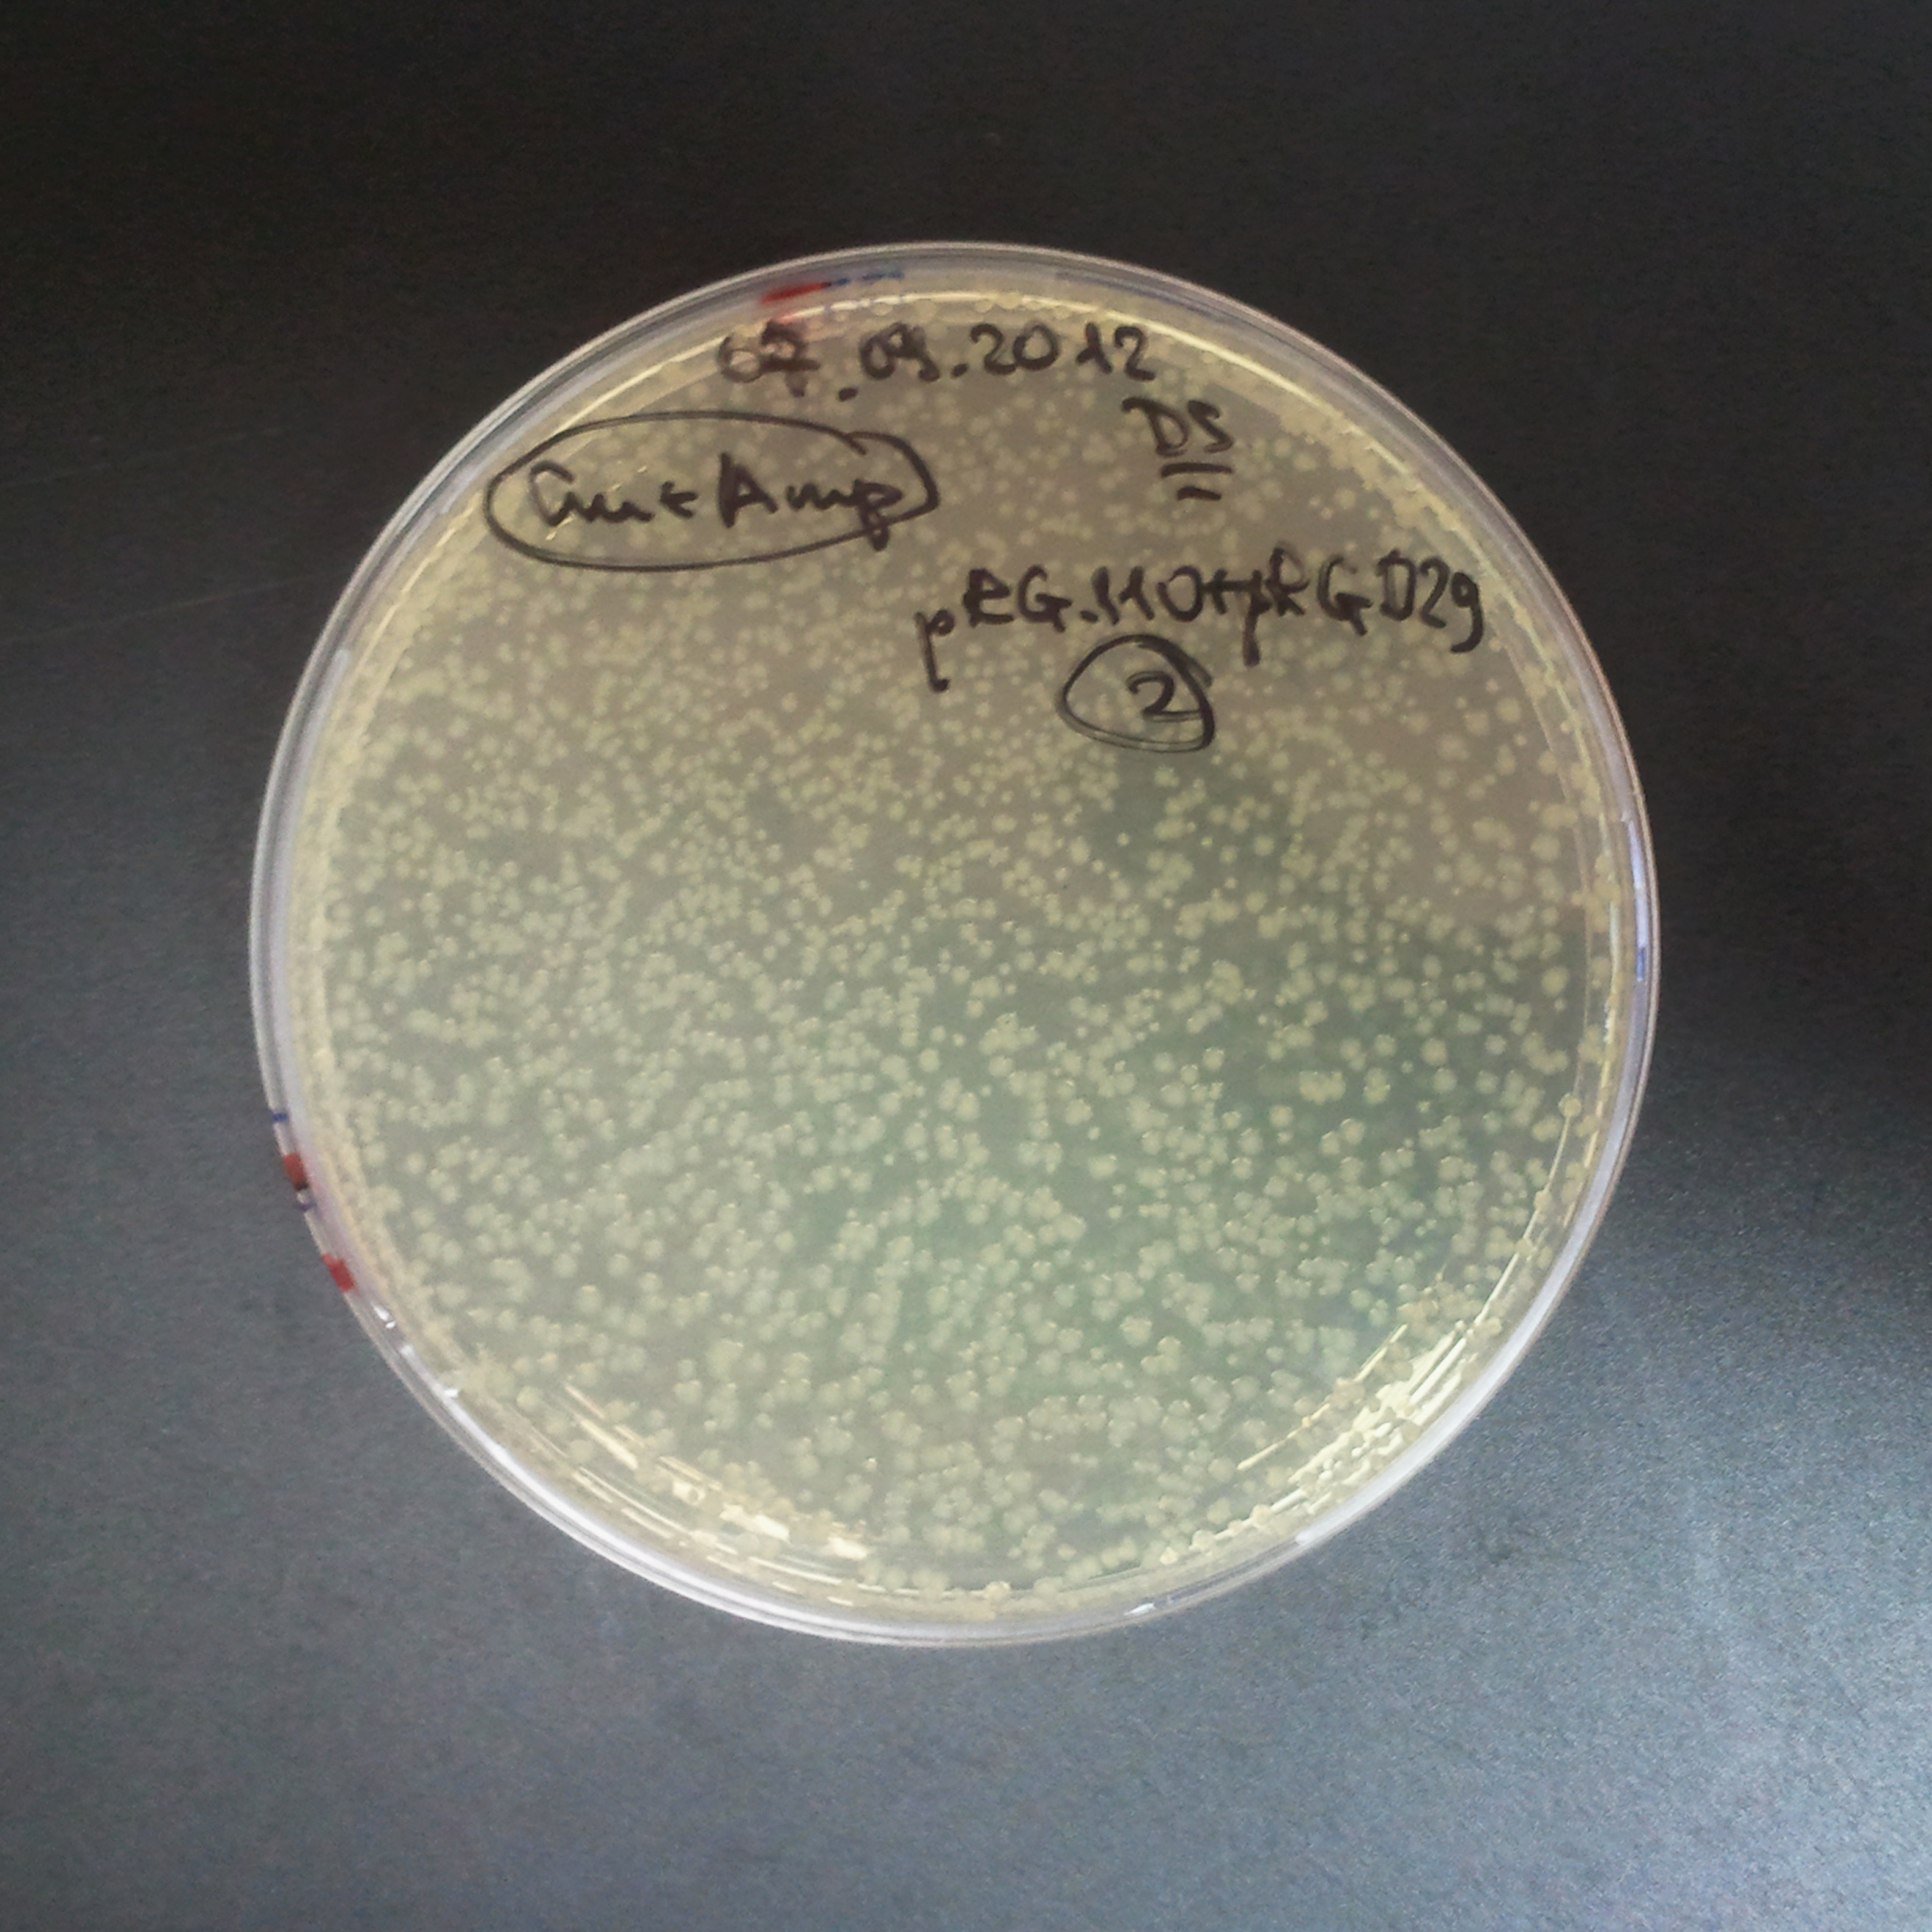
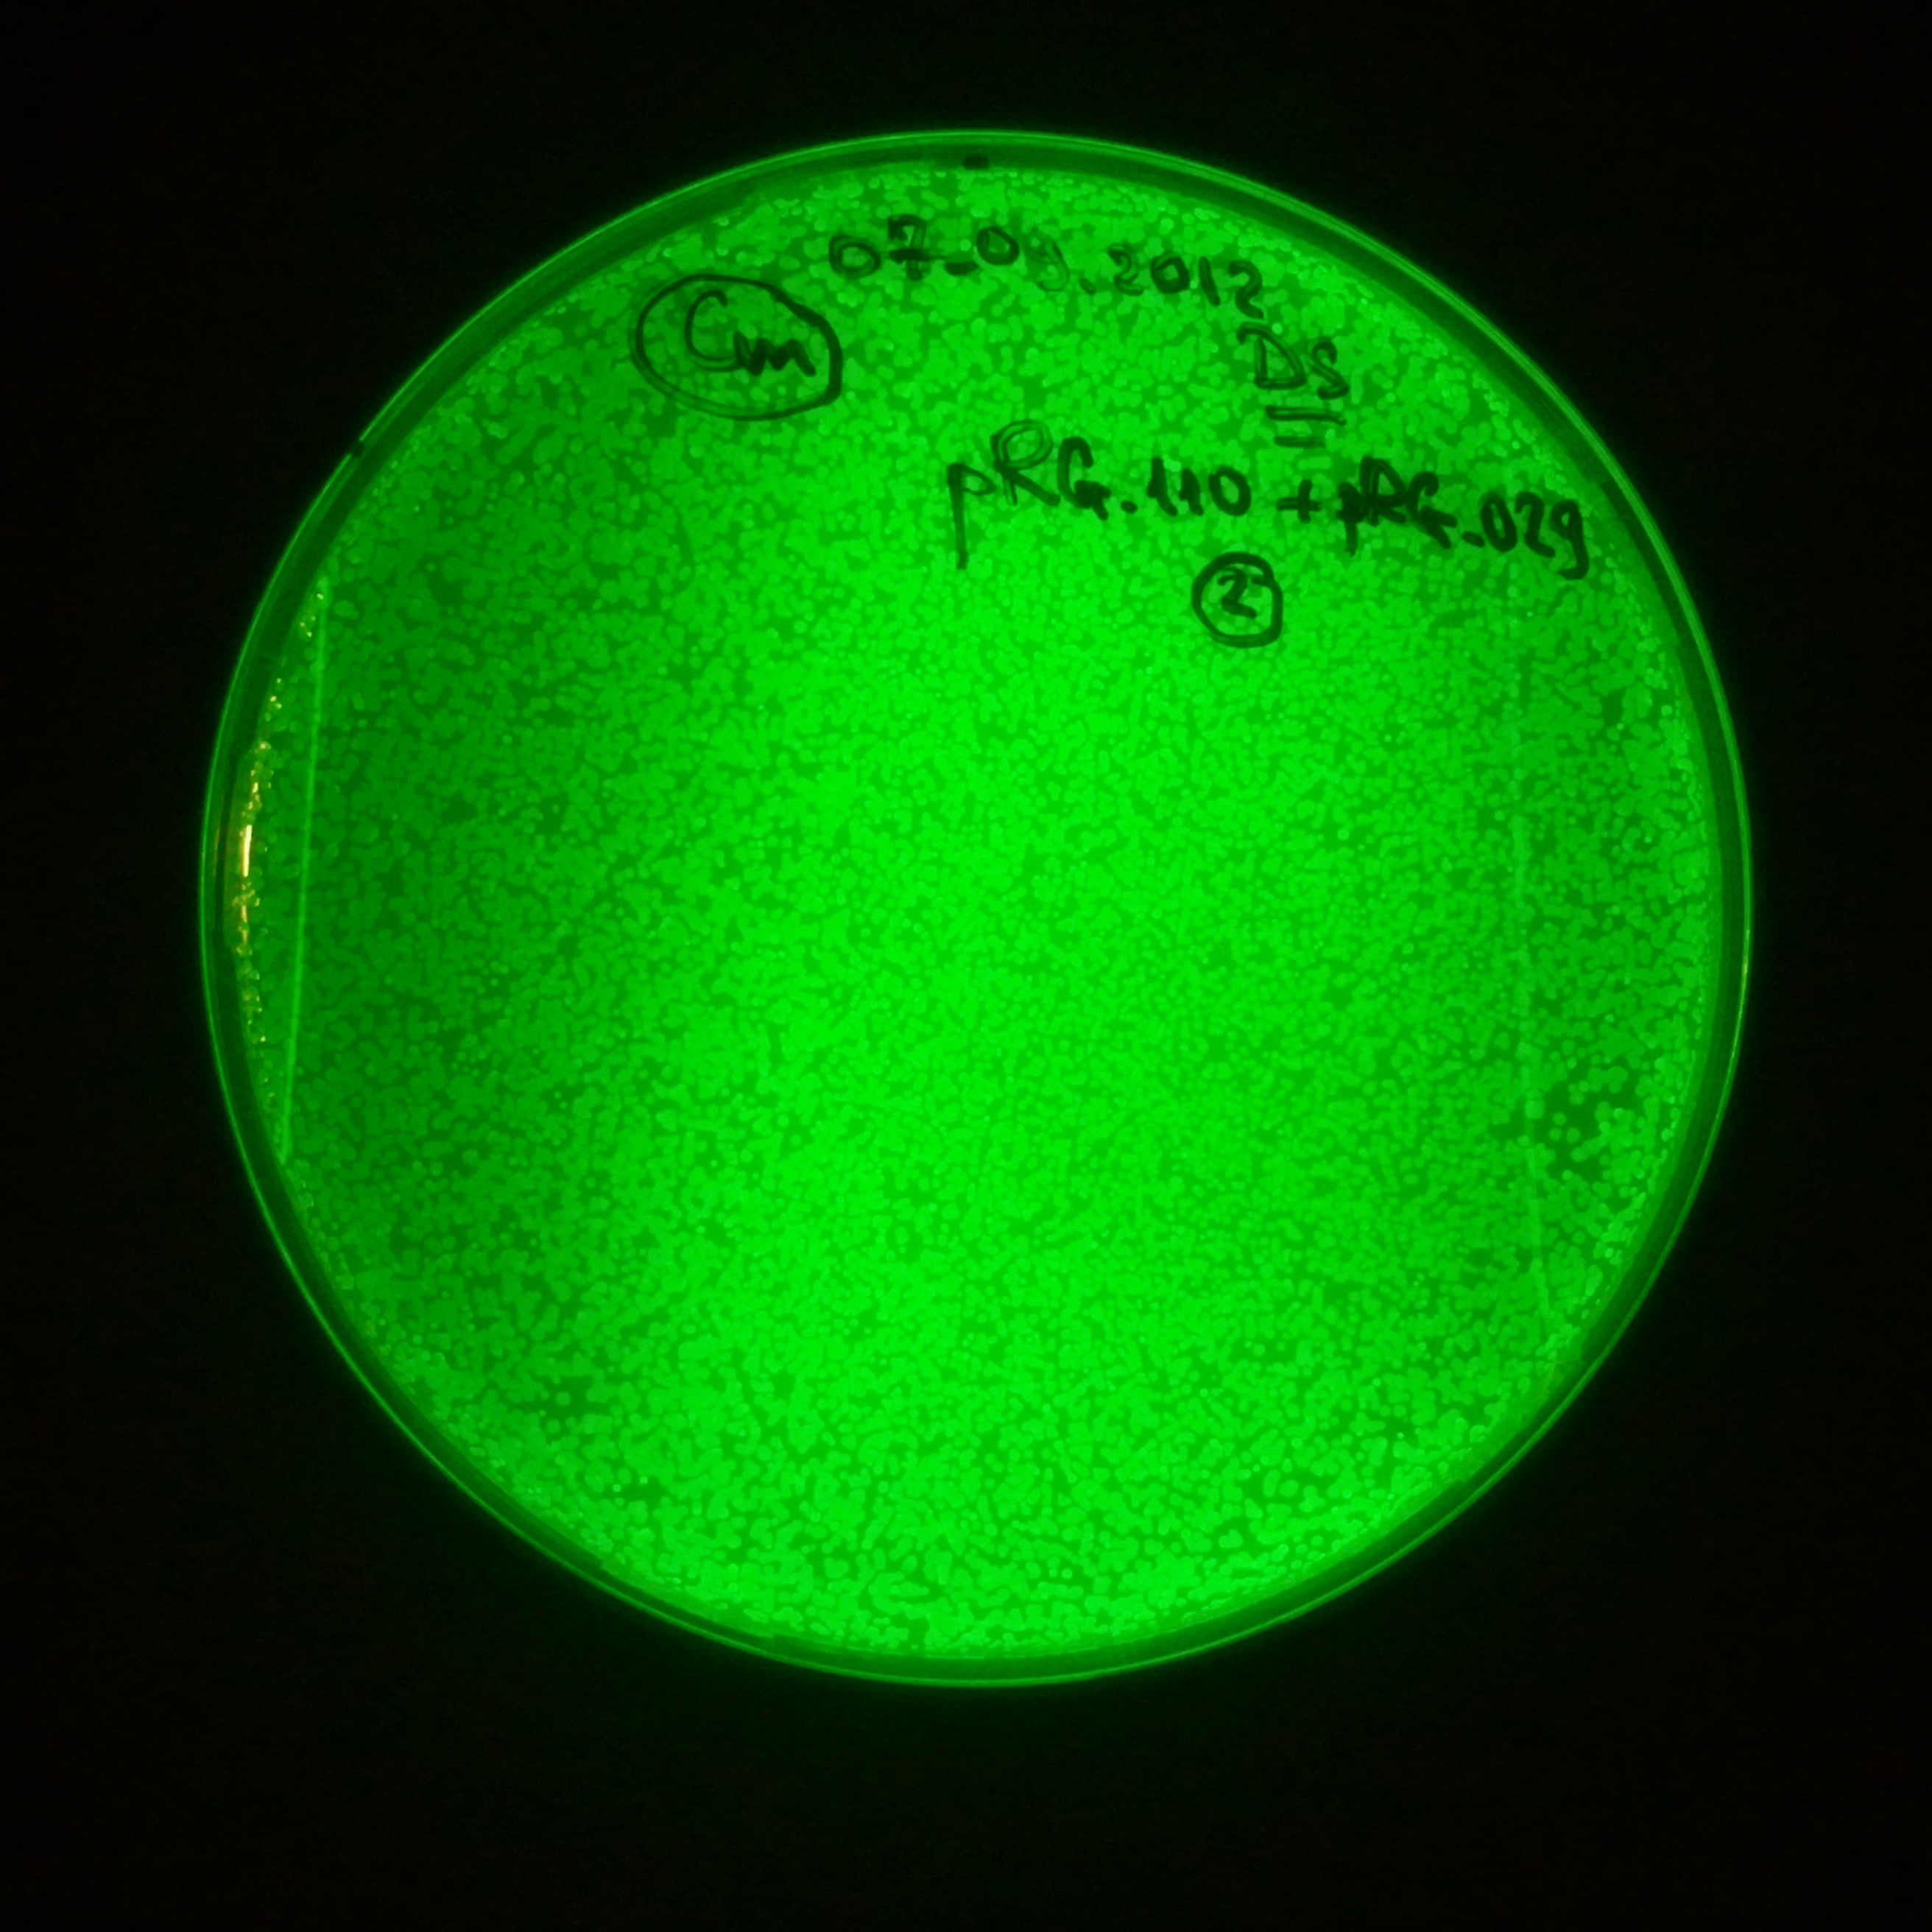
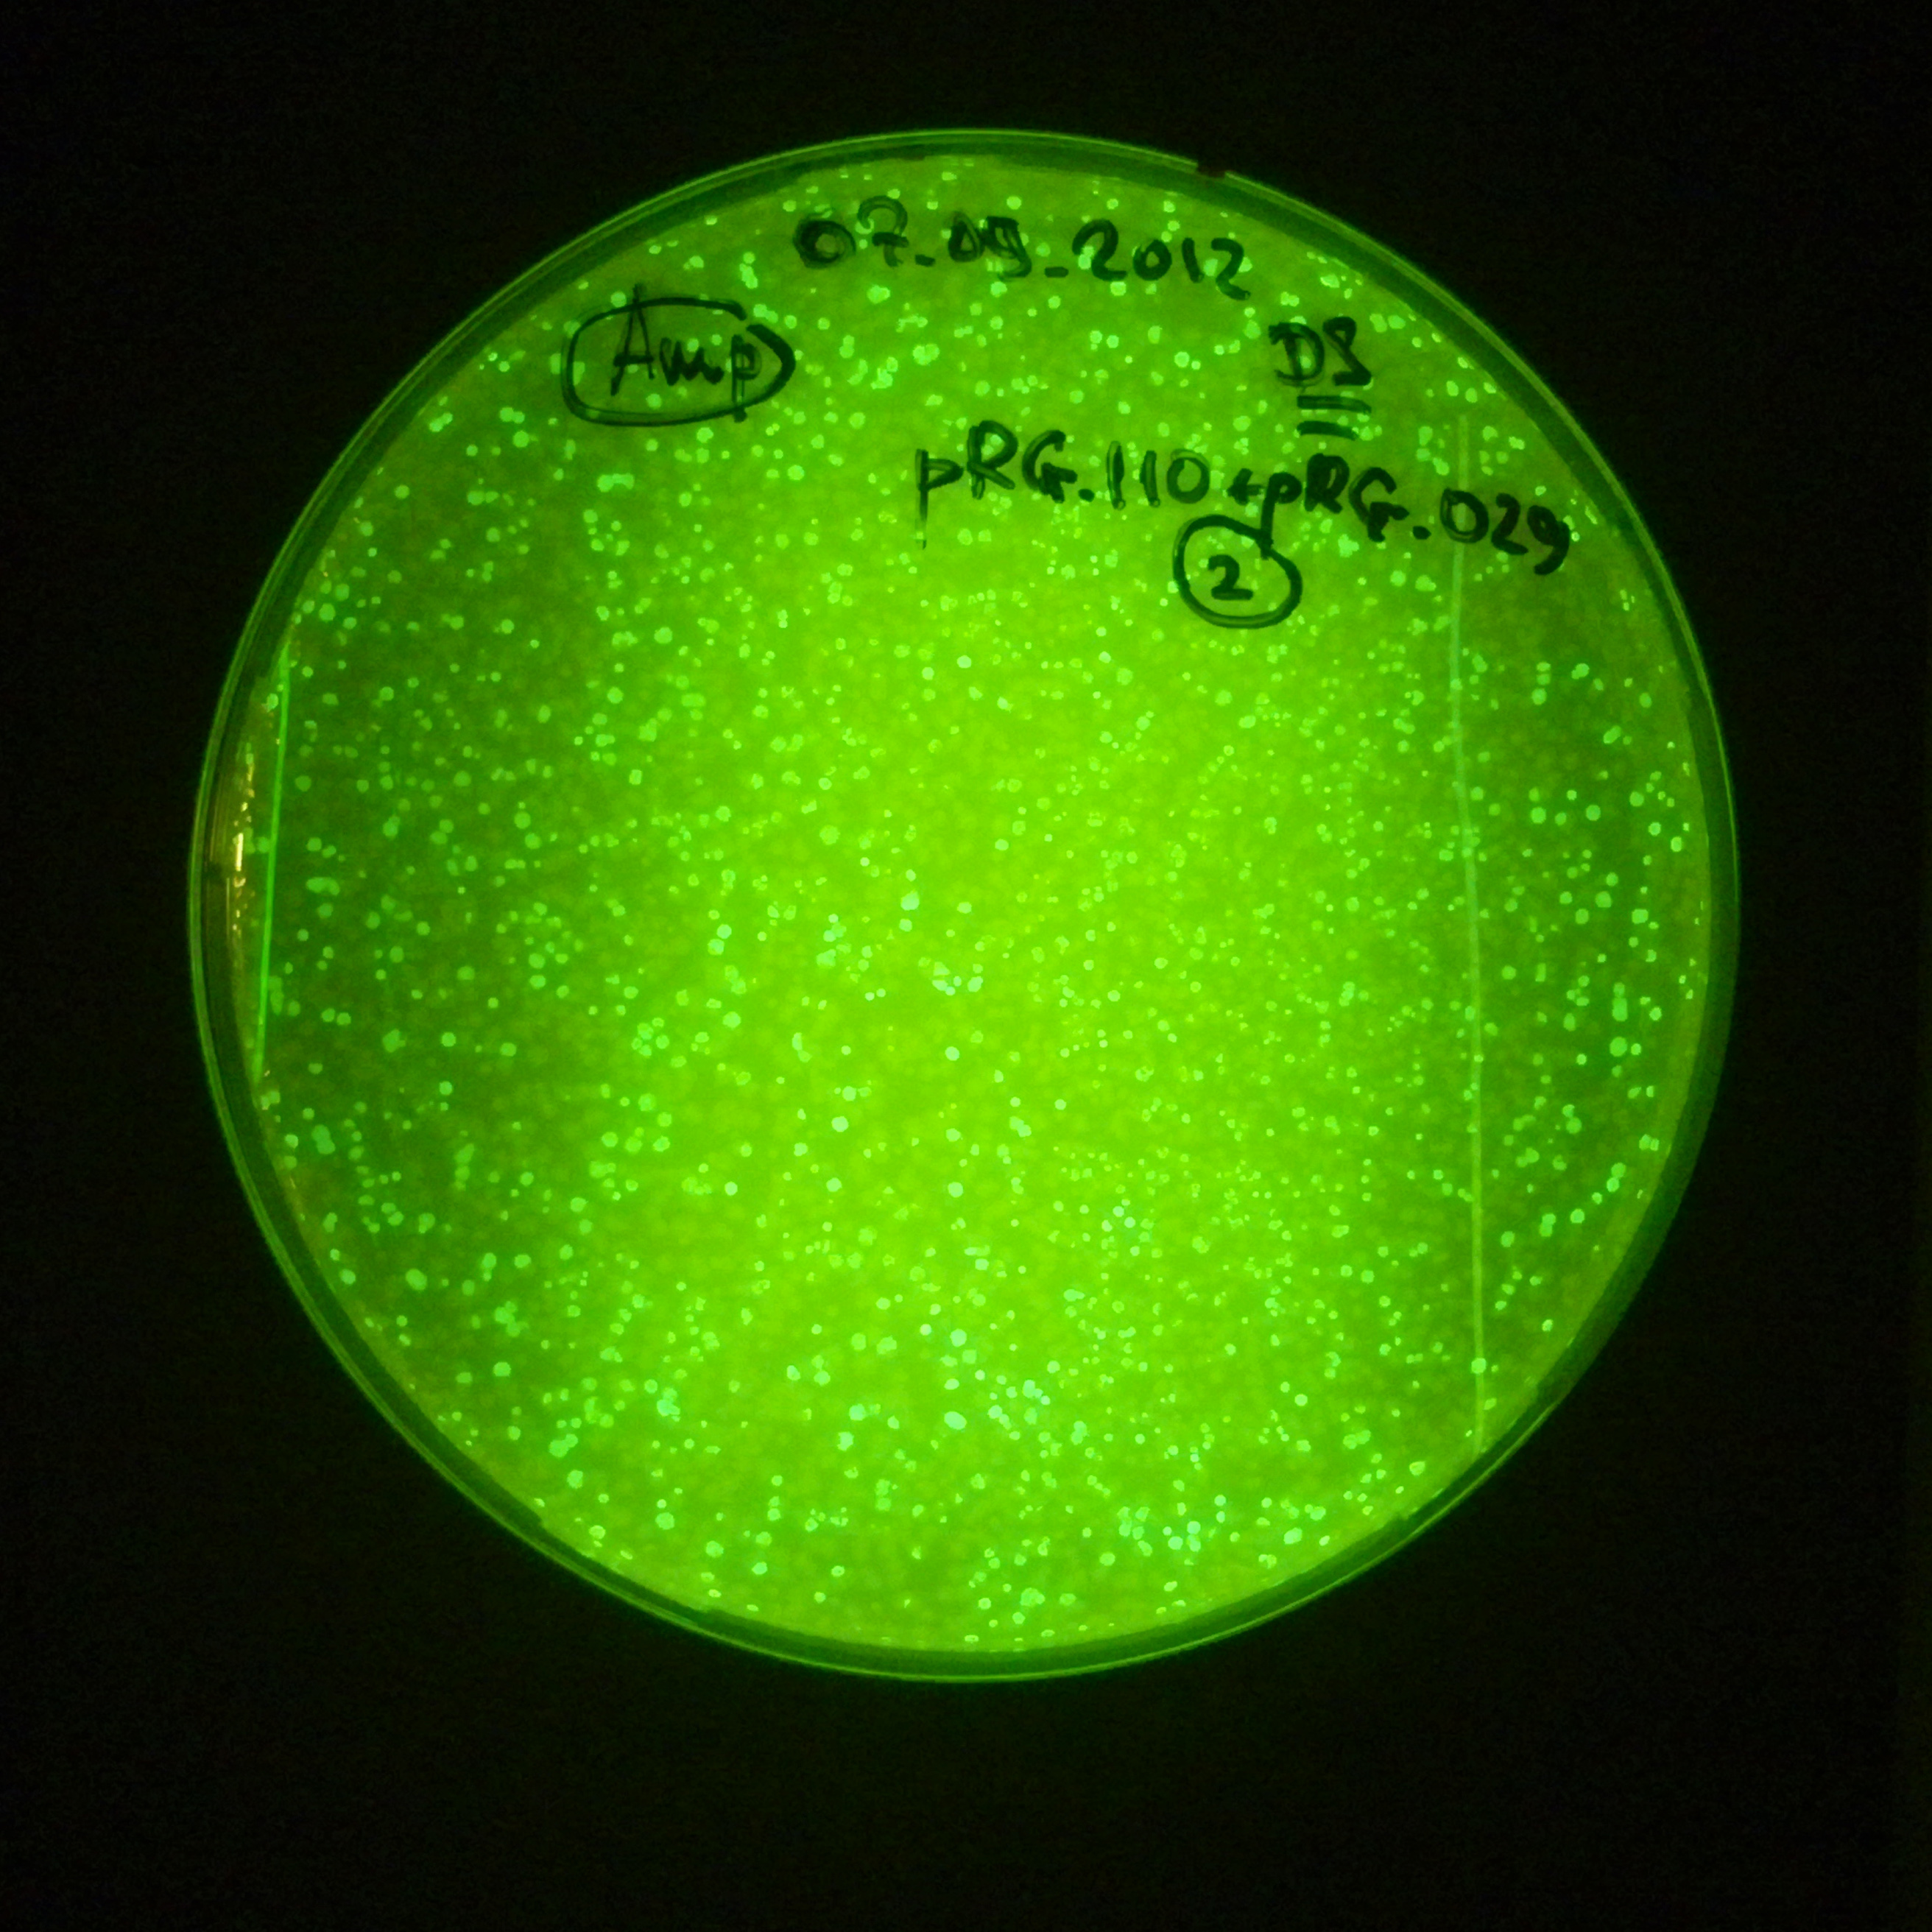
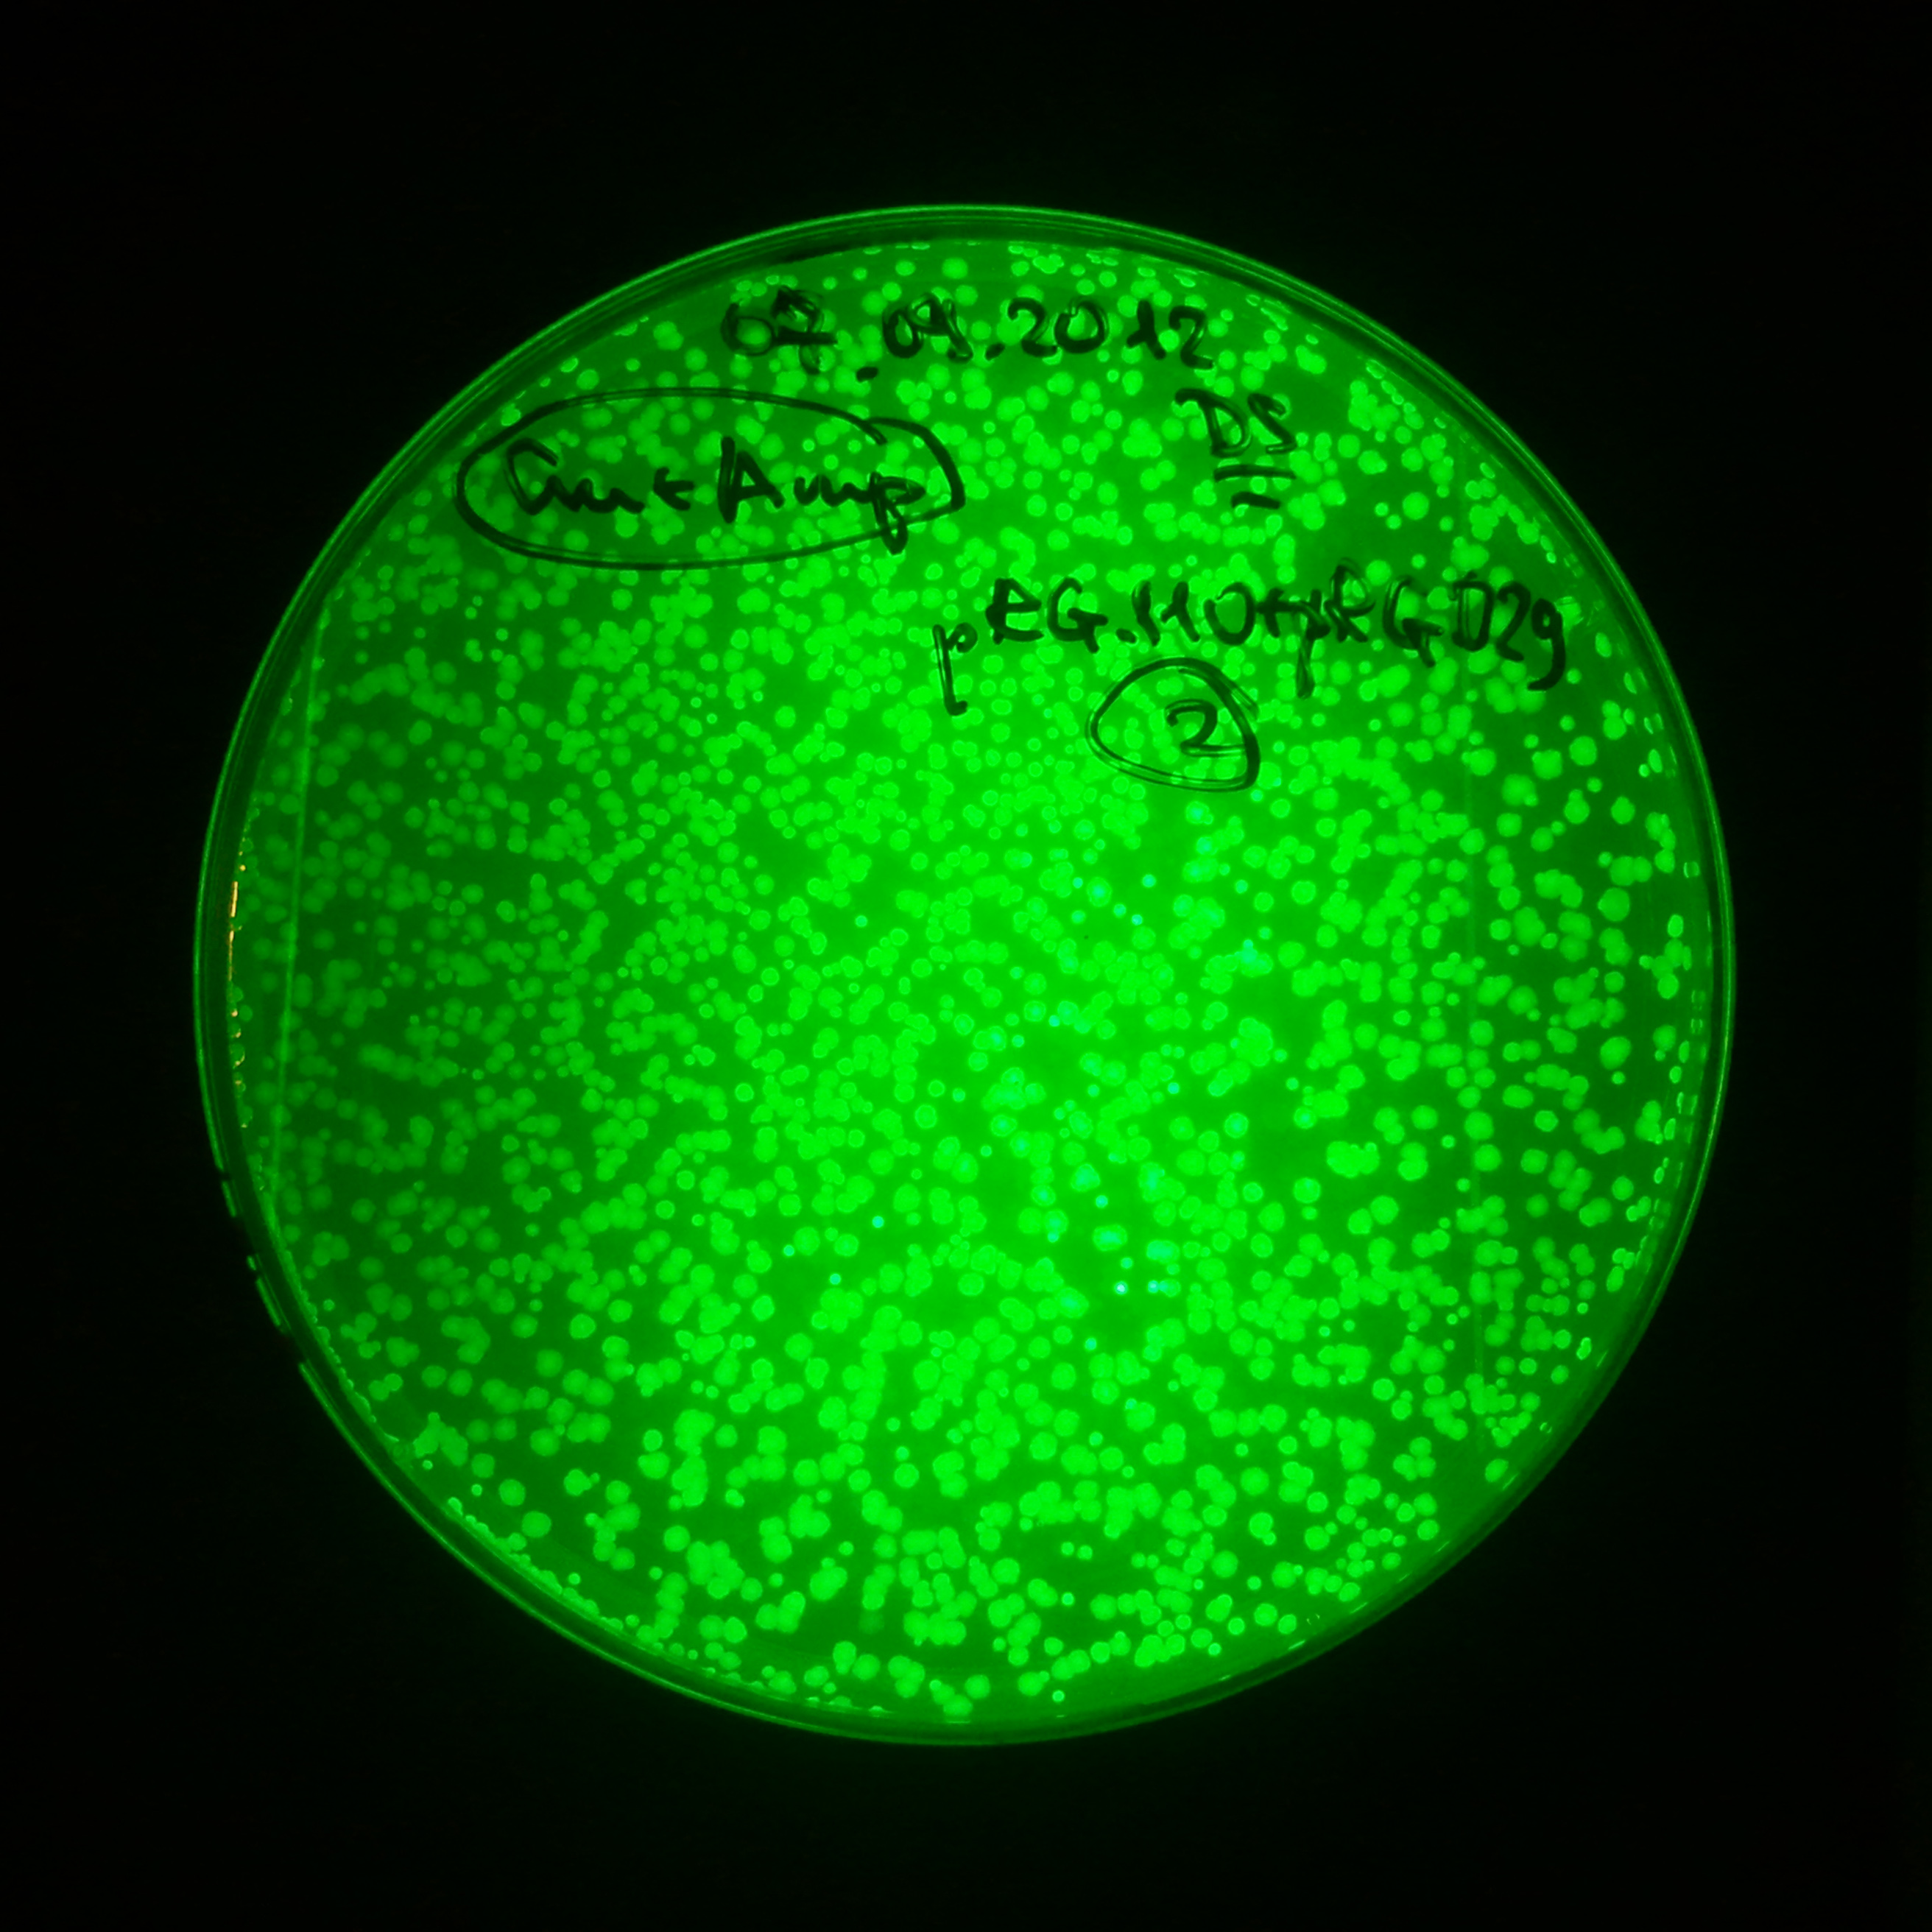
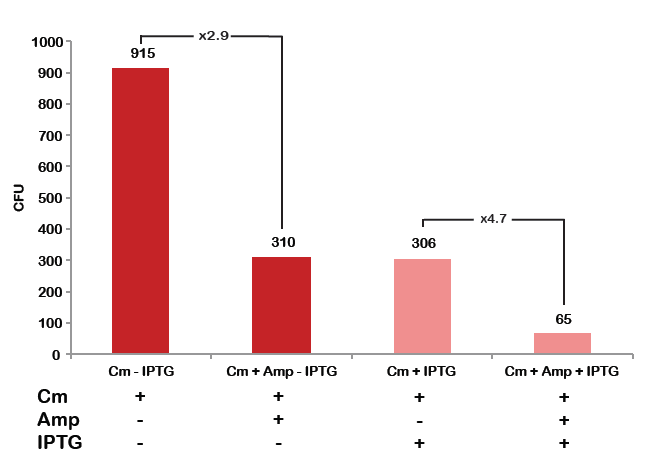
To analyze data, we counted and compared the number of colonies on four plates corresponding to 4 conditions.
- First, we compared the number of CFU formed by non-induced cells, plated with a single antibiotic and with both antibiotics. We expected that the plate with only Cm selection would have the biggest number of colonies. A smaller number would be on the plate with two antibiotics (Amp and Cm). It could be explained by the loss of the plasmid carrying Amp resistance.
- Next, we compared the number of CFUs formed by the cells where we induced the I-SceI expression, plated with a single antibiotic and with both antibiotics. We expect that there would be much less colonies on the double antibiotic plate, because the Ampicillin carrying plasmid would be lost not only due to the absence of selection during growth (as for the first two cells), but also due to the digestion by the restriction enzyme.
The combination of plasmids:
- First plasmid: pLac & RBS & I-SceI [Cm]
- Second plasmid: I-SceI restriction site [Amp]
From photos and bar graph above we can see that our expectation came true.
New Results
Before going to Boston, we improved our protocol to characterize TUDelft BioBricks and showed the reproducibility of the results.
New protocol:
Both TUDelft plasmids are transformed into the E.coli NEB Turbo strain:
- First plasmid: High copy plasmid with encoded generator to express I-SceI meganuclease, [http://partsregistry.org/Part:BBa_K175041 BBa_K175041]:
- Resistance: Chloramphenicol
- Resistance: Chloramphenicol
- Second plasmid: High copy plasmid with encoded I-SceI restriction site, [http://partsregistry.org/Part:BBa_K175027 K175027]:
- Resistance: Ampicillin and Kanamycin
- Start a liquid culture with Amp and Cm to select bacteria which have both plasmids.
- Incubate at 37°C overnight.
- Pellet and wash cells to remove Amp and Cm.
- Re-dilute them in the LB to have OD = 0.05.
- From the tube, start two liquid cultures:
- The first culture with Cm.
- The second culture with Cm and IPTG.
- Incubate bacteria until OD = 0.5
- Plate colonies from each tube on two different plates:
- Select with Cm and Amp.
- Select with Cm.
The advantage of the new version of our protocol is that we add IPTG at the very low OD, so we expect to have better induction of the meganuclease.
Experimental results:
In much the same way as with our previous experiment, we counted and compared the number of colonies on four plates corresponding to 4 conditions:
- First, we compared the number of CFUs formed by the cells where we induced the I-SceI expression, plated with a single antibiotic or with both antibiotics. We expected that there would be fewer colonies on the double antibiotic plates, because the Ampicillin carrying plasmid would be lost not only due to the absence of selection during growth and basal expression level of I-SceI (as for the control), but also due to digestion by the restriction enzyme.
- As a control, we compared the number of CFUs formed by non-induced cells, plated with a single antibiotic and with both antibiotics. We expected that the plates with only Cm selection would have the biggest number of colonies. A smaller number would be on the plate with two antibiotics (Amp and Cm). It could be explained by the loss of the plasmid carrying Amp resistance and basal expression level of the I-SceI meganuclease.
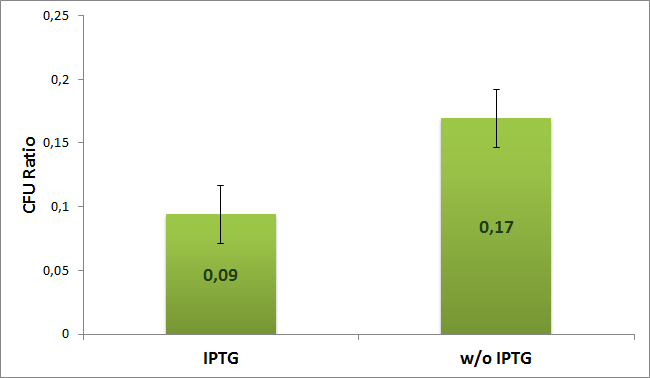
We calculated the ratio between plates with only one or both antibiotics for both the induced (with IPTG) and uninduced (w/o IPTG) case according to the formula:
The experiment was repeated four times. Average value with error bars for both cases are shown on the next diagram:
From the diagram we can see two times the difference between induced and uninduced cells. The results suggest that the plasmids with AmpR which carry the I-SceI restriction site are digested by the I-SceI meganuclease.
Future experiments: We suggest a few ways to improve the efficiency of Restriction Enzyme System Safeguard:
- Firstly, to increase the probability to cut ampicillin resistant plasmids, we could increase the number of restriction sites it contains;
- Secondly, as we have showed, I-SceI meganuclease without the LVA-tag cut ampicillin resistant plasmids very efficiently even without induction of the regulated promoter. So, we could try to clone our constructs with weaker RBS or weaker LVA tag, two find a balance between the two states we describes in our experiments.
Characterization of pRha
We have submitted to the registry a new characterized promoter: pRha [http://partsregistry.org/wiki/index.php?title=Part:BBa_K914003 K914003].
Experimental setup
In order to characterize this promoter, we made a construct with a medium RBS ([http://partsregistry.org/Part:BBa_B0032 B0032]) and an RFP ([]) cloned downstream of the pRha, on the pSB3C5 plasmid. We induced the expression of RFP by adding L-Rhamnose. As a negative control, we used cells without the inducer, as well as cells repressed with Glucose.
Results
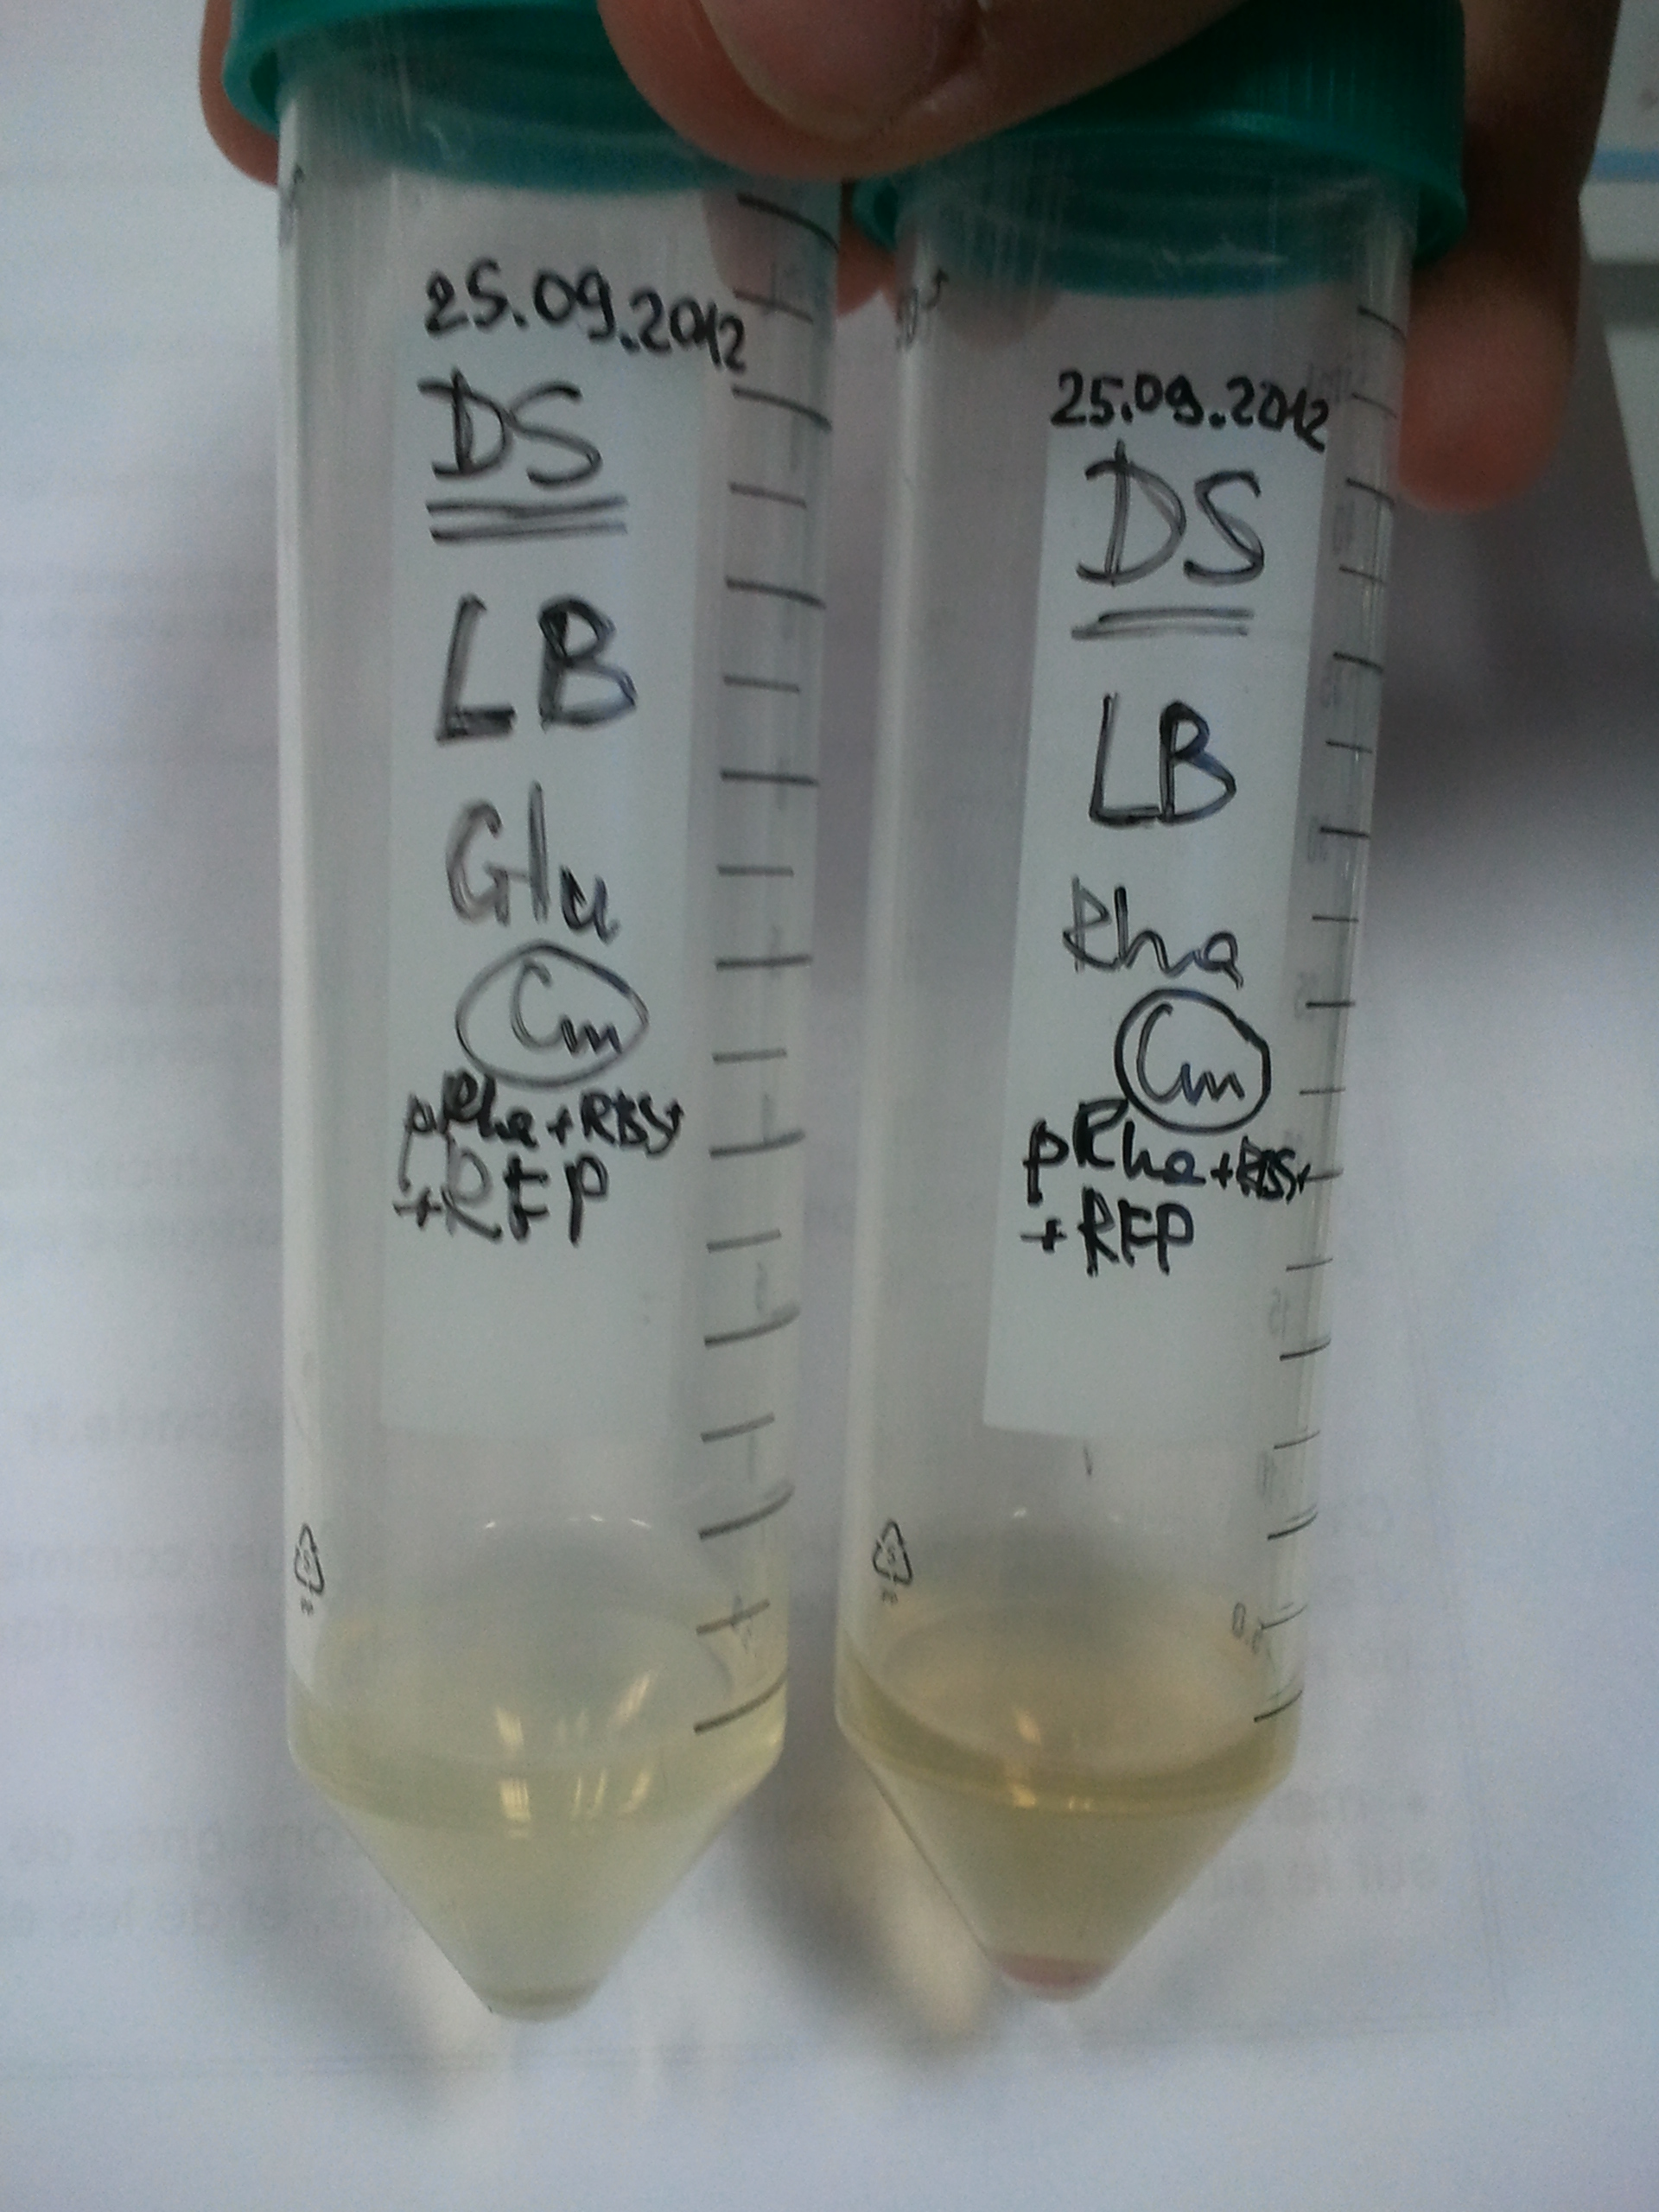
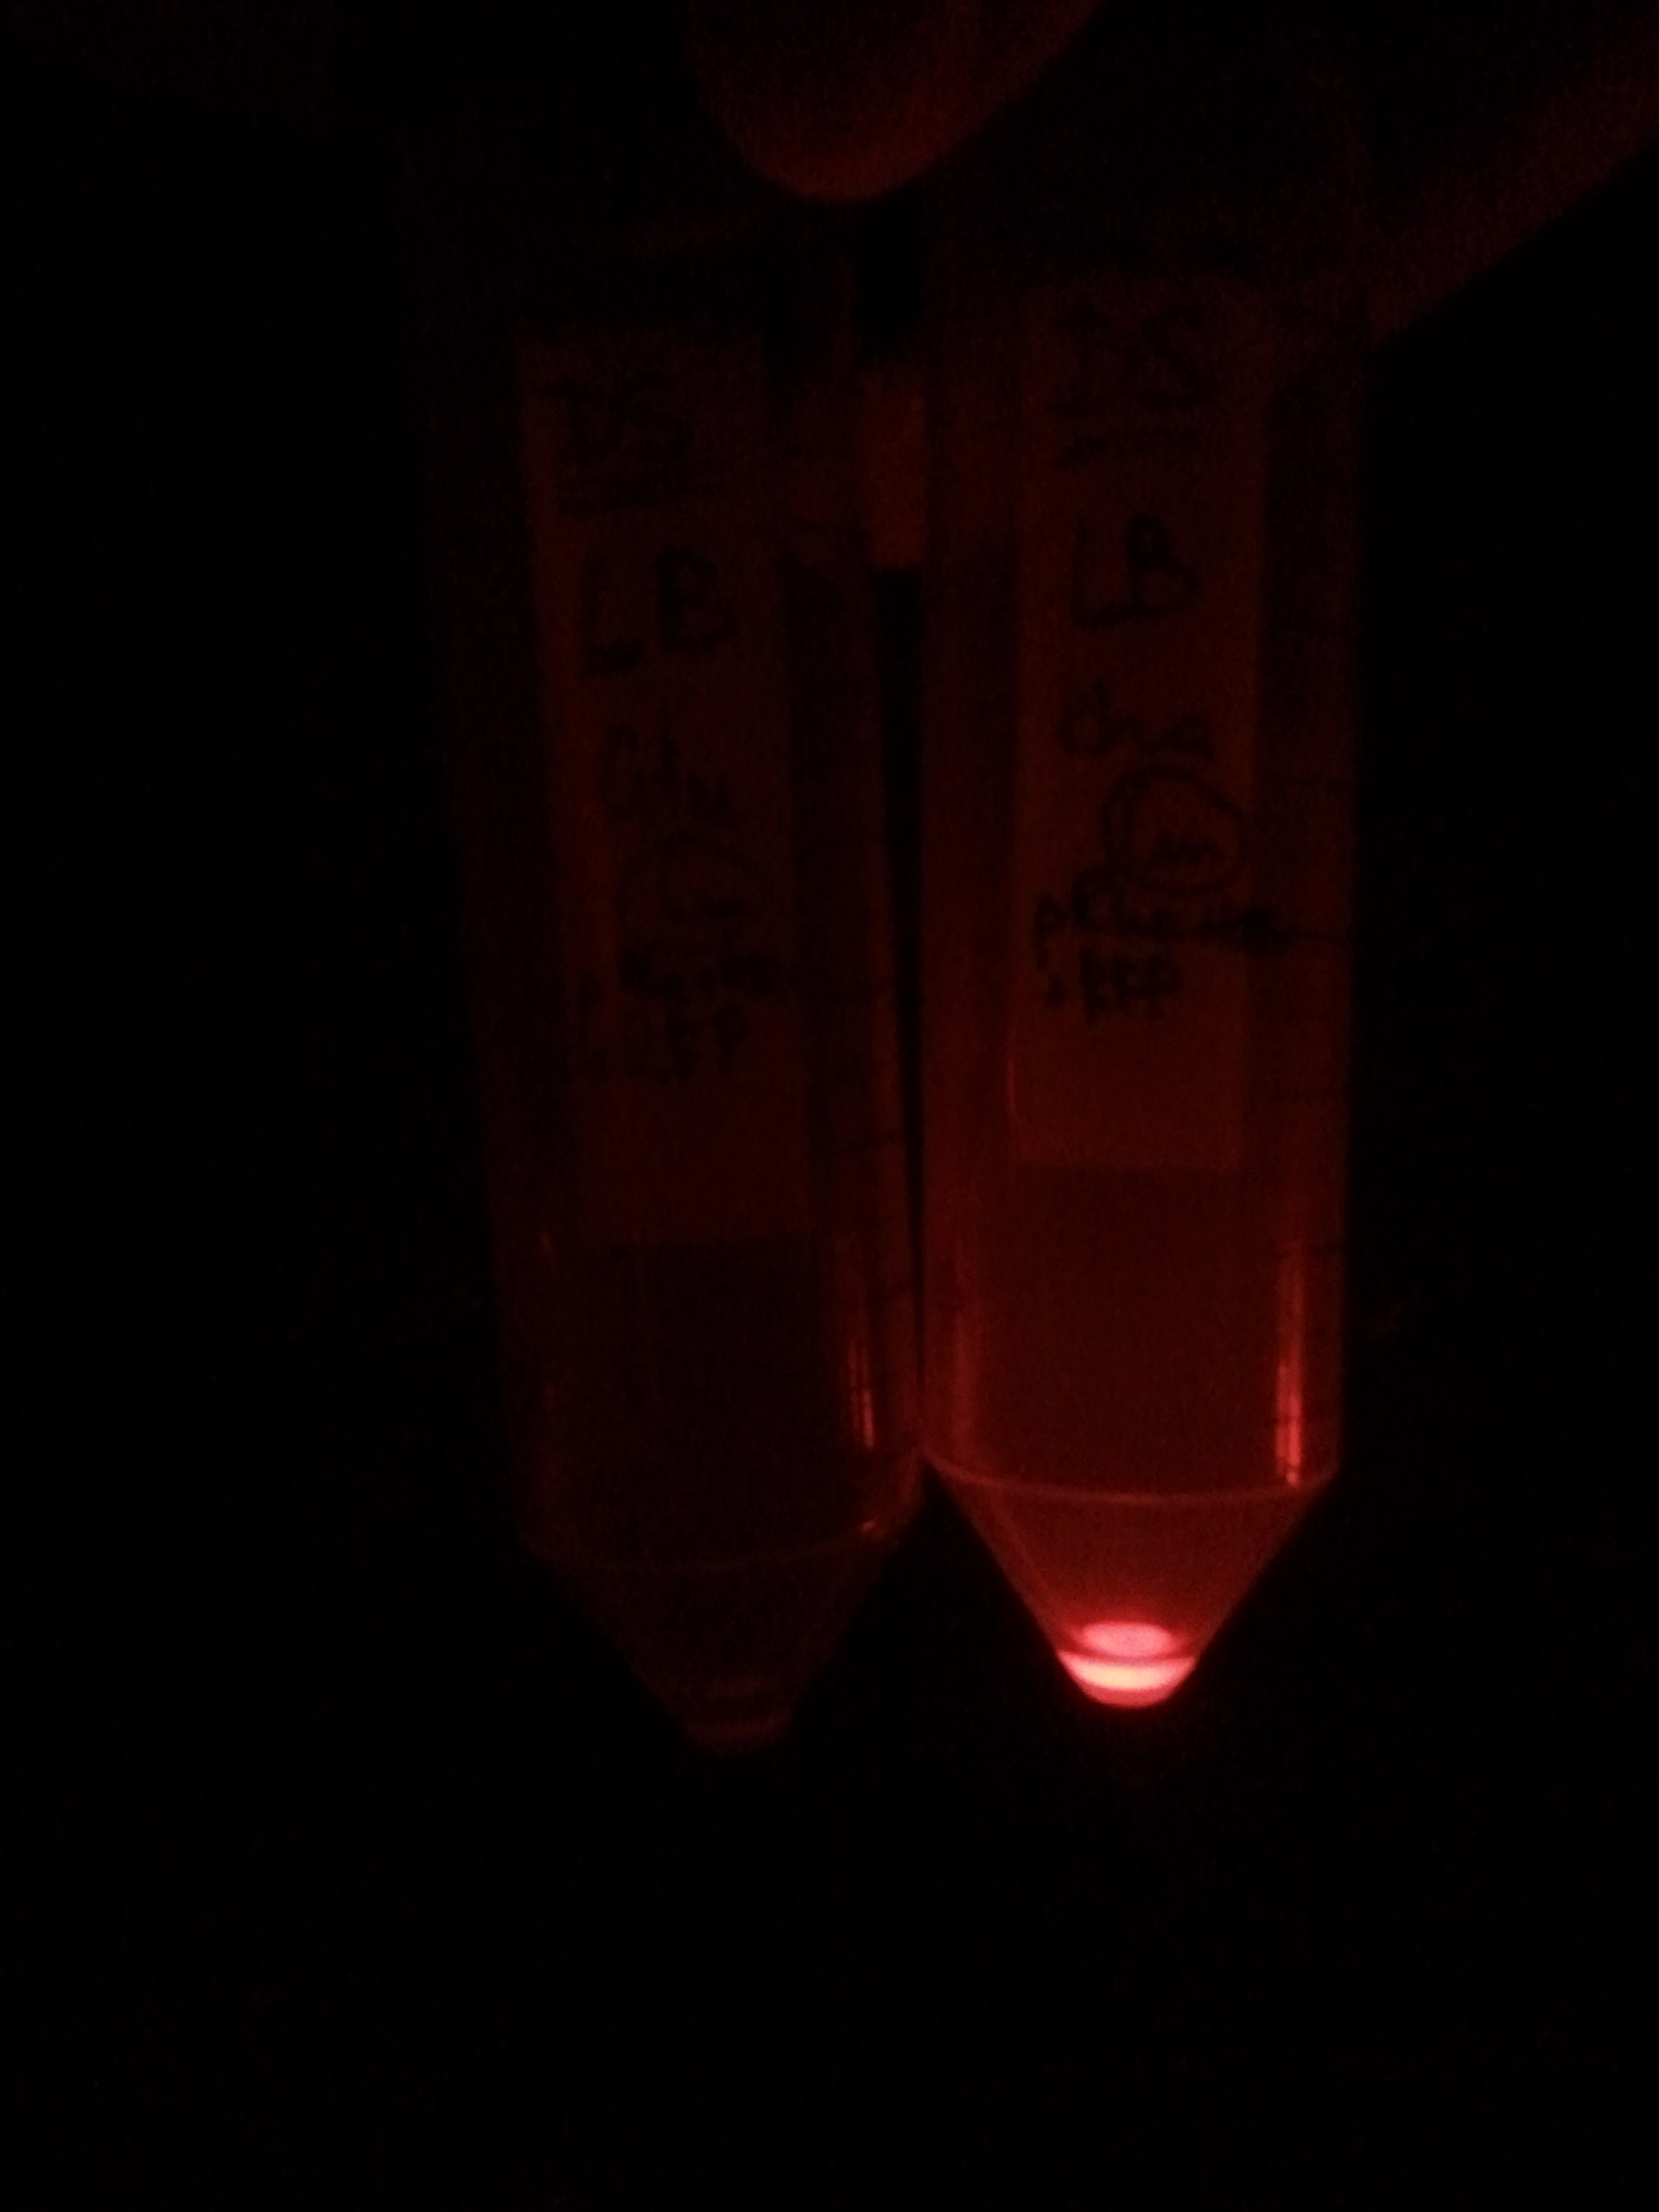
First, by simple observation under a fluorescence viewer, we have seen that the addition of 1% L-Rhamnose leads to a significant expression of RFP after 10hours. The negative controls, where no Rhamnose was added, or when the promoter was repressed by Glucose, did not show any visible fluorescence. Both photos are taken after we centrifuged a culture of NEB Turbo strain with transformed plasmid. For the fluorescent result, the same tubes were photographed under excitation light (540nm), through an emission filter (590nm).
We quantified this result in a plate reader.
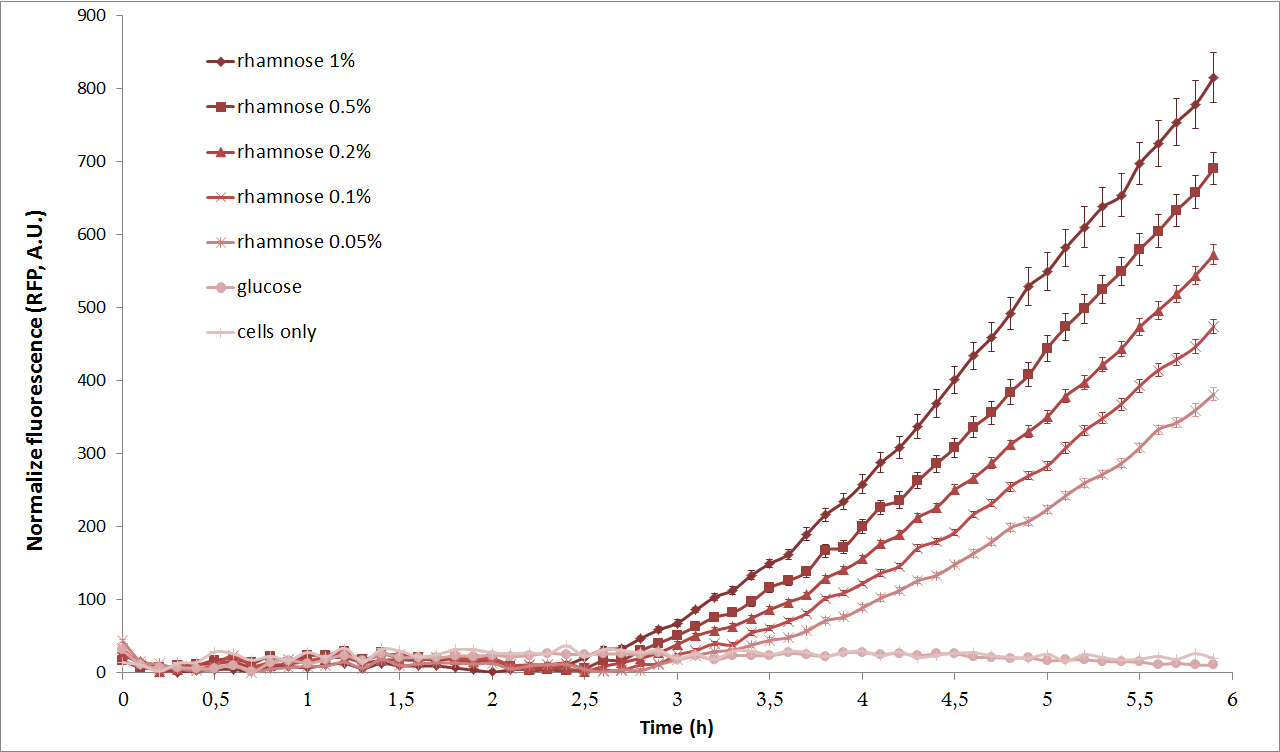
Next, we characterized the pRha promoter using a plate reader. We used different concentrations of L-Rhamnose (0.05%, 0.1%, 0.2%, 0.5% and 1%) and observed the resulting fluorescence over time. As negative controls, we used the non-induced cells, as well as cells repressed by 1% Glucose.
As we can see from the graph above, pRha promoter works as expected and it could be well tuned by concentration of L-rhamnose.
References
- «Fsel, a new type II restriction endonuclease that recognizes the octanucleotide sequence 5′ GGCCGGCC 3′», Janise Meyertons Nelson+, Sheila M. Miceli, Mary P. Lechevalier1 and Richard J. Roberts*, (1990)
- «Structure and activity of the mitochondrial intron-encoded endonuclease, I-SceIV», Wernette C. M. Biochem Biophys Res Commun, (1998)
- Yisheng Kang et al., «Systematic Mutagenesis of E.coli K-12 MG1655 ORFs», Yisheng Kang, Tim Durfee, Jeremy D. Glasner, Yu Qiu, David Frisch, Kelly M. Winterberg, and Frederick R. Blattner, (2004)
- «On Spontaneous DNA Damage in Single Living Cells», Jeanine M. Pennington, Ph.D. thesis, Baylor College of Medicine, Houston (2006):
- «A switch from high-fidelity to error-prone DNA double-strand break repair underlies stress-induced mutation», Rebecca G. Ponder, Natalie C. Fonville, Susan M. Rosenberg, (2005)
- «Universal Code Equivalent of a Yeast Mitochondrial lntron Reading Frame Is Expressed into E. coli as a Specific Double Strand Endonuclease», L. Colleaux, L. d'Auriol, M. Betermier, G. Cottarel, A. Jacquier, F. Galibert†, B. Dujon, (1986)
- «Tightly regulated vectors for the cloning and expression of toxic genes», Larry C. Anthony*, Hideki Suzuki, Marcin Filutowicz, (2004)
- «In Vivo Induction Kinetics of the Arabinose Promoters in Escherichia coli» , Casonya M. Johnson And Robert F. Schleif*, (1995)
- «Toxic protein expression in Escherichia coli using a rhamnose-based tightly regulated and tunable promoter system» Matthew J. Giacalone1, Angela M. Gentile2, Brian T. Lovitt2, Neil L. Berkley2, Carl W. Gunderson1, and Mark W. Surber, (2006)
- «DNA-Dependent Renaturation of an insoluble DNA binding Protein. Identification of the RhaS Binding Site at rhaBAD» Susan M.Egan and Robert F. Schleif, (1994)
- «Optimization of an E. coli L-rhamnose-inducible expression vector: test of various genetic module combinations» Angelika Wegerer, Tianqi Sun and Josef Altenbuchner, (2008)
 "
"


 Overview
 Delay system
 Semantic containment
 Restriction enzyme system
 MAGE
MAGE Encapsulation
 Synthetic import domain
 Safety Questions
 Safety Assessment
