Team:LMU-Munich/Data/Inducible
From 2012.igem.org
| Line 26: | Line 26: | ||
|} | |} | ||
| - | <p align="justify">All clones show a normal growth behaviour up to a bacitracin concentration of 10 μg/ml. At higher bacitracin concentrations, the growth curves decrease because of cell lyses. The promoter P<sub>''liaI''</sub> shows a basal activity of about 10.000 Lumi/OD<sub>600</sub>. After induction with bacitracin the Lumi/OD<sub>600</sub> increases in a concentration depending manner. The highest activity of about 1.5 Mio Lumi/OD<sub>600</sub> can be measured after induction with 10-30 μg/ml bacitracin. If the concentration is higher than 100 μg/ml the luminescence of both clones shows a different behaviour. In | + | <p align="justify">All clones show a normal growth behaviour up to a bacitracin concentration of 10 μg/ml. At higher bacitracin concentrations, the growth curves decrease because of cell lyses. The promoter P<sub>''liaI''</sub> shows a basal activity of about 10.000 Lumi/OD<sub>600</sub>. After induction with bacitracin the Lumi/OD<sub>600</sub> increases in a concentration depending manner. The highest activity of about 1.5 Mio Lumi/OD<sub>600</sub> can be measured after induction with 10-30 μg/ml bacitracin. If the concentration is higher than 100 μg/ml the luminescence of both clones shows a different behaviour. In contrast, the constitutive promoter P<sub>''liaG''</sub> shows a constant value of about 10,000 Lumi/<sub>OD</sub> independent of the bacitracin concentration (data not shown).</p> |
<br> | <br> | ||
<br> | <br> | ||
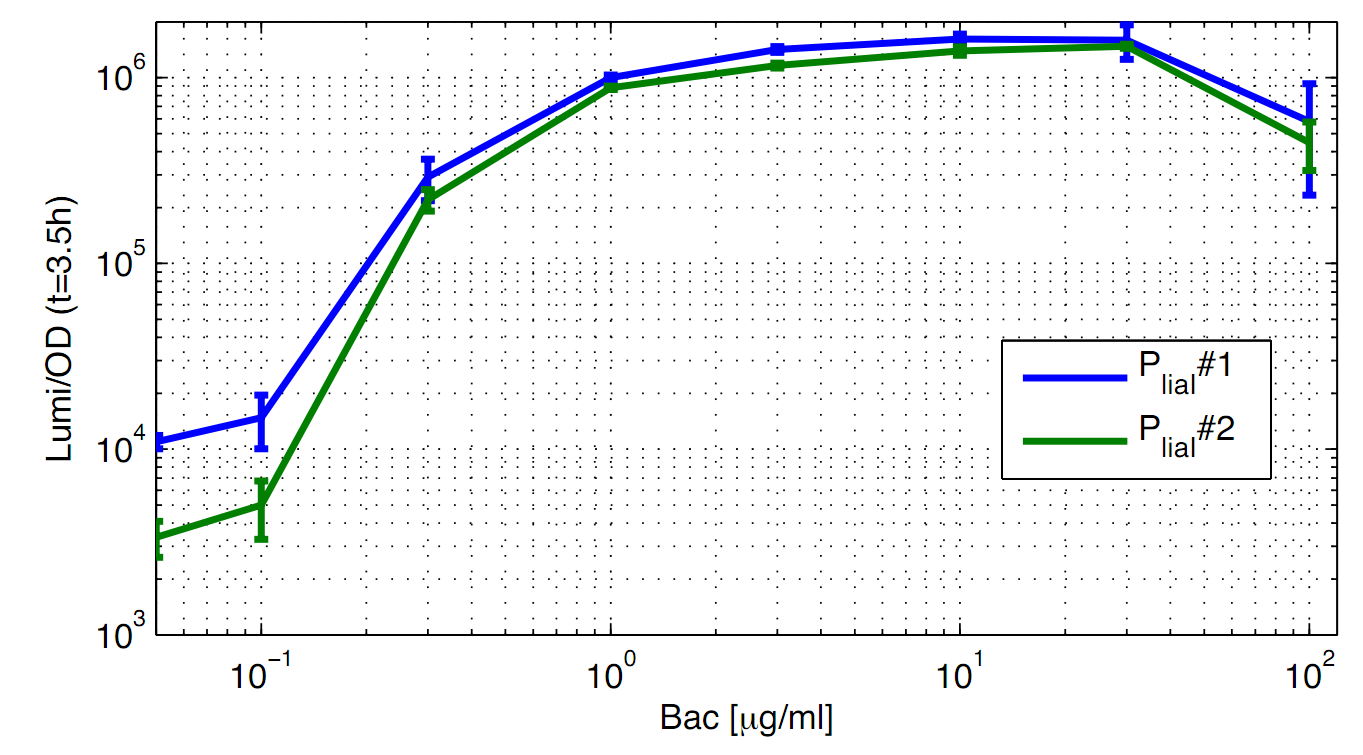
| - | <p align="justify">To better illustrate the P<sub>''liaI''</sub> activity as a function of the bacitracin concentration, data from one timepoint | + | <p align="justify">To better illustrate the P<sub>''liaI''</sub> activity as a function of the bacitracin concentration, data from one timepoint (t=3.5h) of the experiment (Fig. 1) is plotted against the bacitracin concentration ('''Fig. 2''').</p> |
{| style="color:black;" cellpadding="3" width="70%" cellspacing="0" border="0" align="center" style="text-align:left;" | {| style="color:black;" cellpadding="3" width="70%" cellspacing="0" border="0" align="center" style="text-align:left;" | ||
| style="width: 70%;background-color: #EBFCE4;" | | | style="width: 70%;background-color: #EBFCE4;" | | ||
| Line 38: | Line 38: | ||
{| style="color:black;" cellpadding="0" width="100%" cellspacing="0" border="0" align="center" style="text-align:center;" | {| style="color:black;" cellpadding="0" width="100%" cellspacing="0" border="0" align="center" style="text-align:center;" | ||
|style="width: 70%;background-color: #EBFCE4;" | | |style="width: 70%;background-color: #EBFCE4;" | | ||
| - | <font color="#000000"; size="2"><p align="justify">'''Fig. 2: Promoter activity of P<sub>''liaI''</sub> depending on the bacitracin concentration (0,1 μg/ml to 100 μg/ml).''' Values of the experiment (Fig. 1) are shown in a different way: Luminescence per OD<sub>600</sub> of both clones (blue/green) from the time point t=3.5h. Data | + | <font color="#000000"; size="2"><p align="justify">'''Fig. 2: Promoter activity of P<sub>''liaI''</sub> depending on the bacitracin concentration (0,1 μg/ml to 100 μg/ml).''' Values of the experiment (Fig. 1) are shown in a different way: Luminescence per OD<sub>600</sub> of both clones (blue/green) from the time point t=3.5h. Data is derived from three independent experiments.</p></font> |
|} | |} | ||
|} | |} | ||
| Line 44: | Line 44: | ||
<br> | <br> | ||
<br> | <br> | ||
| - | ===β-galactosidase | + | ===β-galactosidase assays=== |
<br> | <br> | ||
<p align="justify"> | <p align="justify"> | ||
| Line 63: | Line 63: | ||
<p align="justify"> | <p align="justify"> | ||
| - | + | The β-galactosidase assay of the inducible ''Bacillus'' promoter P<sub>''liaI''</sub> was repeated three times. We induced with bacitracin (20μg/ml) when the cultures reached an OD<sub>600</sub> of 0.4. P<sub>''liaI''</sub> only shows marginal basal activity without induction. After induction a promoter activity of up to 500 Miller Units was measured. In summary, the promoter activity is induced about 500 fold in the presence of bacitracin. | |
</p> | </p> | ||
Revision as of 21:13, 26 September 2012
The LMU-Munich team is exuberantly happy about the great success at the World Championship Jamboree in Boston. Our project Beadzillus finished 4th and won the prize for the "Best Wiki" (with Slovenia) and "Best New Application Project".
[ more news ]

Inducible Bacillus Promoters
Luminescence measurements
The bacitracin-inducible promoter PliaI was evaluated in the reporter vector pSBBs3C-luxABCDE which contains the lux operon ![]() . The promoter activity leads to gene expression and to the production of the protein luciferase. The luminescence produced by this protein can be measured with the plate reader Synergy2 (Biotek) (Fig.1).
. The promoter activity leads to gene expression and to the production of the protein luciferase. The luminescence produced by this protein can be measured with the plate reader Synergy2 (Biotek) (Fig.1).
All clones show a normal growth behaviour up to a bacitracin concentration of 10 μg/ml. At higher bacitracin concentrations, the growth curves decrease because of cell lyses. The promoter PliaI shows a basal activity of about 10.000 Lumi/OD600. After induction with bacitracin the Lumi/OD600 increases in a concentration depending manner. The highest activity of about 1.5 Mio Lumi/OD600 can be measured after induction with 10-30 μg/ml bacitracin. If the concentration is higher than 100 μg/ml the luminescence of both clones shows a different behaviour. In contrast, the constitutive promoter PliaG shows a constant value of about 10,000 Lumi/OD independent of the bacitracin concentration (data not shown).
To better illustrate the PliaI activity as a function of the bacitracin concentration, data from one timepoint (t=3.5h) of the experiment (Fig. 1) is plotted against the bacitracin concentration (Fig. 2).
|
β-galactosidase assays
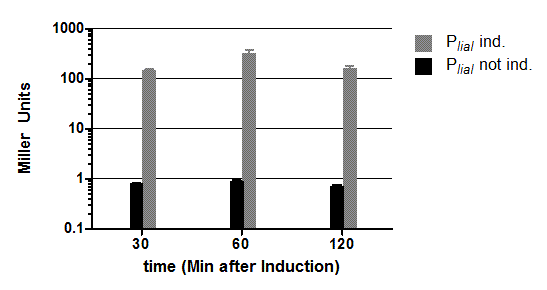
The inducible promoter PliaI was also evaluated with the reporter vector pSBBs1C-lacZ ![]() . (Fig.3).
. (Fig.3).
|
The β-galactosidase assay of the inducible Bacillus promoter PliaI was repeated three times. We induced with bacitracin (20μg/ml) when the cultures reached an OD600 of 0.4. PliaI only shows marginal basal activity without induction. After induction a promoter activity of up to 500 Miller Units was measured. In summary, the promoter activity is induced about 500 fold in the presence of bacitracin.
 "
"


