Team:Amsterdam/achievements/stochastic model
From 2012.igem.org
(Difference between revisions)
(→Cell growth rate) |
|||
| Line 51: | Line 51: | ||
==ODE Model definition== | ==ODE Model definition== | ||
| + | <table align="right"> | ||
| + | <tr><th>Parameter</th><th>Value</th></tr> | ||
| + | <tr><td>Ca</td> <td>$200\ \text{or}\ 40$</td> | ||
| + | <tr> | ||
| + | <td>ksFP</td> <td>$30$</td> | ||
| + | </tr> | ||
| + | <tr> | ||
| + | <td>lMFP</td> <td>$0.462$</td> | ||
| + | </tr> | ||
| + | <tr> | ||
| + | <td>lFP</td> <td>$0.2$</td> | ||
| + | </tr> | ||
| + | <tr> | ||
| + | <td>kPlas</td> <td>$0.00866434 \cdot Ca$</td> | ||
| + | </tr> | ||
| + | <tr> | ||
| + | <td> lPlas </td> <td> $0.00866434$ </td> | ||
| + | </tr> | ||
| + | <tr> | ||
| + | <td colspan="2" align="center">Parameter values used to <br>plot the ODE-system</td> | ||
| + | </tr> | ||
| + | </table> | ||
| + | |||
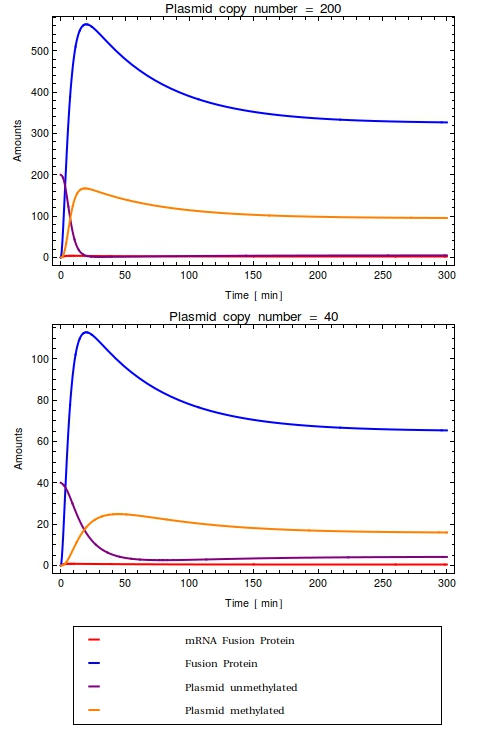
[[File:Combinedode.png|thumb|right|300px|Time trajectories of ODE-model in which the construct has been inserted in a high copy number plasmid (top, $Ca = 200$) and a low copy number plasmid (bottom, $Ca = 40$). All initial species values are set to $0$, except for the intial value of unmethylated plasmids which is equal to $Ca$. With these parameters, the dynamic range of the system is completely taken up by the background noise. No qualitative difference is observed between the high and low copy number cases]] | [[File:Combinedode.png|thumb|right|300px|Time trajectories of ODE-model in which the construct has been inserted in a high copy number plasmid (top, $Ca = 200$) and a low copy number plasmid (bottom, $Ca = 40$). All initial species values are set to $0$, except for the intial value of unmethylated plasmids which is equal to $Ca$. With these parameters, the dynamic range of the system is completely taken up by the background noise. No qualitative difference is observed between the high and low copy number cases]] | ||
| Line 101: | Line 124: | ||
Our own experiments showed that the bacterial strain <math>DH5\alpha</math> transformed with two of our preliminary constructs had growth rates (<math>\mu</math>) between $80\ min^{-1}$ and $90\ min^{-1}$ ([Team:Amsterdam/Project/Growth_curves Experimental growth curves]). | Our own experiments showed that the bacterial strain <math>DH5\alpha</math> transformed with two of our preliminary constructs had growth rates (<math>\mu</math>) between $80\ min^{-1}$ and $90\ min^{-1}$ ([Team:Amsterdam/Project/Growth_curves Experimental growth curves]). | ||
In these simulations, cellular division was assumed to be either constant at 80 for single cells models or Gaussian distributed with $\mu = 80$ and $\sigma = 2$ in the cell division model. | In these simulations, cellular division was assumed to be either constant at 80 for single cells models or Gaussian distributed with $\mu = 80$ and $\sigma = 2$ in the cell division model. | ||
| - | |||
| - | |||
| - | |||
| - | |||
| - | |||
| - | |||
| - | |||
| - | |||
| - | |||
| - | |||
| - | |||
| - | |||
| - | |||
| - | |||
| - | |||
| - | |||
| - | |||
| - | |||
| - | |||
| - | |||
| - | |||
| - | |||
| - | |||
Looking at the plots for both the high and the low copy number plasmids, no qualitative difference is observable. All species in the system simply reach a steady state defined as the fraction between their production and degradation rates. | Looking at the plots for both the high and the low copy number plasmids, no qualitative difference is observable. All species in the system simply reach a steady state defined as the fraction between their production and degradation rates. | ||
Revision as of 20:49, 26 September 2012
 "
"


