Team:Amsterdam/modeling/odemodel
From 2012.igem.org
(Difference between revisions)
(→In practice) |
(→Model definition) |
||
| Line 58: | Line 58: | ||
$$ | $$ | ||
| - | < | + | <div align="left"> |
<b>Table 1</b>: Parameter values for the plasmid methylation model<br> | <b>Table 1</b>: Parameter values for the plasmid methylation model<br> | ||
<table> | <table> | ||
| Line 82: | Line 82: | ||
</tr> | </tr> | ||
</table> | </table> | ||
| + | </div> | ||
| + | <div align="right"> | ||
<b>Table 2</b>: Initial species values for the plasmid methylation model<br> | <b>Table 2</b>: Initial species values for the plasmid methylation model<br> | ||
<table> | <table> | ||
| - | < | + | <th> |
<td align="left"><b>Species</b></td> | <td align="left"><b>Species</b></td> | ||
<td align="right"><b>Value</b></td> | <td align="right"><b>Value</b></td> | ||
| - | </ | + | </th> |
<tr class="even"> | <tr class="even"> | ||
<td align="left"><math>P_{0}(0)</math></td> | <td align="left"><math>P_{0}(0)</math></td> | ||
| Line 98: | Line 100: | ||
</tr> | </tr> | ||
</table> | </table> | ||
| - | </ | + | </div> |
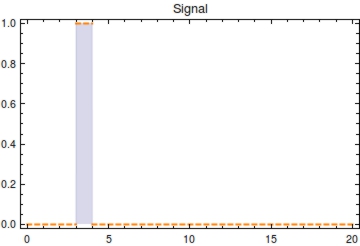
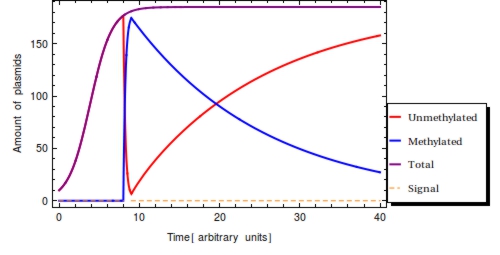
Using the parameter values of Table 1 a simulation with a duration of 40 time units is shown in Figure 2. The plasmid population within a ''Cellular Logbook'' is shown to be completely converted to methylated plasmids shortly after <math>s_{\text{on}}</math>. As long as the signal is still present – until <math>s_{\text{off}}</math>, – the bit on all newly copied plasmids will be immediately methylated as the signal is still present. After <math>s_{\text{off}}</math>, <math>F(t)</math> will start to decrease. This is mostly due to cell division, during which the cell’s plasmids will be binomially distributed between the two two daughter cells, halving the plasmid amount every division cycle. In this simulation, this degradation due to cell division has been accounted for in the constant degradation rate <math>\alpha</math>. The duration of time after which a small trail of methylated plasmids is still present is related to two factors: positively to the amount of methylated cells at <math>s_{\text{off}}</math> and negatively to the plasmid degradation rate. | Using the parameter values of Table 1 a simulation with a duration of 40 time units is shown in Figure 2. The plasmid population within a ''Cellular Logbook'' is shown to be completely converted to methylated plasmids shortly after <math>s_{\text{on}}</math>. As long as the signal is still present – until <math>s_{\text{off}}</math>, – the bit on all newly copied plasmids will be immediately methylated as the signal is still present. After <math>s_{\text{off}}</math>, <math>F(t)</math> will start to decrease. This is mostly due to cell division, during which the cell’s plasmids will be binomially distributed between the two two daughter cells, halving the plasmid amount every division cycle. In this simulation, this degradation due to cell division has been accounted for in the constant degradation rate <math>\alpha</math>. The duration of time after which a small trail of methylated plasmids is still present is related to two factors: positively to the amount of methylated cells at <math>s_{\text{off}}</math> and negatively to the plasmid degradation rate. | ||
Revision as of 12:02, 23 September 2012
 "
"


