Team:TU Darmstadt/Modeling IT
From 2012.igem.org
(→Results) |
(→Method) |
||
| Line 75: | Line 75: | ||
===Method=== | ===Method=== | ||
| - | + | Due to the the information theoretical analysis we are able to optimize our enzymes. Nevertheless, we have to create sequence alignments with an satisfying size. We obtained our sequences from the National Center of Biotechnological Information database (NCBI) using the Basic Local Alignment Search Tool (BLAST). Hence we used an e-value cut-off of 10^5. Since we collected the sequences we used clustalo for the alignment creation. | |
| - | + | The entropy and MI calculations were performed with R using the BioPhysConnectoR library. | |
| - | The entropy and MI calculations were performed with R using the BioPhysConnectoR library. | + | |
===Results=== | ===Results=== | ||
Revision as of 18:52, 18 September 2012
| Homology Modeling | | Gaussian Networks | | Molecular Dynamics | | Information Theory | | Docking Simulation |
|---|
Contents |
Information Theoretical Analysis
Information Theory
Entropy
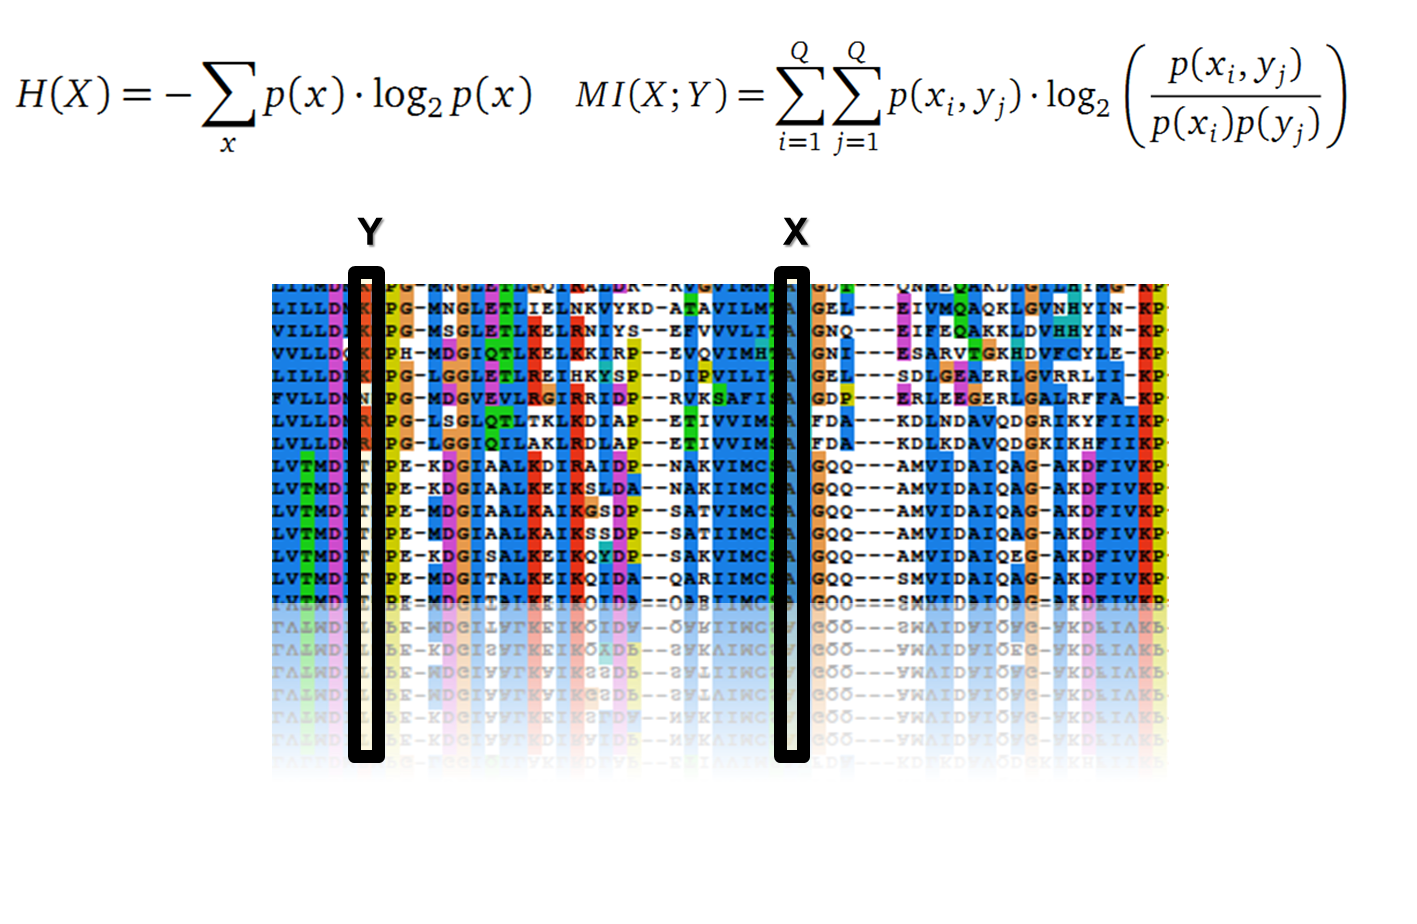
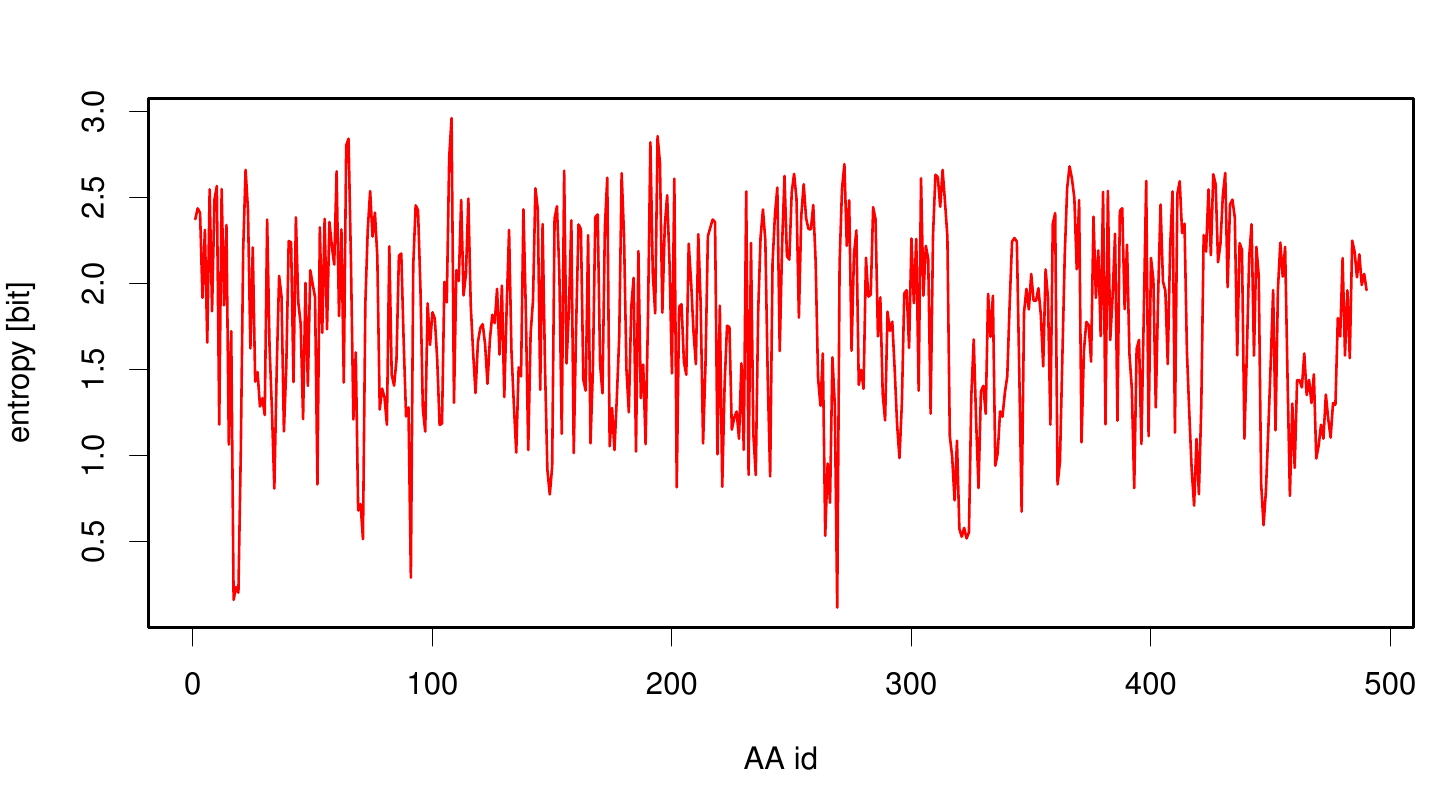
Claude Shannon created a new measurement approach of uncertainty of a random variable X. This measurement is called Shannon’s entropy H [1] which is measured in bit, if a logarithm to the base 2 is used. p(x) denotes the probability mass function of a random variable X.
Mutual Information
In information theory, Mutual information (MI) is a correlations measure of two random variables X and Y . H(X) and H(Y ) are the Shannon entropy values of the random variables X and Y. H(X, Y ) is the two-point entropy. Moreover , the MI quanti?es the amount of information of variable X by knowing Y and vice versa.
Application of MI to sequence Alignments
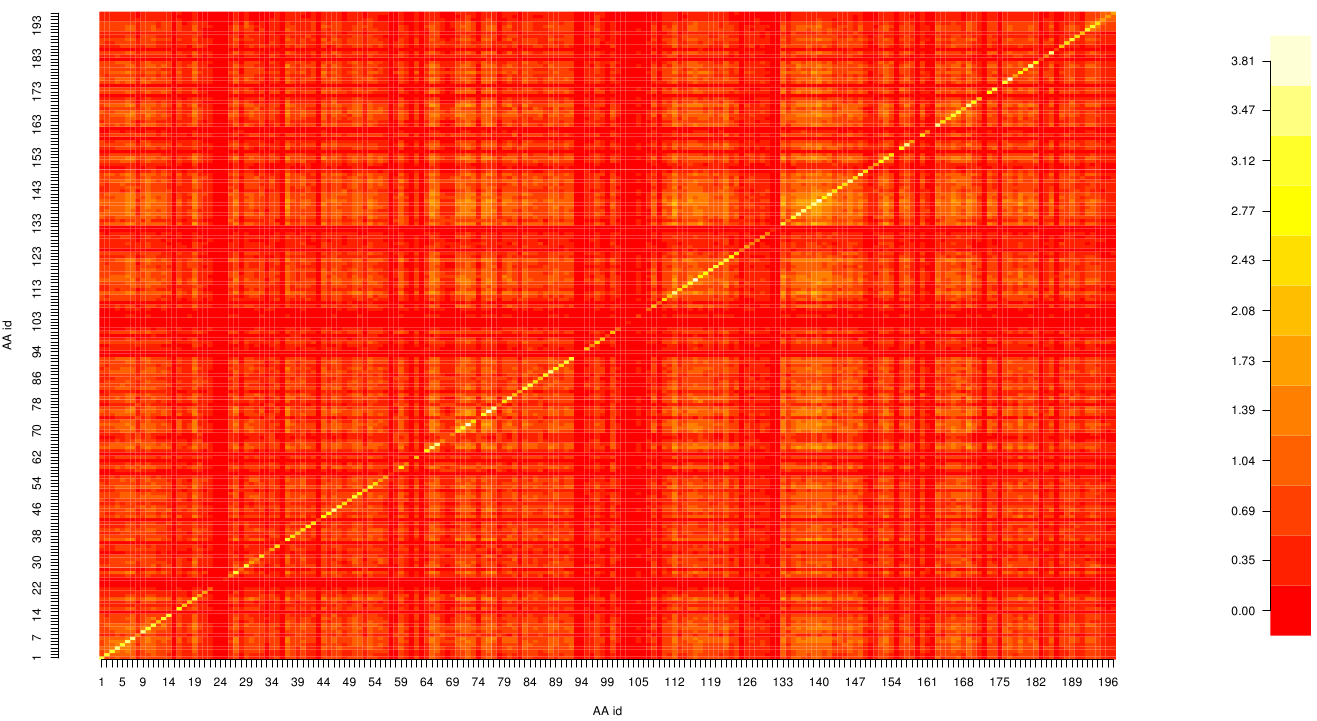
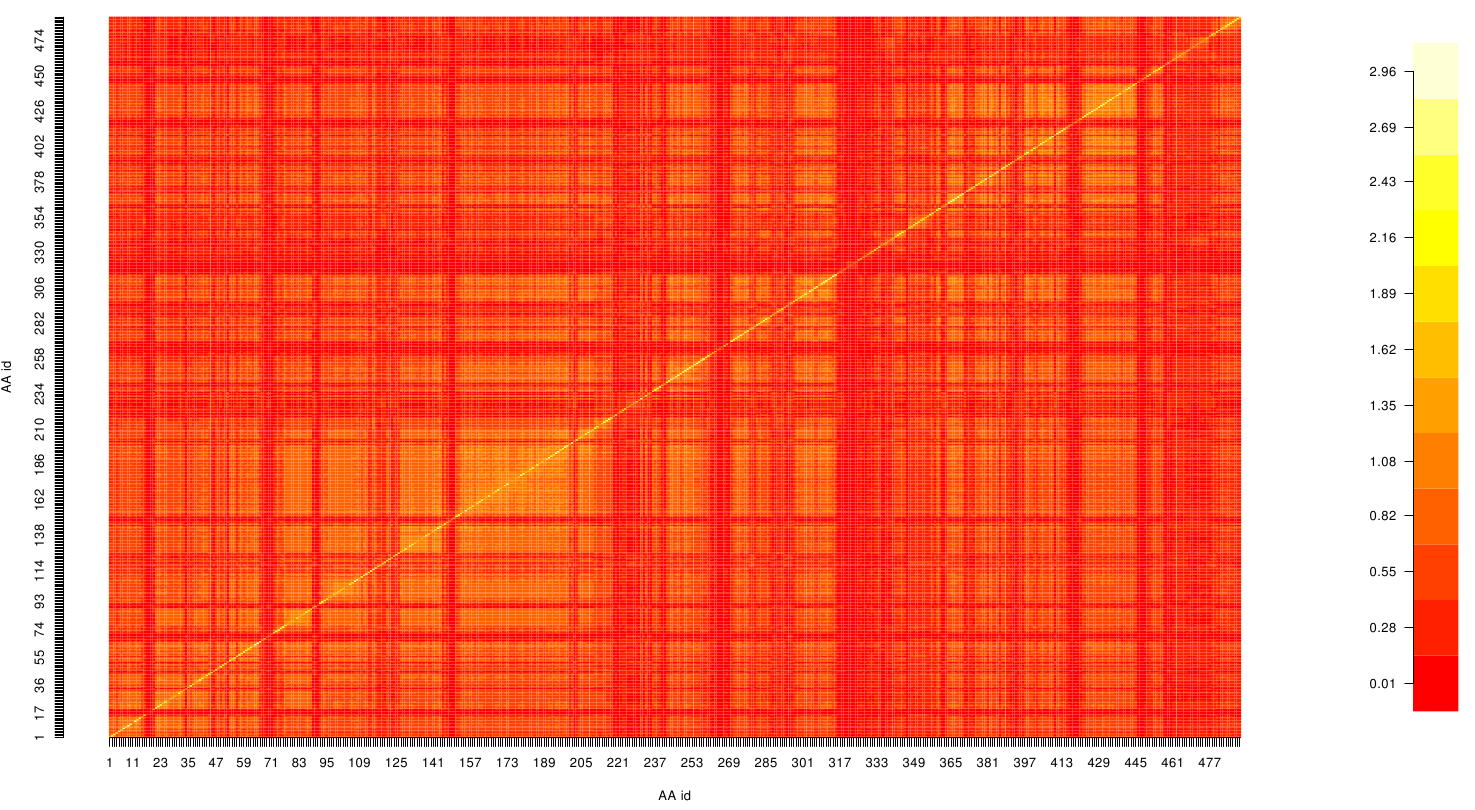
It is well known that the MI can be used to measure co-evolution signals in multiple sequence alignments (MSA)[2] [3] . An MSA serves as a comparison of three or more sequences used to investigate the functional or evolutionary homology of amino acid or nucleotide sequences. The MI of an MSA can be computed with the following equation derived from the Kullback-Leibler-Divergence (DKL):
with p(x) and p( y) being the frequency counts of symbols in column X and Y of the MSA. The joint frequency describe the occurrence for the amino acids xi and yj(p(x, y)) and Q is the set of Symbols derived from the corresponding alphabet (DNA or Protein). The result of these calculations is a symmetric matrix M which includes all combined MI values for any two columns in an MSA. A dependency of two columns acids shows high MI values.
Normalisation
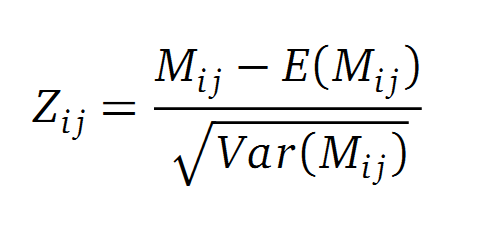
A standard score (Z-score) indicates how many standard deviations a value differs from the mean of a normal distribution. MI dependent Z-scores can be calculated with a shuffle-null model, where the symbols in MSA column are shuffled and every dependencies of the column pairs are eliminated. The expectation value for the shuffle-null model is described by E(Mi j) and its corresponding variance by Var(Mi j) [4].
Method
Due to the the information theoretical analysis we are able to optimize our enzymes. Nevertheless, we have to create sequence alignments with an satisfying size. We obtained our sequences from the National Center of Biotechnological Information database (NCBI) using the Basic Local Alignment Search Tool (BLAST). Hence we used an e-value cut-off of 10^5. Since we collected the sequences we used clustalo for the alignment creation. The entropy and MI calculations were performed with R using the BioPhysConnectoR library.
Results
Fs. Cutinase
 "
"


