 "
"

1) The M9 agar plates were inoculated with C.freundii SBS 197, C.freundii NCIMB, E.coli J109, E.coli + sucrose hydrolase. The plates were left o/n 37ºC.
2) LB plates with 200 µl carbinicillin were prepared:
2* 50 µl MTZ (out of 50 mg/ml stock) 100 µg/ml+ 25 µg/ml IPTG
2*45 µl MTZ (out of 50 mg/ml stock) 90 µg/ml+ 25 µg/ml IPTG
5 µl NFT (out of 5 mg/ml stock) 1 µg/ml +25 µg/ml IPTG
1 µl NFT (out of 5 mg/ml stock) 0.2 µg/ml +25 µg/ml IPTG
50 µl DNBA (out of 50 mg/ml stock) 100 µg/ml +25 µg/ml IPTG
75 µl DNBA (out of 50 mg/ml stock) 150 µg/ml +25 µg/ml IPTG
Control +25 µg/ml IPTG
Control – IPTG
The MTZ plates were streaked with either BS control or BS nitred. All other plates were streaked with the four nitroreductase strains.
Protein assay of cytochrome expression cell extracts
Protein assay was performed for 4 samples of cytochrome expression cell extracts ( protocol). Results:
Anaerobic culture with nitrate: 0,094 mg protein/ml
Aerobic culture with nitrate: 0,113 mg protein/ml
Anaerobic culture with TMAO: 0,134 mg protein/ml
Aerobic culture with TMAO: 0,725 mg protein/ml
minipreps of ccm plasmids
Minipreps were prepared for ccm plasmids (protocol).
Template:Team:Edinburgh/Notebook/Week04
From 2012.igem.org
Posted on 16/07/2012
Posted on 17/07/2012
1)The M9 agar plates were examined. All strains grew on all plates even the no sugar ones. Posted on 18/07/2012
1)The M9 agar plates were examined. Again, all strains grew on all plates. A fresh batch of M9 agar (without a carbon source) was also prepared and will be inoculated tomorrow.
The M9 agar plates were repeated by inoculating the remaining plates with the 4 strains present on the glucose plates (from 16th July 2012).
2)LB plates were examined:
Both BS control and BS nitred grew ( BS-contol much better) on the MTZ plates.
No difference between the strains was seen in the NFT, DNBA and control plates.
3)LB plates were prepared (200 µl carbinicillin)
2* 100 µg/ml MTZ + 25 µg/ml IPTG+80 µg/ml Xgal
110 µg/ml MTZ + 25 µg/ml IPTG+ 80 µg/ml Xgal
2* 120 µg/ml MTZ + 25 µg/ml IPTG+ 80 µg/ml Xgal
2* 130 µg/ml MTZ + 25 µg/ml IPTG+ 80 µg/ml Xgal
2* control + 25 µg/ml IPTG + 80 µg/ml Xgal
0.5 µg/ml NFT + 25 µg/ml IPTG+ 40 µg/ml Xgal
1 µg/ml NFT + 25 µg/ml IPTG+ 40 µg/ml Xgal
100 µg/ml DNBA + 25 µg/ml IPTG+ 40 µg/ml Xgal
150 µg/ml DNBA + 25 µg/ml IPTG+ 40 µg/ml Xgal
200 µg/ml DNBA + 25 µg/ml IPTG+ 40 µg/ml Xgal
4)Liquid cultures of BS-control, BS-nitred, nitred-6 and CFX-nitred were prepared.
Carbinicillin (5 µl) was added to LB (5 ml) and the bottles were inoculated with the four strains. These were left o/n at 37ºC with agitation.
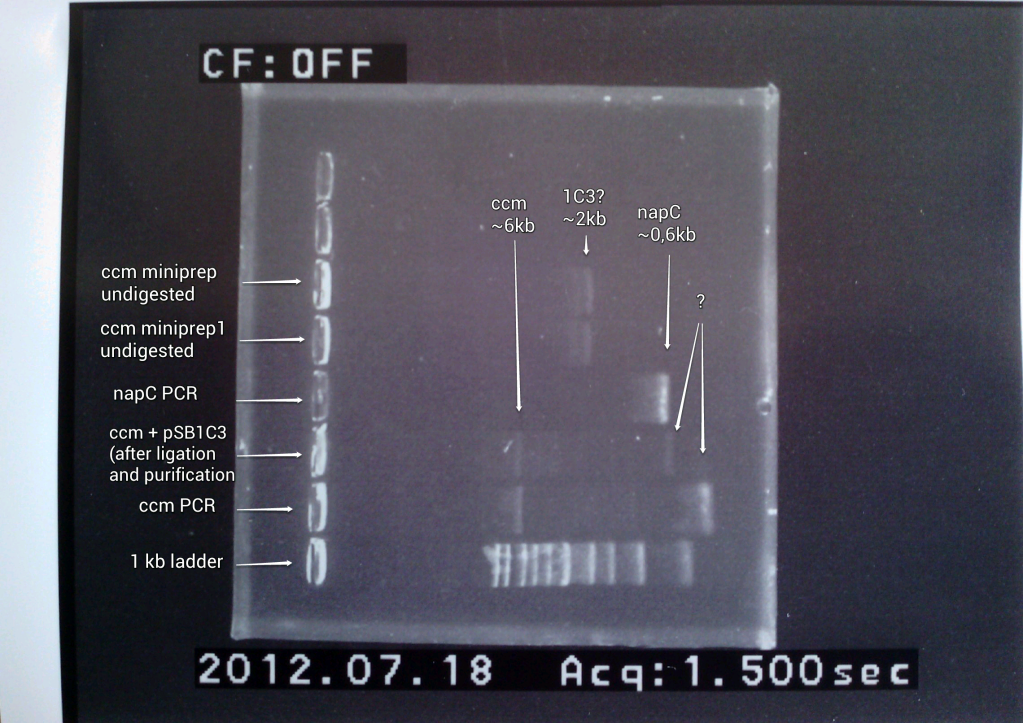
Ccm miniprep analysis
ccm minipreprs were digested with EcoRI ( protocol )
Following the digestion, samples were analysed by gel electrophoresis (
2)The OD600 of the 4 nitroreductase liquid cultures was measured with LB blank:
BS-nitred: 1.246
BS-control: 1.305
Nitred-6: 1.765
CFX-nitred: 1.294
The MTZ plates and controls were spread with BS-nitred (105 µl) or BS-control (100 µl) liquid culture.
The DNBA/NFT plates were streaked with BS-nitred (26 µl), BS-control (24 µl), nitred-6 (18 µl) and CFX-nitred (25 µl) liquid culture.
The plates were left o/n at 37ºC
3) Lac promoter characterization – results
Three different sets of E. coli and Cf were grown overnight in LB, their OD was measured in order to normalize the number of cells and the normalized dilutions were used to inoculate 2.5ml M9 media that contained either no IPTG or 1, 2, 3, 4 or 5 μl IPTG. These bottles were then incubated at 37C for 24 hours.
The fluorescence of the cultures was measured just after inoculation and it was fairly even within the two species, averaging 1669.88 FSU for E. coli and 1235.91 FSU for E. coli.
Their fluorescence and OD was again measured after 24 hours in order to quantify RFP expression. These readings were normalized by dividing the fluorescence with the OD and the averages of the three sets were calculated. The graphs showing these averages can be seen below.


The peaks that can be seen in Cf at 2 and 4 μl IPTG are due very high fluorescence readings in one of the sets, which have skewed these averages somewhat.
These results do, however, show that there is a significant difference in RFP expression in E. coli with and without IPTG, while no significant difference in the levels of RFP expression is observable in Cf. This suggests that E. coli has got a native LacI gene that represses the Lac promoter on the plasmid, while Cf lacks a native LacI gene, which results in the RFP gene being constitutively expressed.
4) Gel analysis of ccm minipreps
1) ccm PCR product re-digestion
PCR product for ccm was digested with EcoRI and PstI using buffer 4 and buffer EcoRI, following the digestion samples were ligated overnight in 16 C waterbath.
2) Glycerol stock preparation
Glycerol stocks were made of E. coli JM109 and Cf NCIMB and SBS197 strains by mixing 700 μl of culture with 300 μl 50% glycerol. They are stored in the -80C freezer.
1) Gel analysis of ligation sample
2) Multi-host vector characterization in Cf – results II
The Cf + ptg262 plasmid grew on all plates to some extent whereas the no plasmid control grew only below 8 μl chloramphenicol and there were fewer colonies on the plates compared to the Cf + ptg262. This suggests that the plasmid must work, but very weakly.