 "
"
Team:ZJU-China/project.htm
From 2012.igem.org
| Line 620: | Line 620: | ||
<p align="justify"> </p> | <p align="justify"> </p> | ||
<img src="https://static.igem.org/mediawiki/igem.org/d/df/Riboscaffold_fig_13.jpg" width="700px" /> | <img src="https://static.igem.org/mediawiki/igem.org/d/df/Riboscaffold_fig_13.jpg" width="700px" /> | ||
| - | <p align="justify">Fig.13 Synergy Hybrid | + | <p align="justify">Fig.13 Biotek Synergy H1 Hybrid Reader controlled experiments. The BL21*DE3 of the E. coli were transformed with figure showing plasmids. (0.5 mM theophylline was adding in strains containing clover 2). </p> |
<p align="justify">`luminescence \quad efficiency \quad of \quad clover 2=\frac{\frac{FI}{OD(FA+FB+clover 2)}-\frac{FI}{OD(FA+FB)}}{\frac{FI}{OD(FA+FB)}}=\frac{53425-23779}{23779}=125\%`</p> | <p align="justify">`luminescence \quad efficiency \quad of \quad clover 2=\frac{\frac{FI}{OD(FA+FB+clover 2)}-\frac{FI}{OD(FA+FB)}}{\frac{FI}{OD(FA+FB)}}=\frac{53425-23779}{23779}=125\%`</p> | ||
<p align="justify"> </p> | <p align="justify"> </p> | ||
| Line 634: | Line 634: | ||
<p align="justify">Theophylline concentration beyond certain extent will be hazardous to cells and how it affects cells depends on strain type. The study by NYMU Taipei 2010 alerted adding more than 4mM of Theophylline would cause E. coli to die. In our experiments, we find that after adding more than 0.5mM, the Theophylline spectrum curve would be invalid. As a result, we pick up data with concentrations below 0.5mM to analyze as the E. coli cell would be unstable or the regulation of the Theophylline aptamer would not be accurate. </p> | <p align="justify">Theophylline concentration beyond certain extent will be hazardous to cells and how it affects cells depends on strain type. The study by NYMU Taipei 2010 alerted adding more than 4mM of Theophylline would cause E. coli to die. In our experiments, we find that after adding more than 0.5mM, the Theophylline spectrum curve would be invalid. As a result, we pick up data with concentrations below 0.5mM to analyze as the E. coli cell would be unstable or the regulation of the Theophylline aptamer would not be accurate. </p> | ||
| - | <img src="https://static.igem.org/mediawiki/igem.org/ | + | <img src="https://static.igem.org/mediawiki/igem.org/2/20/Screen_Shot_2012-09-26_at_%E4%B8%8B%E5%8D%885.27.52.png" width="700px" /> |
<p align="justify">Fig.14 origin data of clover 2 regulatory tests. First line of each form is different treatments of Theophylline concentration and data in table cells are fluorescence intensity/ OD.</p> | <p align="justify">Fig.14 origin data of clover 2 regulatory tests. First line of each form is different treatments of Theophylline concentration and data in table cells are fluorescence intensity/ OD.</p> | ||
Revision as of 17:45, 26 September 2012


01 ABSTRACT
In cells, engineered multi-enzyme pathways are common and are often physically and spatially organized, thus leading to the high output efficiency. But engineered synthetic pathways utilizing non-homologous enzymes often suffer from low efficiency of production caused by relative lack of spatial organization. RNA scaffold is designed to co-localize enzymes through interactions between binding domains on the scaffold and target peptides fused to each enzyme in engineered biological pathways in vivo. The scaffold allows efficient channeling of substrates to products over several enzymatic steps by limiting the diffusion of intermediates thus providing a bright future for solving the problem.
ZJU-China aims to design and realize tunable RNA scaffolds to accelerate biological pathways and control them on and off. In order to achieve the object, we added an aptamer structure on RNA scaffold as a switch to regulate biological pathways by micromolecular ligands. Then we can control the all-or-none binding relationship between the enzymes and the scaffold by the absence and the presence of a special ligand.
We demonstrated RNA scaffold do make the split GFPs get closer and fluoresce. As was expected, the riboscaffold with a theophylline aptamer can be regulated by theophylline in the range of 0-0.5mM IPTG. A scaffold library was also desired. By changing the sequence of MS2 aptamer binding site, we made the fluorescent decreased. The mutations with different arm length decrease the fluorescent intensity of split GPF by extending the distance between two split GFP parts FA and FB. It provides a series of half-on scaffolds.
Besides, we aimed to find some application for RNA scaffold to make the production of the multi-enzyme pathways more efficient. We have been working on the pathway of the production of IAA from tryptophan and the result will be gained soon later.
02 BACKGROUND
In cells, engineered multi-enzyme pathways are common and are often physically and spatially organized, thus leading to the high output efficiency. But engineered synthetic pathways utilizing non-homologous enzymes often suffer from low efficienty of production caused by relative lack of spatial organization. Thus important issue lies in the method to increase the efficiency of the multi-enzyme pathways.
Protein scaffolds can be designed to make enzymes closed through interactions between binding domains on the scaffold and target peptides fused to each enzyme. However, protein scaffold is usually large, has limit binding sites, and is hard to be engineered in architecture. DNA can be designed to self-assemble in vitro into many and varied nanostructures. However, DNA scaffold is hard to be controlled and might cause some potential problems in vivo. By contrast, RNA scaffold shows great advantages. For instance, RNA is more flexible, whose structures are varied, thus leading to their ease to splice. RNA scaffold is able to be controlled and has a satisfactory regulating efficiency. RNA scaffold works fast, because it doesn’t need translation like protein scaffold. Camille J. Delebecque and his colleagues have designed and assembled RNA structures and used them to speed up the reaction of hydrogen production. And that is what our project based on.

Fig.1 The function of binding enzymes together of RNA scaffold illustrated by comic. The yellow girl is called “Syn”, the blue boy “Bio”. They represent non-homologous enzymes utilized in engineered synthetic pathways. Usually, they are far away from each other in E.coli, due to lack of spatial organization. But when RNA scaffold designed comes into E.coli, enzymes can be co-localized through interaction between binding domains on scaffold and target peptides fused each enzymes. That is to say, Syn and Bio can live together!
03 S0: BASIC RNA SCAFFOLD
Backround
Camille J. Delebecque and his colleagues have designed and assembled RNA structures and used them as scaffolds for the spatial organization of bacterial metabolism (Fig.1). Scaffold D0 consists of PP7 and MS2 aptamer domains that bind PP7 and MS2 fusion proteins. As told above, our project is based on the existing scaffold D0. In order to make sure that we can do further work on it, we planned to repeat the work about scaffold D0.
Design

Fig.1 How RNA scaffold works. FA and FB represent two halves of EGFP. FA and MS2 are connected with a linker of 30bp. FB and PP7 did the same. The purple scaffold is scaffold D0. MS2 and PP7 can specifically bind to two stem-loops on scaffold, thus FA and FB get closer and fluoresce under excitation of 480nm.
Materials and Methods
1. Plasmids and Strains
pCJDFA and pCJDFB respectively comprising the gene of half split EGFP (fragment A and fragment B) and MS2 or PP7 protein were constructed by overlap extension PCR. (See the Overlap PCR protocal) Genes MS2, PP7 and pCJDD0 are provided by Dr. Camille J. Delebecque. pEGFP is provided by Prof. Jianzhong Shao.
Information of pCJDFA, pCJDFB and pCJDD0 are as the followings:
1). pCJDFA: FA-MS2 cloned into T7 duet expression vectors pACYCDuet-1 Spr

2) pCJDFB (FB-PP7 cloned into T7 duet expression vector pCOLADuet-1) Kanr

3) pCJDD0 (Scaffold D0 cloned into T7 duet expression vector PETDuet) Ampr
4) BL21-star(DE3)
cells were used to co-express plasmids. The most important feature of BL21-star(DE3) is that it carries a mutated rne gene (rne131) which encodes a truncated RNase E enzyme that lacks the ability to degrade mRNA, resulting in an increase in mRNA stability.
2. Transformation and induction
Three groups of transformation were conducted. The first is BL21-star(DE3) transformed only with pCJDD0, the second with pCJDFA+pCJDFB, and the third with pCJDFA+pCJDFB+pCJDD0.
Pick the single colony to cultivate in 3mL liquid LB with relative resistances. And when OD reached 0.4, induce with 0.2mM IPTG for 2h at 25 degree.
Wash the bacteria twice with equivalent PBS. Then test the Fluorescence intensity (FI) and OD with Biotek Synergy Hybrid Reader.
Data was shown in Fig.3. The fluorescence of different expression systems are pictured by Olympus fluoview fv1000 confocal laser scanning microscope ( Fig.2)
They were transformed with the pCJDD0 (plasmid with scaffold D0) into BL21-star-(DE3).
04 S1: RIBOSCAFFOLD
05 S2: SCAFFOLD LIBRARY
Several mutations of RNA scaffold D0 have been designed and made. They show quite different characterizes and functions. With the experiment, more RNA scaffold mutations are characterized. Concept Library of RNA Scaffold is suggested.
What is the Library of RNA Scaffold for? Evolution! The variable of RNA structures accommodates a wide application prospect. Though the point mutation reduced uncertainty of selection and the blindness, trying to find a suitable construction is vast project. Various experimental methods, selection and modeling should be used in this part. By analyzing existing mutations, derivation can be made to construct and find an enhanced RNA scaffold. We called this process evolution.
The Library may contain changes of self, self-assemble, RNA-RNA interaction, RNA-protein interaction. Some examples are show below.
1. Mutating arm length: changing the arm length of RNA scaffold D0. As the mechanism of D0 is reducing the distance of two key enzyme of the pathway, in other words, the output and reaction efficiency is depend on the local concentration. The two aptamer binding site in our project is on two hairpin arms witch are designed in the same length. The change of the arm length provides feasibility of distance-efficiency research. We used split GFP experiments. We made some mutations with different arm length, the result of D0M4 and D0M 5 split GFP experiment shows the light decreasing lend by split GFP FA-FB distance. The difference (PD0M4=0.079, PD0M5=0.025) suggests that the mutating arm length scaffold doesn’t provide an on/off switch but a definability one. It characterized the D0 in another way.(fig 1:a. D0 is the original scaffold. D0 a-d were mutated to the scaffold with different aptamer arm length. b. The result of arm length mutating. Both D0M4 and D0M5 scaffold half-on GEP.)
1.1 Mutating aptamer binding site: Mutating the PP7 and MS2 binding sites prevented protein scaffolding. Preventing protein scaffolding lead to the key enzyme dissociation and the decrease of enzyme local concentration. By chancing the sequence of MS2 aptamer binding site, the fluorescent light decreased. D0M3 in our project is the molecular with mutated aptamer binding site. Split GFP experiment shows that there is a significant difference between D0 an D0M3(P≦0.05, fig2.c). Camille J. Delebecque has done the same work for the H2 biosynthesis pathway.(fig2: a. MS2 and PP7 bind to the scaffold and make GFP work. b. By mutating aptamer binding site, scaffolding is stop. c. significant difference between D0 an D0M3 )
1.2 Assemblage: adding extra sequence for self-, RNA-, protein-assemblage. The added sequence may be a riboswitch, RNA or protein binding site, self-assemble structure. Regulation molecular search is also wanted synchronously.
Applications and outlook
1.3 sRNA regulation: Simple an direct RNA-RNA interaction change the object RNA scaffold structure. As a Foundation regulation, it substantially enhances the possibilities of forthcoming experiment. (fig3 The designed scaffold has a interaction to regulatory sRNA. Same mechanism, regulatory molecule can be changed to mRNA a. Turn off the scaffold by the competitive binding with aptamer binding site (green) b. The RNA scaffold has a secondary structural switch controls accessibility of sRNA-binding sites(blue) witch can change the arm length. Output regulated by arm length change. c. both methods were used. d. bind an release the object molecular.)
1.4 Protein expression (mRNA) regulation: RNA scaffold as a free molecular in cell can specific bind mRNA and protein. Binding molecular changes the structure of scaffold to release or combine something. So that oncogene and virogene can be found and controlled by the drug from RNA scaffold. The problem of cancer therapeutic drug side effecting may solved by it.
1.5 Self quenching(Self regulation): Adding self binding site, a balance of “on” and “off” scaffolds is built. The relationship between the binding site size, CG bases, binding form and the rate binding molecular is urgently modeled. Forming dimerization and trimerization, the concentration of working scaffold could be regulated.
1.6 Polo-scaffold: Scaffold with intermolecular binding component. These scaffolds bind each other or bind through mediate molecular. And this binding mode has been proved both in vitro and vivo. The aggregation of molecular also makes artificial organelle achievable. (fig4 a.b. Dimerization and trimerization. Protein binding site is sealed off by the scaffolds themselves. Too much scaffold molecular lend to the self regulation. c. Polo-scaffold be made by head-tail binding and d. mediate molecular binding.)
Several RNA scaffold mutations are constructed and characterize, but they are the tip of the iceberg. There is still plenty to do in this part. The charms of library are the selection and combination. It introduces a new concept of biobrick combination mode.
06 S3: BIOSYNTHESIS OF IAA
In previous work, FA and FB are used to indicate the efficiency of riboscaffold. In order to further prove the function of riboscaffold, we plan to substitute FA, FB with functional enzymes or protein substrates like ferredoxin in hydrogen producing pathway respectively.
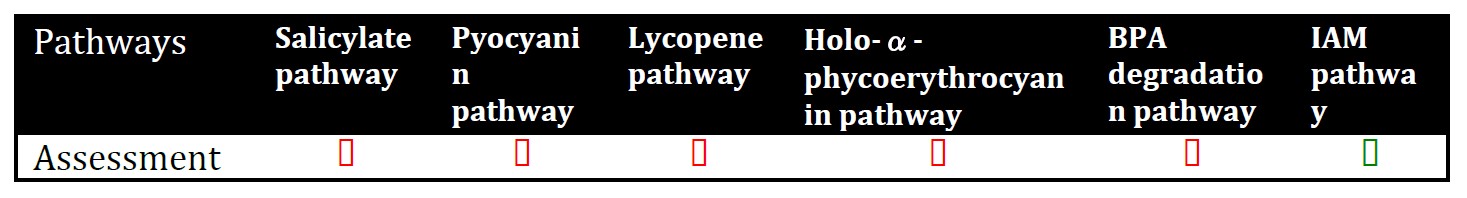
Considering the availability of material and abundant parts distributed by iGEM, we search the 2012 kit plate1-5 to find optimal pathways. After a pre-selection, six pathways are on candidate list. For sake of experimental feasibility, we perform a further selection based on several caritas as follows:
1. Product is easy to detect and measure;
2. Substrate is easy to get;
3. Product is beneficial to human;
4. The length of amino acid sequence of enzyme is optimal to be fusion protein;
5. Two proteins involved in the basic pathway.
Candidate list:
1. Salicylate pathway
(Group: iGEM2006_MIT)
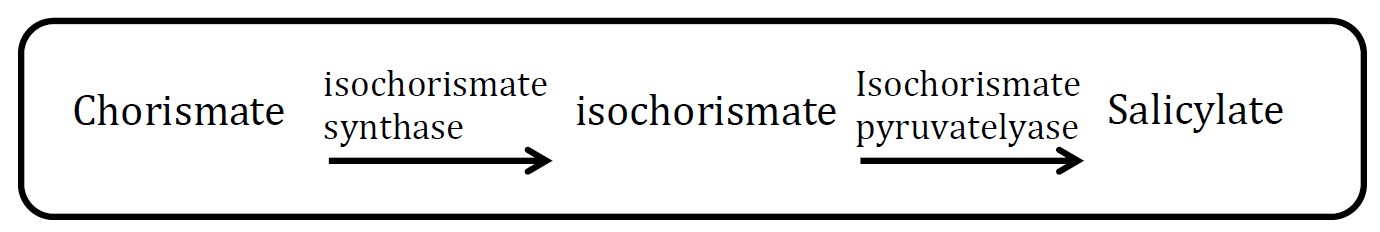
Assessment:
The characterization method of gas chromatography is difficult to perform. First, what can be analyzed is methyl salicylate production, that is to say, another enzyme should be co-transformed to E.coli too, which will increase cell’s burden and reduce the ratio of successful co-transformation. Second, it is not convenient for us to borrow the relative machine.
2. Pyocyanin pathway
(Group: iGEM2007_Glasgow)
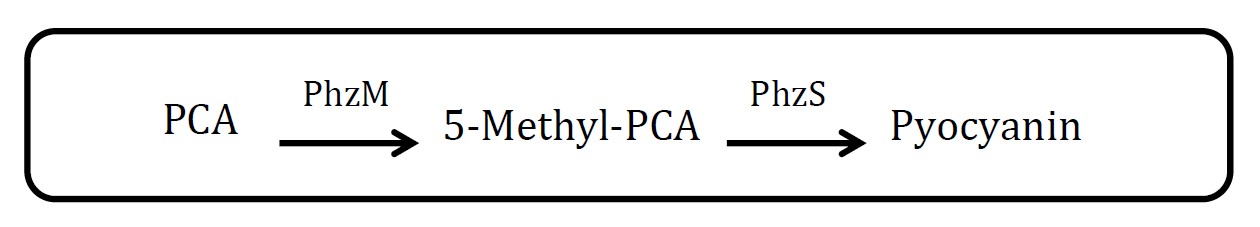
Assessment:
Through there are exactly two enzymes involved in this pathway, but the source of material, phenazine-1-carboxylic acid (PCA), is not mentioned. And it not easy to measure the amount of pyocyanin.
3. Lycopene pathway
(Group: iGEM2009_Cambridge)
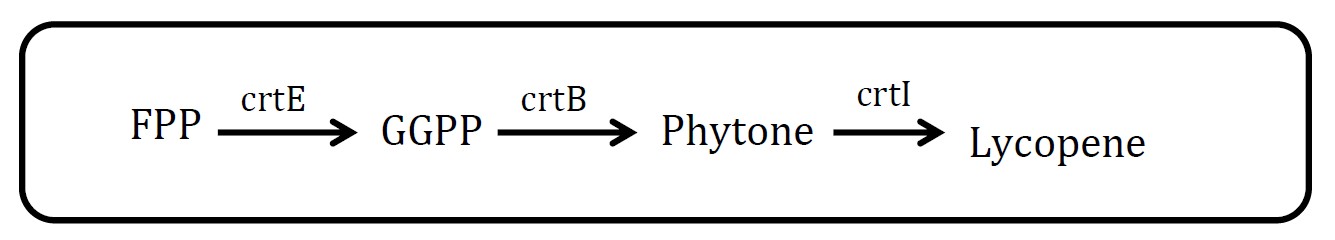
Assessment:
Lycopene is visible red and its substrate, FPP, is colorless. So measurement is quite feasible. But there are at least three proteins in this pathway, which will increase the burden of cell. But in future work, we could have a try.
4. Holo-α-phycoerythrocyanin pathway
(Group: iGEM2004_UTAustin)
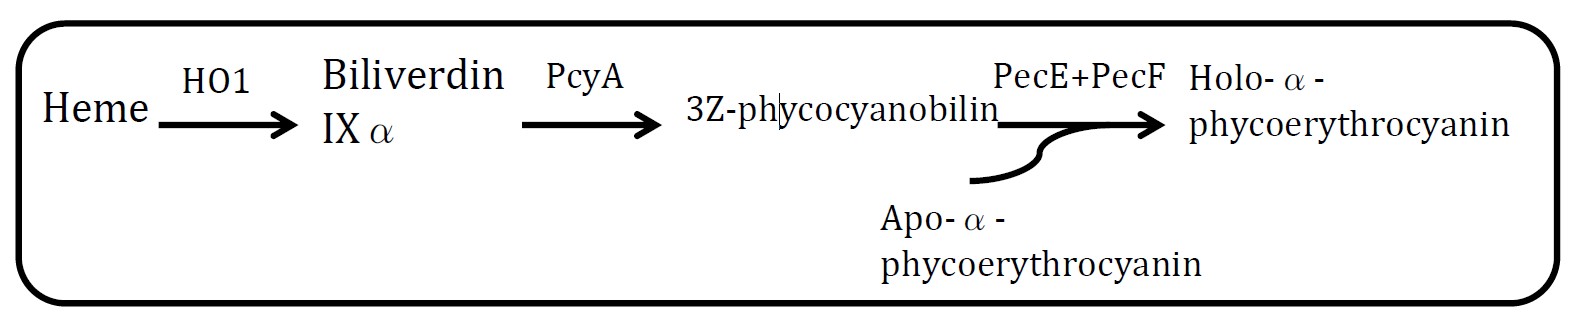
Assessment:
Heme is metabolic product of E.coli and Holo-α-phycoerythrocyanin is blue. But at least 5 proteins should be expressed in E.coli.
5. BPA degradation pathway
(Group: iGEM2008_University_of_Alberta)
Assessment:
Bisphenol A is degraded by BisdA and BisdB. But BPA is toxic to cells.
6. IAM pathway
(Group: iGEM2011_Imperial)
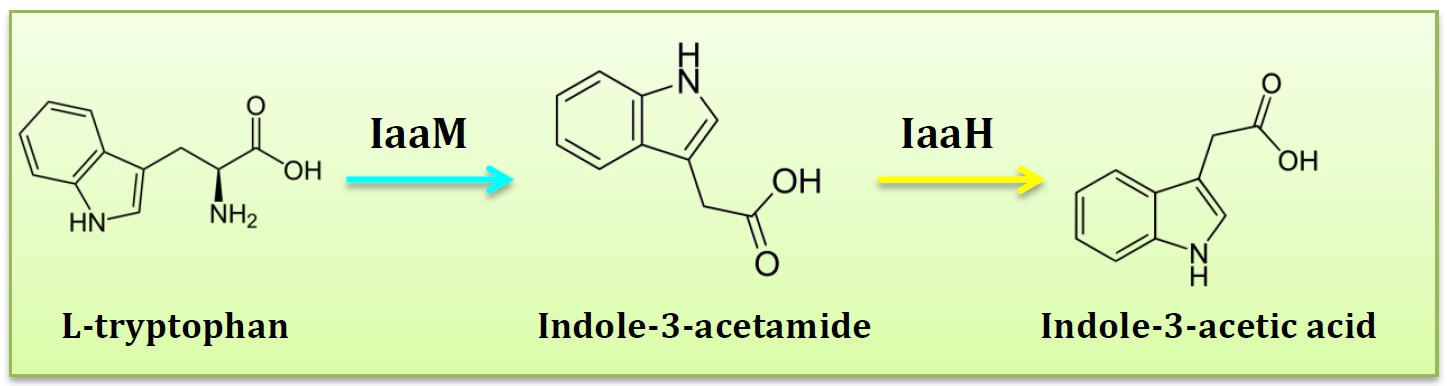
Assessment:
Five pathways described above all have some drawbacks, finally, only one pathway left, IAM pathway. The two-step IAM pathway generates indole-3-acetic acid (IAA) from the precursor tryptophan. IAA tryptophan monooxygenase (IaaM) catalyses the oxidative carboxylation of L-tryptophan to indole-3-acetamide, which is hydrolysed to IAA and ammonia by indoleacetamide hydrolase (IaaH).
Final Decision:
07 PARTS
01 Summary
This is a summary of the parts that we have submitted to the Registry of Standard Biological Parts. These parts include:
ncRNA scaffold generator: BBa_K738000, BBa_K738002
protein coding domains: BBa_K738004 , BBa_K738005 , BBa_K738006 , BBa_K738007
These parts have all been well characterized. Please visit the Registry of Standard Biological Parts for more information.
02 List
| ? | ? | Name | Type | Description | Designer | Length |
| W | BBa_K738000 | Generator | RNA Scaffold generator | Huachun Liu | 171 | |
 |
W | BBa_K738002 | Generator | Theophyline riboswitch regulated RNA Scoffold(clover version 2) | Huachun Liu | 209 |
| W | BBa_K738004 | Generator | FA-2X-MS2;Split GFP N-terminal domain fused with MS2 protein | Huachun Liu | 1284 | |
| W | BBa_K738005 | Coding | FB-2X-PP7;Split GFP C-terminal domain fused with PP7 protein | Huachun Liu | 654 | |
| BBa_K738006 | Coding | FA: Split GFP N-terminal domain | Huachun Liu | 480 | ||
| BBa_K738007 | Coding | FB, Split GFP C-terminal domain | Huachun Liu | 255 |
03 Future work
Theophylline responded RNA riboscaffold
We have designed two RNA riboscaffold responded to theophylline. Unfortunately, we only managed to submit one of them (K738002) to the Registry of Biological Parts in time (that means before September 26).
We have started the work of constructing a second theophylline responded RNA riboscaffold K738001 (but not finished). K738001 is different with K738002 in 3D structure, which may lead to results that are far away from that of K738002.
Please visit here for more information.
Library
We plan to develop a RNA scaffold library that offers more tunable responses. We’ve got several members in this library by now and our ultimate goal is acquiring a series of members which span a large acceleration rate range from about 10% to 90%. Thus, researchers may be able to choose a member in the library to acquire the targeted acceleration rate easily.
Pathway of producing IAA
Accelerating production of IAA with RNA scaffold has been proved to be efficient. Two enzymes, IaaH (BBa_K515000) and IaaM (BBa_K515001), are related to the process. We’ve fused IaaH and IaaM with MS2 and PP7 respectively to got IaaM-2X-MS2(BBa_K738014) and IaaH-2X-PP7(BBa_K738015), which are able to bind on RNA scaffold. Thus, we’d like to regulate the biosynthesis process efficiency with RNA riboscaffold. We plan to submit BBa_K738014 and BBa_738015 later.
08 RESULTS
S0: BASIC RNA SCAFFOLD
Contrasted to the fluorescence intensity (FI) of the E.coli which only express FA-MS2 and FB-PP7 fusion proteins, the fluorescence intensity of the E.coli with scaffold D0 was obviously increased. Thus, it was possible for us to carry out our development and reformation of RNA scaffold.

Fig.2 FI of Split GFPs without or with RNA scaffold. A. BL21*(DE3) transformed with pCJDFA and pCJDFB. B. BL21*(DE3) transformed with pCJDFA, pCJDFB and pCJDD0. The contrast of FI obviously shown that RNA scaffold D0 could bind split GFPs together, so that split GFPs could fluoresce. (Pictures were obtained with Olympus fluoview fv1000 confocal laser scanning microscope, using a 60X objective.)

Fig.3 FI/OD of different transformation groups. There exist significant differences among three groups. And as expected, split GFPs with scaffold D0 together can fluoresce stronger than those without scaffold.
Reference:
1. Thodey, K. & Smolke, C.D. Bringing It Together with RNA. Science 333, 412-413 (2011).
2. Delebecque, C.J., Lindner, A.B., Silver, P.A. & Aldaye, F.A. Organization of Intracellular Reactions with Rationally Designed RNA Assemblies. Science 333, 470-474 (2011).
S1: RIBOSCAFFOLD
Scaffold

Fig.12 Fluorescence microscopy. The (BL21*DE3) of the E. coli were transformed with FA+FB, FA+FB+ original RNA scaffold D0, and FA+FB+ our designed RNA scaffold clover 2(0.5 mM theophylline adding). As expected, strains without RNA scaffold did not fluoresce. Upon the existence of RNA scaffold, many of the cells emitted fluorescence indicating a substantial amount of split GFP combination is permitted because of the function of RNA scaffold. The brightfield images in the right column depict all bacterial cells. The GFP images in the left column depict bacterial cells which emitted fluorescence.

Fig.13 Biotek Synergy H1 Hybrid Reader controlled experiments. The BL21*DE3 of the E. coli were transformed with figure showing plasmids. (0.5 mM theophylline was adding in strains containing clover 2).
`luminescence \quad efficiency \quad of \quad clover 2=\frac{\frac{FI}{OD(FA+FB+clover 2)}-\frac{FI}{OD(FA+FB)}}{\frac{FI}{OD(FA+FB)}}=\frac{53425-23779}{23779}=125\%`
`luminescence \quad efficiency \quad of \quad D0=\frac{\frac{FI}{OD(FA+FB+clover 2)}-\frac{FI}{OD(FA+FB)}}{\frac{FI}{OD(FA+FB)}}=\frac{38288-23779}{23779}=61\%`
The original intention of our designing RNA scaffold clover 2 is to create a regulatory scaffold which can tune its conformation thus have various functions. To our surprise, clover version 2, when adding optimal Theophylline concentration 0.5mM, happens to be a more powerful scaffold which helps two halves of GFP’s combination and give out light strongly.
One possible reason is in clover version 2, distance between MS2 aptamer and PP7 aptamer is closer than in D0 (showing in Fig.4 and Fig.6), so that when binding phage coat proteins, FA and FB on clover version 2 were set closer than on D0. We submit the inference that when RNA scaffold binds enzymes, clover version 2 draws two enzymes nearer than D0 thus has more ability to accelerate the enzymatic reaction.
late and control by Theophylline
When the concentration of Theophylline is in the range from 0mM to 0.5mM, the concentration of Theophylline and the resulting fluorescence intensity are directly proportional.
Theophylline concentration beyond certain extent will be hazardous to cells and how it affects cells depends on strain type. The study by NYMU Taipei 2010 alerted adding more than 4mM of Theophylline would cause E. coli to die. In our experiments, we find that after adding more than 0.5mM, the Theophylline spectrum curve would be invalid. As a result, we pick up data with concentrations below 0.5mM to analyze as the E. coli cell would be unstable or the regulation of the Theophylline aptamer would not be accurate.

Fig.14 origin data of clover 2 regulatory tests. First line of each form is different treatments of Theophylline concentration and data in table cells are fluorescence intensity/ OD.


Fig.15 7 tests of fluorescence/ OD change over theophylline concentration. There’s evident positive correlation in between.
Then we build several SAS models to analyze data between 0-0.5mM Theophylline concentrations of treatments, choosing” clover version 2: different treatments versus blocks” test 5-7 to run a SAS model.
P-value shows that Theophylline concentrations have significant impact on fluorescence intensity of clover version 2 and almost no impact on D0. That is to say, our designed RNA scaffold clover version 2 can be regulated and controlled by Theophylline within 0-0.5mM not for random errors or common phenomenon in RNA scaffolds.
If you want more details about SAS source programs and software computational results, please click here [code].
S2: SCAFFOLD LIBRARY
S3: BIOSYNTHESIS OF IAA
09 APPLICATIONS
1. RNA aptamers take place of fluorescent proteins
Some RNA aptamers can bind fluorophores, such as 4-hydroxybenzlidene imidazolinone (HBI), 3,5-dimethoxy-4-hydroxybenzylidene imidazolinone (DMHBI), 3,5-difluoro-4-hydroxybenzylidene imidazolinone (DFHBI), resembling the fluorophore in GFP, and then these RNA-fluorophore complexes enable to emit different colors of fluorescence comparable in brightness with fluorescent proteins.
These RNA-fluorophore complexes could be used to tag RNAs in living cells to reveal the intracellular dynamics of RNA, including RNA-RNA and RNA-protein interactions.
[Reference: Jeremy S. Paige, Karen Y. Wu, Samie R. Jaffrey, RNA Mimics of Green Fluorescent Protein science, 2011 vol 333, 642-646]
2. kinetic investigation of RNA hybridizations and foldings
By introducing fluorophores like 1-ethynylpyrene into the 2-position of RNA adenosine, through an intermolecular interaction of the pyrene residues in twofold labelled RNA, single and double strands can be distinguished by their fluorescence spectrum changes.
With this fluorescence shift, one can distinguish between single-stranded and double-stranded RNA during thermal denaturation. This behavior could be used for the time resolved investigation of RNA hybridizations and folding by fluorescence spectroscopy.
[Reference: Josef Wachtveitlb, Joachim W. Engels, ect. RNA as scaffold for pyrene excited complexes, Bioorganic & Medicinal Chemistry 16 (2008) 19-26]
3. Medicine & health
To date, many groups have successfully identifi ed aptamers with a variety of functions, including inhibitory and decoy-like aptamers, regulatable aptamers, multivalent/agonistic aptamers, and aptamers that act as delivery vehicles. Each of these classes of aptamers has potential applications in therapeutics and/or diagnostics.
Inhibitory aptamers:The most extensively characterized inhibitory aptamer is the RNA aptamer that targets VEGF. This aptamer was approved by the FDA in December 2004, for the treatment of wet age-related macular degeneration (AMD)
Decoy-like aptamers:By mimicking the target sequence of the proteins, aptamers can act as decoys to inhibit binding of transcriptional factors such as HIV-tat, NF-κB, and E2F to their cognate sequences on DNA and thus prevent transcription of target genes and may result in powerful therapeutics for treating many human pathologies
Multivalent aptamers: A bivalent aptamer targeting HIV has also been described and consists of 2 separate RNA aptamers that bind to 2 distinct stem-loop structures within the HIV 5′UTR: the HIV-1 TAR element and the dimerization initiation site. Similarly, bivalent aptamers targeting thrombin have been engineered as a way to increase the avidity of the aptamer for its target and enhance the anticoagulation effect
Aptamers as delivery tools: Several groups have reported linking siRNAs to aptamers as a way to specifi cally deliver siRNAs to target cells. Aptamers are also being utilized to deliver toxins, radioisotopes, and chemotherapeutic agents encapsulated in nanoparticles.
[Reference: Kristina W. Thiel and Paloma H. Giangrande, Therapeutic Applications of DNA and RNA Aptamers. Oligonucleotides, 2009, Volume 19, Number 3, 209-222]
4. Regular of gene expression
Aptamers are small oligonucleic acid molecules that can be selected in vitro against nearly any target of choice. And they often show remarkable binding affinity and specificity, and consequently have a huge potential for application. One of their usages is to play a role in activating gene expression.
Some RNA aptamers can specifically bind some transcriptional regulator. For example, people have selected one RNA aptamer that can bind TetR, which usually binds on operator sequence and repress gene expression. So once the RNA aptamer binds to the transcriptional regulator, the targeting gene-expression is activated.
[Reference: Anke Hunsicker, Markus Steber, ect. An RNA Aptamer that Induces Transcription, Chemistry & Biology, 2009,Volume 16, Issue 2, 173–180]
