"
"
Team:ZJU-China/models.htm
From 2012.igem.org
(Difference between revisions)
(Created page with "<html xmlns="http://www.w3.org/1999/xhtml" class="cufon-active cufon-ready"><head><meta http-equiv="Content-Type" content="text/html; charset=UTF-8"> <script type="text/javascri...") |
|||
| Line 279: | Line 279: | ||
<h2>Riboscaffold -- Clover</h2> | <h2>Riboscaffold -- Clover</h2> | ||
| - | <p> </p> | + | <p> </p> |
<h3>Summary</h3> | <h3>Summary</h3> | ||
| - | <p> </p> | + | <p> </p> |
<p>On the fundament that RNA scaffold in vivo has been achieved, we aimed to design and assemble controllable scaffolds. A designed theophylline aptamer was added on the original scaffold D0 in order to produce an interaction with MS2 aptamer in the absence of theophylline, thus disturbing the bind of MS2 aptamer and corresponding protein. However in the presence of theophylline, the interaction would disappear with the change of theophylline aptamer. We called these controllable scaffolds 'clovers'. Three versions of clover were designed, which have different interaction sites and different relative positions between the theophylline and MS2 aptamers. </p> | <p>On the fundament that RNA scaffold in vivo has been achieved, we aimed to design and assemble controllable scaffolds. A designed theophylline aptamer was added on the original scaffold D0 in order to produce an interaction with MS2 aptamer in the absence of theophylline, thus disturbing the bind of MS2 aptamer and corresponding protein. However in the presence of theophylline, the interaction would disappear with the change of theophylline aptamer. We called these controllable scaffolds 'clovers'. Three versions of clover were designed, which have different interaction sites and different relative positions between the theophylline and MS2 aptamers. </p> | ||
| - | <p> </p> | + | <p> </p> |
<p>As a preliminary experiment, we use theophylline of different concentrations to test two existing parts, which consist of the gene of a theophylline aptamer and a fluorescent protein. </p> | <p>As a preliminary experiment, we use theophylline of different concentrations to test two existing parts, which consist of the gene of a theophylline aptamer and a fluorescent protein. </p> | ||
| - | <p> </p> | + | <p> </p> |
<p>Clover version two has been synthesized; it was co-transformated into E.coli with Fa-MS2 and Fb-PP7 fusion proteins. As a result, in a certain range of theophylline concentration, the fluorescent intensity has a positive correlation with it, which means controllable scaffold is achieved. Besides, to our surprise, the fluorescent could reach a higher intensity than the original scaffold D0, which means our clover, makes lovers closer!</p> | <p>Clover version two has been synthesized; it was co-transformated into E.coli with Fa-MS2 and Fb-PP7 fusion proteins. As a result, in a certain range of theophylline concentration, the fluorescent intensity has a positive correlation with it, which means controllable scaffold is achieved. Besides, to our surprise, the fluorescent could reach a higher intensity than the original scaffold D0, which means our clover, makes lovers closer!</p> | ||
| - | <p> </p> | + | <p> </p> |
<p>More future work will be done in the next period. We are going to synthesize clover version one and version three, which seem to have a better control effect. A comparison will be made to find the best design principle of controllable RNA scaffold. We believe that more RNA scaffolds with higher efficiency and better regulative effect will be designed and applied.</p> | <p>More future work will be done in the next period. We are going to synthesize clover version one and version three, which seem to have a better control effect. A comparison will be made to find the best design principle of controllable RNA scaffold. We believe that more RNA scaffolds with higher efficiency and better regulative effect will be designed and applied.</p> | ||
| - | <p> </p> | + | <p> </p> |
<h3>Design</h3> | <h3>Design</h3> | ||
| - | <p> </p> | + | <p> </p> |
<p>We thought to add another aptamer onto the scaffold and construct an interaction between it and the MS2 aptamer, such that it could disrupt the binding of MS2 protein and the MS2 aptamer.</p> | <p>We thought to add another aptamer onto the scaffold and construct an interaction between it and the MS2 aptamer, such that it could disrupt the binding of MS2 protein and the MS2 aptamer.</p> | ||
| - | <p> </p> | + | <p> </p> |
<p>We thought about the well-known theophylline aptamer. The aptamer is a single RNA hairpin that binds theophylline in an inner loop region with high affinity. Previous studies have shown mutations in the loop region were tolerated as long as the loop structure was preserved. This allowed us to mutate the loop of the theophylline aptamer to create an interaction between the theophylline aptamer and the MS2 aptamer. The interaction inhibits the binding function of MS2 aptamer in the absence of theophylline. However, when theophylline is added, the fold of the loop is changed and thus the interaction will disappear, leading to the binding of MS2 aptamer and corresponding protein.</p> | <p>We thought about the well-known theophylline aptamer. The aptamer is a single RNA hairpin that binds theophylline in an inner loop region with high affinity. Previous studies have shown mutations in the loop region were tolerated as long as the loop structure was preserved. This allowed us to mutate the loop of the theophylline aptamer to create an interaction between the theophylline aptamer and the MS2 aptamer. The interaction inhibits the binding function of MS2 aptamer in the absence of theophylline. However, when theophylline is added, the fold of the loop is changed and thus the interaction will disappear, leading to the binding of MS2 aptamer and corresponding protein.</p> | ||
| - | <p> </p> | + | <p> </p> |
<p>Fig.1 The control mechanism of the theophylline aptamer.</p> | <p>Fig.1 The control mechanism of the theophylline aptamer.</p> | ||
| - | <p> </p> | + | <p> </p> |
<p>Since the reformed scaffolds consist of three aptamers, just like clovers, we call them 'clover'. </p> | <p>Since the reformed scaffolds consist of three aptamers, just like clovers, we call them 'clover'. </p> | ||
| - | <p> </p> | + | <p> </p> |
<p>Fig.2 Our designed scaffolds are named 'clover'.</p> | <p>Fig.2 Our designed scaffolds are named 'clover'.</p> | ||
| - | <p> </p> | + | <p> </p> |
<p>Three versions of 'clover' were designed.</p> | <p>Three versions of 'clover' were designed.</p> | ||
| - | <p> </p> | + | <p> </p> |
<p>Fig.3 Three version of clovers. Version one and version two have adjacent MS2 and theophylline aptamer, while vesion three has separated ones. Version one has an interaction between the loop of theophylline aptamer and the loop of MS2 aptamer, while version two and version three have an interaction between the loop of theophylline aptamer and the stem of MS2 aptamer.</p> | <p>Fig.3 Three version of clovers. Version one and version two have adjacent MS2 and theophylline aptamer, while vesion three has separated ones. Version one has an interaction between the loop of theophylline aptamer and the loop of MS2 aptamer, while version two and version three have an interaction between the loop of theophylline aptamer and the stem of MS2 aptamer.</p> | ||
| - | <p> </p> | + | <p> </p> |
<h4>Original scaffold D0:</h4> | <h4>Original scaffold D0:</h4> | ||
| - | <p> </p> | + | <p> </p> |
<p>The base sequence of original scaffold D0:</p> | <p>The base sequence of original scaffold D0:</p> | ||
| - | <p> </p> | + | <p> </p> |
<p>GGGAGGACTCCCACAGTCACTGGGGAGTCCTCGAATACGAGCTGGGCACAGAAGATATGGCTTCGTGCCCAGGAAGTGTTCGCACTTCTCTCGTATTCGATTCCC</p> | <p>GGGAGGACTCCCACAGTCACTGGGGAGTCCTCGAATACGAGCTGGGCACAGAAGATATGGCTTCGTGCCCAGGAAGTGTTCGCACTTCTCTCGTATTCGATTCCC</p> | ||
| - | <p> </p> | + | <p> </p> |
<p>Fig.4 The secondary (left) and the tertiary(right) structure of D0.</p> | <p>Fig.4 The secondary (left) and the tertiary(right) structure of D0.</p> | ||
| - | <p> </p> | + | <p> </p> |
<h4>Clover version 1</h4> | <h4>Clover version 1</h4> | ||
| - | <p> </p> | + | <p> </p> |
<p>The interaction is between the loop of theophylline aptamer and the loop of the MS2 aptamer.</p> | <p>The interaction is between the loop of theophylline aptamer and the loop of the MS2 aptamer.</p> | ||
| - | <p> </p> | + | <p> </p> |
<p>And the theophylline aptamer is just beside the MS2 apatamer.</p> | <p>And the theophylline aptamer is just beside the MS2 apatamer.</p> | ||
| - | <p> </p> | + | <p> </p> |
<p>The base sequence of clover version 1:</p> | <p>The base sequence of clover version 1:</p> | ||
| - | <p> </p> | + | <p> </p> |
<p>GGGGUCCUCGGUGAUACCAGCAUagugacuAUGCCCUUGGCAGCACCGAGGAGGACTCCCACagtcactGGGGAGTCCTCGAATACGAGCTGGGCACAGAAGATATGGCTTCGTGCCCAGGAAGTGTTCGCACTTCTCTCGTATTCGCCCC</p> | <p>GGGGUCCUCGGUGAUACCAGCAUagugacuAUGCCCUUGGCAGCACCGAGGAGGACTCCCACagtcactGGGGAGTCCTCGAATACGAGCTGGGCACAGAAGATATGGCTTCGTGCCCAGGAAGTGTTCGCACTTCTCTCGTATTCGCCCC</p> | ||
| - | <p> </p> | + | <p> </p> |
<p>Fig.5 The secondary (left) and the tertiary (right) structure of clover version 1.</p> | <p>Fig.5 The secondary (left) and the tertiary (right) structure of clover version 1.</p> | ||
| - | <p> </p> | + | <p> </p> |
<h4>Clover version 2</h4> | <h4>Clover version 2</h4> | ||
| - | <p> </p> | + | <p> </p> |
<p>The interaction is between the loop of the theophylline aptamer and the stem of the MS2 apatamer. And the theophylline aptamer is just beside the MS2 apatamer.</p> | <p>The interaction is between the loop of the theophylline aptamer and the stem of the MS2 apatamer. And the theophylline aptamer is just beside the MS2 apatamer.</p> | ||
| - | <p> </p> | + | <p> </p> |
<p>The base sequence of clover version 2:</p> | <p>The base sequence of clover version 2:</p> | ||
| - | <p> </p> | + | <p> </p> |
<p>GGGGUCCUCGGUGAUACCAGCugacuguggCCCUUGGCAGCACCGAGGAGGACTCccacagtcaCTGGGGAGTCCTCGAATACGAGCTGGGCACAGAAGATATGGCTTCGTGCCCAGGAAGTGTTCGCACTTCTCTCGTATTCGCCCC</p> | <p>GGGGUCCUCGGUGAUACCAGCugacuguggCCCUUGGCAGCACCGAGGAGGACTCccacagtcaCTGGGGAGTCCTCGAATACGAGCTGGGCACAGAAGATATGGCTTCGTGCCCAGGAAGTGTTCGCACTTCTCTCGTATTCGCCCC</p> | ||
| - | <p> </p> | + | <p> </p> |
<p>Fig.6 The secondary (left) and the tertiary (right) structure of clover version 2.</p> | <p>Fig.6 The secondary (left) and the tertiary (right) structure of clover version 2.</p> | ||
| - | <p> </p> | + | <p> </p> |
<h4>Clover version 3</h4> | <h4>Clover version 3</h4> | ||
| - | <p> </p> | + | <p> </p> |
<p>The interaction is between the loop of the theophylline aptamer and the stem of the MS2 apatamer. Although the theophylline and the MS2 apatamer is separated by the PP7 aptamer in the base sequence, they are closed according to the three- dimensional structure prediction.</p> | <p>The interaction is between the loop of the theophylline aptamer and the stem of the MS2 apatamer. Although the theophylline and the MS2 apatamer is separated by the PP7 aptamer in the base sequence, they are closed according to the three- dimensional structure prediction.</p> | ||
| - | <p> </p> | + | <p> </p> |
<p>The base sequence of clover version 3:</p> | <p>The base sequence of clover version 3:</p> | ||
| - | <p> </p> | + | <p> </p> |
<p>GGGGUCCUCGGUGAUACCAGCugacuguggCCCUUGGCAGCACCGAGGACUGGGCACAGAAGAUAUGGCUUCGUGCCCAGUCGAAUACGAGGAAGUGUUCGCACUUCACCUGGGACUCccacagucaCUGGGGAGUCCCAGGUUCUCGUAUUCGCCCC</p> | <p>GGGGUCCUCGGUGAUACCAGCugacuguggCCCUUGGCAGCACCGAGGACUGGGCACAGAAGAUAUGGCUUCGUGCCCAGUCGAAUACGAGGAAGUGUUCGCACUUCACCUGGGACUCccacagucaCUGGGGAGUCCCAGGUUCUCGUAUUCGCCCC</p> | ||
| - | <p> </p> | + | <p> </p> |
<p>Fig.7 The secondary (left) and the tertiary (right) structure of clover version 3. Although the theophyline and MS2 aptamers are separated as the secondary structure showed, in the tertiary structure, the theophyline aptamer obviously fold towards the MS2 aptamer.</p> | <p>Fig.7 The secondary (left) and the tertiary (right) structure of clover version 3. Although the theophyline and MS2 aptamers are separated as the secondary structure showed, in the tertiary structure, the theophyline aptamer obviously fold towards the MS2 aptamer.</p> | ||
| - | <p> </p> | + | <p> </p> |
<p>Fig.8 A contrast between clover version 3 and a scaffold including a theophyline aptamer without a complementary site with MS2 aptamer. It can be easily noticed that in clover version 3, the theophyline aptamer obviously fold towards the MS2 aptamer, which indicates the interaction between the complementary sites in the theophyline and MS2 aptamers. In contrast, the scaffold without complementary sites in the two aptamers shows no approach of the theophyline aptamer to the MS2 aptamer.</p> | <p>Fig.8 A contrast between clover version 3 and a scaffold including a theophyline aptamer without a complementary site with MS2 aptamer. It can be easily noticed that in clover version 3, the theophyline aptamer obviously fold towards the MS2 aptamer, which indicates the interaction between the complementary sites in the theophyline and MS2 aptamers. In contrast, the scaffold without complementary sites in the two aptamers shows no approach of the theophyline aptamer to the MS2 aptamer.</p> | ||
| - | <p> </p> | + | <p> </p> |
<p>Preparation: Characterize parts in registry</p> | <p>Preparation: Characterize parts in registry</p> | ||
| - | <p> </p> | + | <p> </p> |
<p>To make tentative steps in order to fix the theophylline concentration of our clover coexpression experiment, we test some theophylline riboswitches tagged with fluorescent proteins.</p> | <p>To make tentative steps in order to fix the theophylline concentration of our clover coexpression experiment, we test some theophylline riboswitches tagged with fluorescent proteins.</p> | ||
| - | <p> </p> | + | <p> </p> |
<h4>BioBrick Part K537009:</h4> | <h4>BioBrick Part K537009:</h4> | ||
| - | <p> </p> | + | <p> </p> |
<p>To characterise the theophylline riboswitches (part K537009, iGEM11_WITS_CSIR_SA), we quantified their activation at different theophylline concentrations (0 mM, 1 mM, 5 mM, 10 mM and 20 mM) over 2 hours using fluorometry. </p> | <p>To characterise the theophylline riboswitches (part K537009, iGEM11_WITS_CSIR_SA), we quantified their activation at different theophylline concentrations (0 mM, 1 mM, 5 mM, 10 mM and 20 mM) over 2 hours using fluorometry. </p> | ||
| - | <p> </p> | + | <p> </p> |
<p>Competent E. coli (strain DH5a) cells were transformed with plasmid vectors containing the "Promoter-Theophylline riboswitch -Venus-Double terminator". The bacterial colony appeal pink. </p> | <p>Competent E. coli (strain DH5a) cells were transformed with plasmid vectors containing the "Promoter-Theophylline riboswitch -Venus-Double terminator". The bacterial colony appeal pink. </p> | ||
| - | <p> </p> | + | <p> </p> |
<p>Cultured until the mid-log phase of growth, a different concentration of theophylline was added to each culture for induction. The activation of the riboswitch was detected as a fluorescent response as a result of increased translation of the fluorescent protein Venus, in the presence of the activator. Before fluorescence assay, we wash the culture with PBS.</p> | <p>Cultured until the mid-log phase of growth, a different concentration of theophylline was added to each culture for induction. The activation of the riboswitch was detected as a fluorescent response as a result of increased translation of the fluorescent protein Venus, in the presence of the activator. Before fluorescence assay, we wash the culture with PBS.</p> | ||
| - | <p> </p> | + | <p> </p> |
<p>A Synergy hybrid reader was used to excite the cultures at 505 nm and the intensity of the emission was detected at 535 nm. Empty bacteria were used to correct for auto fluorescence (IGEM11_WITS_CSIR_SA offered exciting at 514nm and emission at 528nm, but 514&528 is too close for our machine to detect.)</p> | <p>A Synergy hybrid reader was used to excite the cultures at 505 nm and the intensity of the emission was detected at 535 nm. Empty bacteria were used to correct for auto fluorescence (IGEM11_WITS_CSIR_SA offered exciting at 514nm and emission at 528nm, but 514&528 is too close for our machine to detect.)</p> | ||
| - | <p> </p> | + | <p> </p> |
<p>We have two end points of the OD 630 of each sample.</p> | <p>We have two end points of the OD 630 of each sample.</p> | ||
| - | <p> </p> | + | <p> </p> |
<p>"Fluorescence intensity / OD" increases greatly with theophylline concentration.</p> | <p>"Fluorescence intensity / OD" increases greatly with theophylline concentration.</p> | ||
| - | <p> </p> | + | <p> </p> |
<p>Fig.9 The 5 different concentration of theophylline comparision on part K537009 theophylline robswitch tagged with venus YFP. Excitation at 505nm and emission at 535nm. Up to 20mM theophylline, cells didn't show side effects and YFP production is proportioned with theophylline concentration, showing that K537009 is an effective riboswitch which can be regulated by theophylline.</p> | <p>Fig.9 The 5 different concentration of theophylline comparision on part K537009 theophylline robswitch tagged with venus YFP. Excitation at 505nm and emission at 535nm. Up to 20mM theophylline, cells didn't show side effects and YFP production is proportioned with theophylline concentration, showing that K537009 is an effective riboswitch which can be regulated by theophylline.</p> | ||
| - | <p> </p> | + | <p> </p> |
<p>Fluorescence Microscope could also show this part work beautifully.</p> | <p>Fluorescence Microscope could also show this part work beautifully.</p> | ||
| - | <p> </p> | + | <p> </p> |
<p>Except for the difference that though K537009 is an YFP, we excite it at 532nm (green light) and it glow red.</p> | <p>Except for the difference that though K537009 is an YFP, we excite it at 532nm (green light) and it glow red.</p> | ||
| - | <p> </p> | + | <p> </p> |
<p>(这个图放wiki上的时候越大越好,其实能看出来趋势的)</p> | <p>(这个图放wiki上的时候越大越好,其实能看出来趋势的)</p> | ||
| - | <p> </p> | + | <p> </p> |
<p>Fig.10 The 5 different concentration of theophylline comparision on part K537009 theophylline riboswitch tagged with venus YFP. The brightfield (BF) images in the right column depict all bacterial cells. The venus images in the left column depict bacterial cells which emitted fluorescence. We excite it at 532nm (green light) and it glow red, seeing the obvious trend that when adding more theophylline, cells showing Veuns appeal more.</p> | <p>Fig.10 The 5 different concentration of theophylline comparision on part K537009 theophylline riboswitch tagged with venus YFP. The brightfield (BF) images in the right column depict all bacterial cells. The venus images in the left column depict bacterial cells which emitted fluorescence. We excite it at 532nm (green light) and it glow red, seeing the obvious trend that when adding more theophylline, cells showing Veuns appeal more.</p> | ||
| - | <p> </p> | + | <p> </p> |
<h4>BioBrick Part K411003:</h4> | <h4>BioBrick Part K411003:</h4> | ||
| - | <p> </p> | + | <p> </p> |
<p>This is a"pLAC promotor,Theophylline-inducible Riboswitch, GFP+Terminator" part made by 2010 NYMU-Taipe. We make similar tests as K537009 at different theophylline concentrations (0 mM, 0.1mM, 0.3mM, 0.5 mM,1mM,5mM,10mM and 20mM) over 2 hours using fluorometry.</p> | <p>This is a"pLAC promotor,Theophylline-inducible Riboswitch, GFP+Terminator" part made by 2010 NYMU-Taipe. We make similar tests as K537009 at different theophylline concentrations (0 mM, 0.1mM, 0.3mM, 0.5 mM,1mM,5mM,10mM and 20mM) over 2 hours using fluorometry.</p> | ||
| - | <p> </p> | + | <p> </p> |
<p>Synergy hybrid reader detects effective effects of theophylline on GFP production.</p> | <p>Synergy hybrid reader detects effective effects of theophylline on GFP production.</p> | ||
| - | <p> </p> | + | <p> </p> |
<p>Fig.11 The 8 different concentration of theophylline comparision on part K411003 theophylline robswitch tagged with GFP. Excitation at 480nm and emission at 535nm. Up to 10mM theophylline, cells didn't show obvious side effects and GFP production is proportioned with theophylline concentration, showing that K411003 is an effective riboswitch which can be regulated by theophylline. When theophylline concentration is beyond a certain degree (about 10 mM), it somewhat affect cell growth and GFP production.</p> | <p>Fig.11 The 8 different concentration of theophylline comparision on part K411003 theophylline robswitch tagged with GFP. Excitation at 480nm and emission at 535nm. Up to 10mM theophylline, cells didn't show obvious side effects and GFP production is proportioned with theophylline concentration, showing that K411003 is an effective riboswitch which can be regulated by theophylline. When theophylline concentration is beyond a certain degree (about 10 mM), it somewhat affect cell growth and GFP production.</p> | ||
| - | <p> </p> | + | <p> </p> |
<p>Through Fig9 and Fig11 we find that when theophylline concentration scale is 0-1mM (especially 0-0.5mM); the response of fluorescence protein to theophylline is more significant with bigger slope. So we decided to carry out our clover 2 characterization with theophylline concentration scale 0-1mM.</p> | <p>Through Fig9 and Fig11 we find that when theophylline concentration scale is 0-1mM (especially 0-0.5mM); the response of fluorescence protein to theophylline is more significant with bigger slope. So we decided to carry out our clover 2 characterization with theophylline concentration scale 0-1mM.</p> | ||
| - | <p> </p> | + | <p> </p> |
<h3>Characterization</h3> | <h3>Characterization</h3> | ||
| - | <p> </p> | + | <p> </p> |
<p>We characterize clover 2(Part K738002) we designed in split GFP methods.</p> | <p>We characterize clover 2(Part K738002) we designed in split GFP methods.</p> | ||
| - | <p> </p> | + | <p> </p> |
<p>Clover 2 is synthesized by Genscript and is a regulatory and tunable RNA scaffold with a theophylline aptamer. As we design it, when theophylline is added, MS2 aptamer will be free to combine FA tagged MS2 protein and closer with PP7 aptamer thus give out increasing light. We use fluorescence microscope, confocal microscopy and microplate reader to test our riboscaffold clover 2. For microplate hybrid reader experiments, fluorescence intensity/ OD 630 are used to be measurement criteria for comparison of the ability of give out light in microplate hybrid reader test.</p> | <p>Clover 2 is synthesized by Genscript and is a regulatory and tunable RNA scaffold with a theophylline aptamer. As we design it, when theophylline is added, MS2 aptamer will be free to combine FA tagged MS2 protein and closer with PP7 aptamer thus give out increasing light. We use fluorescence microscope, confocal microscopy and microplate reader to test our riboscaffold clover 2. For microplate hybrid reader experiments, fluorescence intensity/ OD 630 are used to be measurement criteria for comparison of the ability of give out light in microplate hybrid reader test.</p> | ||
| - | <p> </p> | + | <p> </p> |
<h4>Scaffold</h4> | <h4>Scaffold</h4> | ||
| - | <p> </p> | + | <p> </p> |
<p>We use fluorescence complementation to detect 3D comformational change of our riboscaffold clover 2. Green fluorescent protein (GFP) split into two halves (FA and FB) fused to the PP7 or MS2 aptamer binding proteins was used. Cells expressing FA and FB alone or clover 2 without the split GFPs displayed little fluorescence. However, the coexpression of clover 2 with the split GFPs showed increased fluorescence. Thus, our RNA scaffold clover 2 served as docking sites to promote protein-protein interactions in cells. </p> | <p>We use fluorescence complementation to detect 3D comformational change of our riboscaffold clover 2. Green fluorescent protein (GFP) split into two halves (FA and FB) fused to the PP7 or MS2 aptamer binding proteins was used. Cells expressing FA and FB alone or clover 2 without the split GFPs displayed little fluorescence. However, the coexpression of clover 2 with the split GFPs showed increased fluorescence. Thus, our RNA scaffold clover 2 served as docking sites to promote protein-protein interactions in cells. </p> | ||
| - | <p> </p> | + | <p> </p> |
<p>We make a series of cotransformation containing D0,clover2,FA,FB,FA+D0,FB+D0,FB+clover 2,FA+FB,and FA+FB+D0 & FA+FB+clover2. At mid-log phase we low-temperature-induced the E.colis by adding IPTG (0.2mM & 1mM) at 20 degree. After 5 hours, strains containing clover 2 were adding 0.5mM Theophylline. Successfully results are shown as we expected that, strains expressing only RNA scaffolds almost don't give out light, strains expressing FA+FB give out medium light and strains containing RNA scaffold &FA+FB emit a powerful beam after excitation.</p> | <p>We make a series of cotransformation containing D0,clover2,FA,FB,FA+D0,FB+D0,FB+clover 2,FA+FB,and FA+FB+D0 & FA+FB+clover2. At mid-log phase we low-temperature-induced the E.colis by adding IPTG (0.2mM & 1mM) at 20 degree. After 5 hours, strains containing clover 2 were adding 0.5mM Theophylline. Successfully results are shown as we expected that, strains expressing only RNA scaffolds almost don't give out light, strains expressing FA+FB give out medium light and strains containing RNA scaffold &FA+FB emit a powerful beam after excitation.</p> | ||
| - | <p> </p> | + | <p> </p> |
<p>To our surprise, the RNA scaffold clover 2 serves as a more effective scaffold than the origin D0, whose luminescence efficiency is 124.67% and performs better than D0 by 39.5%. (这里给到result里的链接!)</p> | <p>To our surprise, the RNA scaffold clover 2 serves as a more effective scaffold than the origin D0, whose luminescence efficiency is 124.67% and performs better than D0 by 39.5%. (这里给到result里的链接!)</p> | ||
| - | <p> </p> | + | <p> </p> |
<p>(Formula: luminescence efficiency=(FI/OD(FA+FB+scaffold)-FI/OD(FA+FB))/(FI/OD(FA+FB)))</p> | <p>(Formula: luminescence efficiency=(FI/OD(FA+FB+scaffold)-FI/OD(FA+FB))/(FI/OD(FA+FB)))</p> | ||
| - | <p> </p> | + | <p> </p> |
<h4>Regulate and control by Theophylline</h4> | <h4>Regulate and control by Theophylline</h4> | ||
| - | <p> </p> | + | <p> </p> |
<p>To characterise the theophylline tuned RNA scaffold clover 2 (part K738002), we quantified their activation at different theophylline concentrations (0 mM,0.1mM, 0.2 mM, 0.3mM, 0.4 mM, 0.5 mM, 0.6 mM, 0.7 mM,1 mM) over a period of time using fluorometry. Competent E. coli (strain BL21*DE3) cells were transformed with plasmid vectors containing the riboscaffold and were cultured until the mid-log phase of growth, then 0.2mM IPTG were added. After 3 hours, a different concentration of theophylline was added to each culture for induction. 2 hours later, we use PBS to wash the culture and prepare for following tests. The regulatory effect of the Theophylline aptamer was detected as a fluorescent response as a result of increased release of the MS2 aptamer. MS2 aptamer will be free to combine MS2 protein tagged FA and be closer with PP7 aptamer when Theophylline adding. A Synergy Hybrid Reader was used to excite the cultures at 480 nm and the intensity of the emission peak was detected at 535 nm. 3 replications were taken each culture, and 4 repeated experiment. </p> | <p>To characterise the theophylline tuned RNA scaffold clover 2 (part K738002), we quantified their activation at different theophylline concentrations (0 mM,0.1mM, 0.2 mM, 0.3mM, 0.4 mM, 0.5 mM, 0.6 mM, 0.7 mM,1 mM) over a period of time using fluorometry. Competent E. coli (strain BL21*DE3) cells were transformed with plasmid vectors containing the riboscaffold and were cultured until the mid-log phase of growth, then 0.2mM IPTG were added. After 3 hours, a different concentration of theophylline was added to each culture for induction. 2 hours later, we use PBS to wash the culture and prepare for following tests. The regulatory effect of the Theophylline aptamer was detected as a fluorescent response as a result of increased release of the MS2 aptamer. MS2 aptamer will be free to combine MS2 protein tagged FA and be closer with PP7 aptamer when Theophylline adding. A Synergy Hybrid Reader was used to excite the cultures at 480 nm and the intensity of the emission peak was detected at 535 nm. 3 replications were taken each culture, and 4 repeated experiment. </p> | ||
| - | <p> </p> | + | <p> </p> |
<p>We find that up to a certain point (0.5 mM), a positive correlation exists between the GFP production and theophylline concentration, indicating that at first MS2 aptamer and theophylline aptamer are interacting(through specific base pairing) and close, when theophylline goes in, MS2 aptamer combines FA+MS2 and interact with FB+PP7 on PP7 aptamer thus give out fluorescence light. More theophylline, more light. SAS software results show significant variation(P-value<0.05) between 0mM theophylline and 0.5mM theophylline (optimum theophylline concentration to make clover 2 work) effects on clover 2.(这里给到result里的链接!)</h3> | <p>We find that up to a certain point (0.5 mM), a positive correlation exists between the GFP production and theophylline concentration, indicating that at first MS2 aptamer and theophylline aptamer are interacting(through specific base pairing) and close, when theophylline goes in, MS2 aptamer combines FA+MS2 and interact with FB+PP7 on PP7 aptamer thus give out fluorescence light. More theophylline, more light. SAS software results show significant variation(P-value<0.05) between 0mM theophylline and 0.5mM theophylline (optimum theophylline concentration to make clover 2 work) effects on clover 2.(这里给到result里的链接!)</h3> | ||
| - | <p> </p> | + | <p> </p> |
<p>It turns out that our riboscaffold clover 2 can be regulated and controlled through conformational change by theophylline. This scaffold, by theophylline management, could have a variety of functions, more than accelerate the reaction, but whether to accelerate or not, the degree of acceleration and even reduce the reaction rate. </p> | <p>It turns out that our riboscaffold clover 2 can be regulated and controlled through conformational change by theophylline. This scaffold, by theophylline management, could have a variety of functions, more than accelerate the reaction, but whether to accelerate or not, the degree of acceleration and even reduce the reaction rate. </p> | ||
| - | <p> </p> | + | <p> </p> |
<h3>Results</h3> | <h3>Results</h3> | ||
| - | <p> </p> | + | <p> </p> |
<h4>Scaffold</h4> | <h4>Scaffold</h4> | ||
| - | <p> </p> | + | <p> </p> |
<p>Fig.12 Fluorescence microscopy. The (BL21*DE3) of the E. coli were transformed with FA+FB, FA+FB+ original RNA scaffold D0, and FA+FB+ our designed RNA scaffold clover 2(0.5 mM theophylline adding). As expected, strains without RNA scaffold did not fluoresce. Upon the existence of RNA scaffold, many of the cells emitted fluorescence indicating a substantial amount of split GFP combination is permitted because of the function of RNA scaffold. The brightfield images in the right column depict all bacterial cells. The GFP images in the left column depict bacterial cells which emitted fluorescence. </p> | <p>Fig.12 Fluorescence microscopy. The (BL21*DE3) of the E. coli were transformed with FA+FB, FA+FB+ original RNA scaffold D0, and FA+FB+ our designed RNA scaffold clover 2(0.5 mM theophylline adding). As expected, strains without RNA scaffold did not fluoresce. Upon the existence of RNA scaffold, many of the cells emitted fluorescence indicating a substantial amount of split GFP combination is permitted because of the function of RNA scaffold. The brightfield images in the right column depict all bacterial cells. The GFP images in the left column depict bacterial cells which emitted fluorescence. </p> | ||
| - | <p> </p> | + | <p> </p> |
<p>Fig.13 Synergy Hybrid Microplate Reader controlled experiments. The BL21*DE3 of the E. coli were transformed with figure showing plasmids. (0.5 mM theophylline was adding in strains containing clover 2). luminescence efficiency of clover 2=(FI/OD(FA+FB+clover 2)-FI/OD(FA+FB))/(FI/OD(FA+FB))=(53425-23779)/23779=124.67%</p> | <p>Fig.13 Synergy Hybrid Microplate Reader controlled experiments. The BL21*DE3 of the E. coli were transformed with figure showing plasmids. (0.5 mM theophylline was adding in strains containing clover 2). luminescence efficiency of clover 2=(FI/OD(FA+FB+clover 2)-FI/OD(FA+FB))/(FI/OD(FA+FB))=(53425-23779)/23779=124.67%</p> | ||
| - | <p> </p> | + | <p> </p> |
<p>luminescence efficiency of D0=(FI/OD(FA+FB+clover 2)-FI/OD(FA+FB))/(FI/OD(FA+FB))=(38288-23779)/23779=61%</p> | <p>luminescence efficiency of D0=(FI/OD(FA+FB+clover 2)-FI/OD(FA+FB))/(FI/OD(FA+FB))=(38288-23779)/23779=61%</p> | ||
| - | <p> </p> | + | <p> </p> |
<h3>Discussion</h3> | <h3>Discussion</h3> | ||
| - | <p> </p> | + | <p> </p> |
<h4>Regulate and control by Theophylline</h4> | <h4>Regulate and control by Theophylline</h4> | ||
| - | <p> </p> | + | <p> </p> |
<p>When the concentration of Theophylline is in the range 0mM to 0.5mM, the concentration of Theophylline and the resulting fluorescence are directly proportional. </p> | <p>When the concentration of Theophylline is in the range 0mM to 0.5mM, the concentration of Theophylline and the resulting fluorescence are directly proportional. </p> | ||
| - | <p> </p> | + | <p> </p> |
<p>Theophylline concentration beyond certain exten will be The study by NYMU Taipei 2010 alerted adding more than 4mM of Theophylline would cause E. coli to die. In our experiments, we find that after adding more than 0.5mM, the Theophylline spectrum curve would be invalid. As a result, we do not recommend doing experiments with concentrations over 4mM as the E. coli cell would be unstable or the regulation of the riboswitch would not be accurate. </p> | <p>Theophylline concentration beyond certain exten will be The study by NYMU Taipei 2010 alerted adding more than 4mM of Theophylline would cause E. coli to die. In our experiments, we find that after adding more than 0.5mM, the Theophylline spectrum curve would be invalid. As a result, we do not recommend doing experiments with concentrations over 4mM as the E. coli cell would be unstable or the regulation of the riboswitch would not be accurate. </p> | ||
| - | <p> </p> | + | <p> </p> |
<p>Our figures show that the sample fluorescence will disperse clearly after 80 minutes. As a result, we suggest that the protein expression of the downstream coding sequence will be more obvious after about 200 minutes of adding Theophylline.</p> | <p>Our figures show that the sample fluorescence will disperse clearly after 80 minutes. As a result, we suggest that the protein expression of the downstream coding sequence will be more obvious after about 200 minutes of adding Theophylline.</p> | ||
| - | <p> </p> | + | <p> </p> |
| Line 443: | Line 443: | ||
<h2>Scaffold or Non-scaffold </h2> | <h2>Scaffold or Non-scaffold </h2> | ||
| - | <p> </p> | + | <p> </p> |
<h3>Introduction</h3> | <h3>Introduction</h3> | ||
| - | <p> </p> | + | <p> </p> |
<p>As explained before, the RNA scaffold brings the two enzymes (MS2 and PP7) closer, which improve the reaction rate of pathways. It seems magical that the reaction rate would be improved when two enzymes are close to each other. Then some questions are emerging. How faster it would be when two enzymes are in a RNA scaffold? What are the factors that will affect the efficiency of pathways? Those are what we want to discuss below. In this section, we establish a model by simplifying the molecular motion and simulating the reaction using Matlab programming.</p> | <p>As explained before, the RNA scaffold brings the two enzymes (MS2 and PP7) closer, which improve the reaction rate of pathways. It seems magical that the reaction rate would be improved when two enzymes are close to each other. Then some questions are emerging. How faster it would be when two enzymes are in a RNA scaffold? What are the factors that will affect the efficiency of pathways? Those are what we want to discuss below. In this section, we establish a model by simplifying the molecular motion and simulating the reaction using Matlab programming.</p> | ||
| - | <p> </p> | + | <p> </p> |
<h3>Simplification</h3> | <h3>Simplification</h3> | ||
| - | <p> </p> | + | <p> </p> |
<p>We simplify our abstract model as a pathway A -> B -> C. Enzyme one (E1) catalyzes the reaction A -> B and enzyme two (E2) catalyzes the reaction B -> C. The reaction equation is:</p> | <p>We simplify our abstract model as a pathway A -> B -> C. Enzyme one (E1) catalyzes the reaction A -> B and enzyme two (E2) catalyzes the reaction B -> C. The reaction equation is:</p> | ||
| - | <p> </p> | + | <p> </p> |
<p>`A \leftrightarrow B \leftrightarrow C`</p> | <p>`A \leftrightarrow B \leftrightarrow C`</p> | ||
| - | <p> </p> | + | <p> </p> |
<p>Molecular motion is continuous and complex so that it is difficult to model precisely. As a simplification, it is reasonable to discretize the continuous time as discrete steps and simplify the molecular Brownian motion as three-dimensional random walking. With this simplification, we can approximately observe the process of reaction and the reaction rate. Therefore, we present algorithms to simulate the process of molecular reaction dynamically and intuitionally.</p> | <p>Molecular motion is continuous and complex so that it is difficult to model precisely. As a simplification, it is reasonable to discretize the continuous time as discrete steps and simplify the molecular Brownian motion as three-dimensional random walking. With this simplification, we can approximately observe the process of reaction and the reaction rate. Therefore, we present algorithms to simulate the process of molecular reaction dynamically and intuitionally.</p> | ||
| - | <p> </p> | + | <p> </p> |
<h3>Algorithm</h3> | <h3>Algorithm</h3> | ||
| - | <p> </p> | + | <p> </p> |
<p>In order to simulate the molecular motion and verify the fact that a RNA scaffold with two enzymes can speed reactions of the pathway, we simplify the complex realistic situation as a simple and virtual three dimensional world.</p> | <p>In order to simulate the molecular motion and verify the fact that a RNA scaffold with two enzymes can speed reactions of the pathway, we simplify the complex realistic situation as a simple and virtual three dimensional world.</p> | ||
| - | <p> </p> | + | <p> </p> |
<h3>Assumptions:</h3> | <h3>Assumptions:</h3> | ||
| - | <p> </p> | + | <p> </p> |
<p>1. The container is a cube and we assumed a unit. The edge of the cube is an integral multiple of one unit.</p> | <p>1. The container is a cube and we assumed a unit. The edge of the cube is an integral multiple of one unit.</p> | ||
| - | <p> </p> | + | <p> </p> |
<p>2. The cube is in a grid pattern and all the molecules are at the grid intersections.</p> | <p>2. The cube is in a grid pattern and all the molecules are at the grid intersections.</p> | ||
| - | <p> </p> | + | <p> </p> |
<p>3. The molecular motion is random walking in three dimensions.</p> | <p>3. The molecular motion is random walking in three dimensions.</p> | ||
| - | <p> </p> | + | <p> </p> |
<p>4. The molecule cannot cross the edge of the cube.</p> | <p>4. The molecule cannot cross the edge of the cube.</p> | ||
| - | <p> </p> | + | <p> </p> |
<h3>Algorithm:</h3> | <h3>Algorithm:</h3> | ||
| - | <p> </p> | + | <p> </p> |
<p>Initial state: All the molecules including A, E1 and E2 are randomly scattered at the intersections</p> | <p>Initial state: All the molecules including A, E1 and E2 are randomly scattered at the intersections</p> | ||
| - | <p> </p> | + | <p> </p> |
<p>Step 1: Check if there is A and E1 at the same intersection. If there, B is generated and A disappears.</p> | <p>Step 1: Check if there is A and E1 at the same intersection. If there, B is generated and A disappears.</p> | ||
| - | <p> </p> | + | <p> </p> |
<p>Step 2: Check if there is B and E2 at the same intersection. If there, C is generated and B disappears.</p> | <p>Step 2: Check if there is B and E2 at the same intersection. If there, C is generated and B disappears.</p> | ||
| - | <p> </p> | + | <p> </p> |
<p>Step 3: All the molecules are randomly walking one unit. If the molecule is going to across the border, it will be still and does not have a walk. Then, go back to step 1.</p> | <p>Step 3: All the molecules are randomly walking one unit. If the molecule is going to across the border, it will be still and does not have a walk. Then, go back to step 1.</p> | ||
| - | <p> </p> | + | <p> </p> |
<h3>Implementation</h3> | <h3>Implementation</h3> | ||
| - | <p> </p> | + | <p> </p> |
<p>We use the Matlab programming to construct the model and implement this algorithm, presenting the results using both data and 3D figures.</p> | <p>We use the Matlab programming to construct the model and implement this algorithm, presenting the results using both data and 3D figures.</p> | ||
| - | <p> </p> | + | <p> </p> |
<h3>A small scale simulation</h3> | <h3>A small scale simulation</h3> | ||
| - | <p> </p> | + | <p> </p> |
<p>A small scale simulation is used to verify our algorithm, providing a clearly recognize of our algorithm. </p> | <p>A small scale simulation is used to verify our algorithm, providing a clearly recognize of our algorithm. </p> | ||
| - | <p> </p> | + | <p> </p> |
<p>The initial parameters are as followings:</p> | <p>The initial parameters are as followings:</p> | ||
<p>Edge of cube: 30 units</p> | <p>Edge of cube: 30 units</p> | ||
| Line 496: | Line 496: | ||
<p>The number of E2: 25</p> | <p>The number of E2: 25</p> | ||
<p>The distance between E1 and E2 for RNA scaffold: 2 units</p> | <p>The distance between E1 and E2 for RNA scaffold: 2 units</p> | ||
| - | <p> </p> | + | <p> </p> |
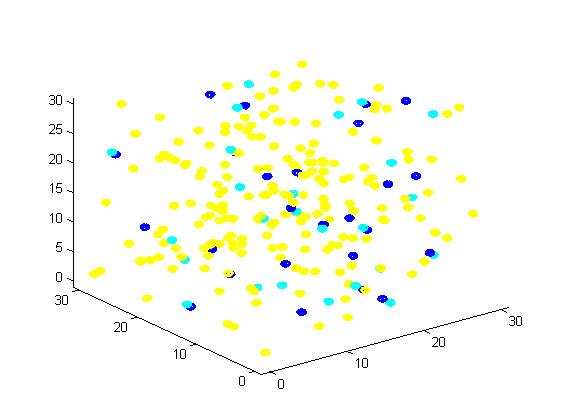
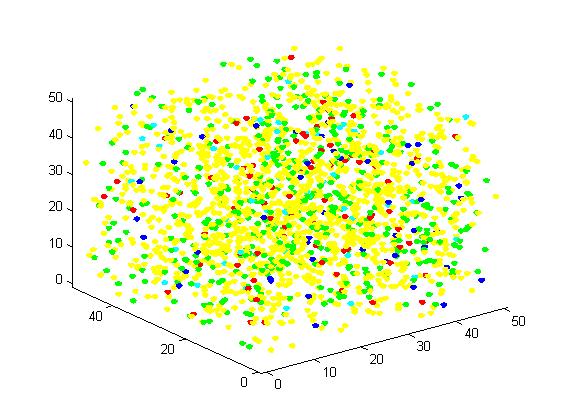
<p>In the figure, we use the color yellow to represent A, green to B, red to C, blue to E1 and cyan to E2. This rule is used for all the figures in this section. The figures present the results vividly and visually. In addition, this is a random simulation so that we run the same code for 20 times and have an average outcome which is more convincing.</p> | <p>In the figure, we use the color yellow to represent A, green to B, red to C, blue to E1 and cyan to E2. This rule is used for all the figures in this section. The figures present the results vividly and visually. In addition, this is a random simulation so that we run the same code for 20 times and have an average outcome which is more convincing.</p> | ||
<div><img src="http://www.jiajunlu.com/igem/zju_model2_1.jpg"></div> | <div><img src="http://www.jiajunlu.com/igem/zju_model2_1.jpg"></div> | ||
| Line 502: | Line 502: | ||
<p>Figure 1. The initial state of the molecules for small scale simulation. The edge of cube is 30. There are 100 A, 25 E1 and 25 E2, which are randomly scattered in the cube container. | <p>Figure 1. The initial state of the molecules for small scale simulation. The edge of cube is 30. There are 100 A, 25 E1 and 25 E2, which are randomly scattered in the cube container. | ||
After 1000 iterations, the scaffold and non-scaffold results are as following:</p> | After 1000 iterations, the scaffold and non-scaffold results are as following:</p> | ||
| - | <p> </p> | + | <p> </p> |
| - | <p>Scaffold             Non-scaffold</p> | + | <p>Scaffold Non-scaffold</p> |
| - | <p>The number of A: 94             The number of A: 101</p> | + | <p>The number of A: 94 The number of A: 101</p> |
| - | <p>The number of B: 63             The number of B: 73</p> | + | <p>The number of B: 63 The number of B: 73</p> |
| - | <p>The number of C: 43             The number of C: 26</p> | + | <p>The number of C: 43 The number of C: 26</p> |
| - | <p>The number of E1: 25             The number of E1: 25</p> | + | <p>The number of E1: 25 The number of E1: 25</p> |
| - | <p>The number of E2: 25             The number of E2: 25</p> | + | <p>The number of E2: 25 The number of E2: 25</p> |
| - | <p> </p> | + | <p> </p> |
<div><img src="http://www.jiajunlu.com/igem/zju_model2_2.jpg"></div> | <div><img src="http://www.jiajunlu.com/igem/zju_model2_2.jpg"></div> | ||
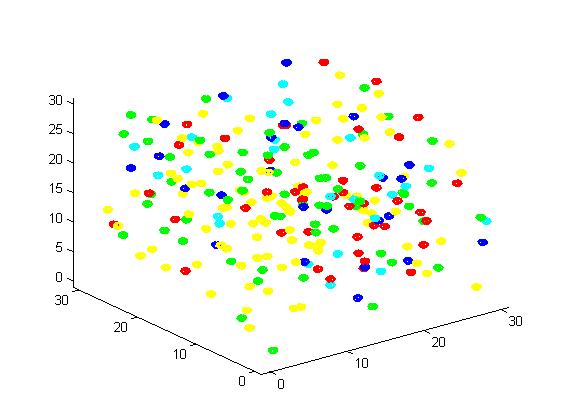
<p>Figure 2. Result of scaffold system for small scale simulation. After 1000 iterations, there are 63 B and 43 C.</p> | <p>Figure 2. Result of scaffold system for small scale simulation. After 1000 iterations, there are 63 B and 43 C.</p> | ||
<div><img src="http://www.jiajunlu.com/igem/zju_model2_3.jpg"></div> | <div><img src="http://www.jiajunlu.com/igem/zju_model2_3.jpg"></div> | ||
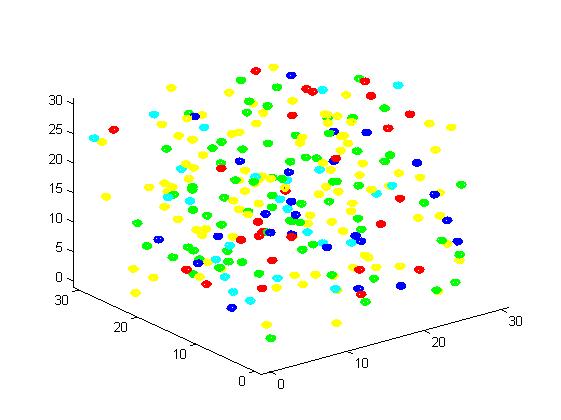
<p>Figure 3. Result of non-scaffold system for small scale simulation. After 1000 iterations, there are 73 B and 26 C.</p> | <p>Figure 3. Result of non-scaffold system for small scale simulation. After 1000 iterations, there are 73 B and 26 C.</p> | ||
| - | <p> </p> | + | <p> </p> |
<p>From the results, we can find that the number of C for scaffold is more than those for non-scaffold. Therefore, enzyme one and enzyme two being on a RNA scaffold can help to improve the reaction rate. The figures can help to provide a visible reflection. Though the small scale simulation has verified our algorithm, we also present a large scale simulation and have some discussion.</p> | <p>From the results, we can find that the number of C for scaffold is more than those for non-scaffold. Therefore, enzyme one and enzyme two being on a RNA scaffold can help to improve the reaction rate. The figures can help to provide a visible reflection. Though the small scale simulation has verified our algorithm, we also present a large scale simulation and have some discussion.</p> | ||
| - | <p> </p> | + | <p> </p> |
<h3>A large scale simulation</h3> | <h3>A large scale simulation</h3> | ||
<p>The initial state is as following:</p> | <p>The initial state is as following:</p> | ||
| Line 526: | Line 526: | ||
<p>The number of E2: 50</p> | <p>The number of E2: 50</p> | ||
<p>The distance between E1 and E2 for RNA scaffold: 2 units</p> | <p>The distance between E1 and E2 for RNA scaffold: 2 units</p> | ||
| - | <p> </p> | + | <p> </p> |
<p>After 1000 iterations, the scaffold and non-scaffold results are as following:</p> | <p>After 1000 iterations, the scaffold and non-scaffold results are as following:</p> | ||
| - | <p>Scaffold             Non-scaffold</p> | + | <p>Scaffold Non-scaffold</p> |
| - | <p>The number of A: 1417             The number of A: 1470</p> | + | <p>The number of A: 1417 The number of A: 1470</p> |
| - | <p>The number of B: 436             The number of B: 451</p> | + | <p>The number of B: 436 The number of B: 451</p> |
| - | <p>The number of C: 147             The number of C: 79</p> | + | <p>The number of C: 147 The number of C: 79</p> |
| - | <p>The number of E1: 50             The number of E1: 50</p> | + | <p>The number of E1: 50 The number of E1: 50</p> |
| - | <p>The number of E2: 50             The number of E2: 50</p> | + | <p>The number of E2: 50 The number of E2: 50</p> |
<div><img src="http://www.jiajunlu.com/igem/zju_model2_4.jpg"></div> | <div><img src="http://www.jiajunlu.com/igem/zju_model2_4.jpg"></div> | ||
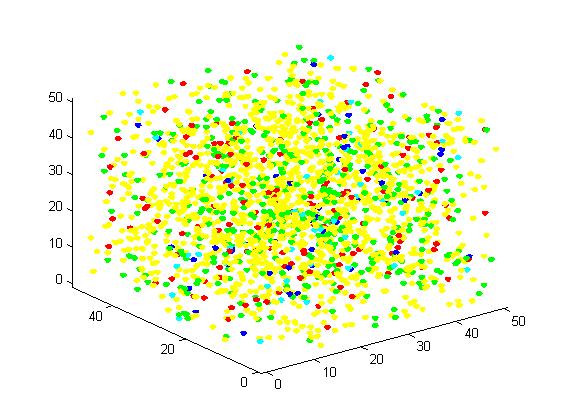
<p>Figure 4. Result of scaffold system for large scale simulation. After 1200 iterations, there are 436 B and 147 C.</p> | <p>Figure 4. Result of scaffold system for large scale simulation. After 1200 iterations, there are 436 B and 147 C.</p> | ||
<div><img src="http://www.jiajunlu.com/igem/zju_model2_5.jpg"></div> | <div><img src="http://www.jiajunlu.com/igem/zju_model2_5.jpg"></div> | ||
<p>Figure 5. Result of non-scaffold system for large scale simulation. After 1200 iterations, there are 451 B and 79 C.</p> | <p>Figure 5. Result of non-scaffold system for large scale simulation. After 1200 iterations, there are 451 B and 79 C.</p> | ||
| - | <p> </p> | + | <p> </p> |
<h3>Comparison between scaffold and non-scaffold</h3> | <h3>Comparison between scaffold and non-scaffold</h3> | ||
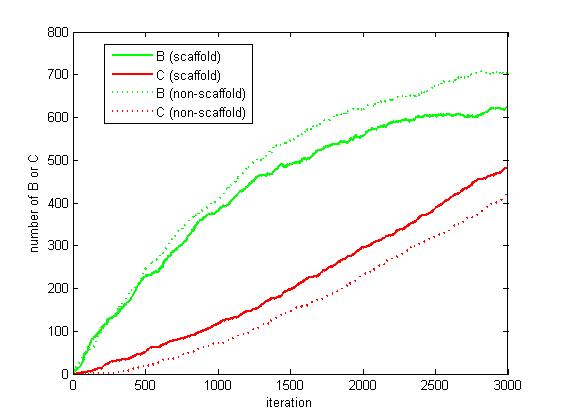
<p>As the iteration increasing, the number of A is decreasing and the number of B and C are increasing. We record the number of B and C for both scaffold and non-scaffold as iteration grows to watch the reaction rate of pathway (i.e. the number of C).</p> | <p>As the iteration increasing, the number of A is decreasing and the number of B and C are increasing. We record the number of B and C for both scaffold and non-scaffold as iteration grows to watch the reaction rate of pathway (i.e. the number of C).</p> | ||
<div><img src="http://www.jiajunlu.com/igem/zju_model2_6.jpg"></div> | <div><img src="http://www.jiajunlu.com/igem/zju_model2_6.jpg"></div> | ||
<p>Figure 6. The number of B and C as iteration grows.</p> | <p>Figure 6. The number of B and C as iteration grows.</p> | ||
| - | <p> </p> | + | <p> </p> |
<p>From figure 4.5.6, it is obvious that the number of C for scaffold is more than that for non-scaffold. Therefore, it is safely to draw a conclusion that the reaction rate of pathway has been speed up because of the scaffold bringing two enzymes closer.</p> | <p>From figure 4.5.6, it is obvious that the number of C for scaffold is more than that for non-scaffold. Therefore, it is safely to draw a conclusion that the reaction rate of pathway has been speed up because of the scaffold bringing two enzymes closer.</p> | ||
<h3>Effect of enzymes concentration</h3> | <h3>Effect of enzymes concentration</h3> | ||
<p>From the above discussion, we assumed the concentration of enzymes is constant. However, the increasing concentration of enzymes also results in the increasing of reaction rate. The difference between scaffold and non-scaffold system varies when the concentration of enzymes increase.</p> | <p>From the above discussion, we assumed the concentration of enzymes is constant. However, the increasing concentration of enzymes also results in the increasing of reaction rate. The difference between scaffold and non-scaffold system varies when the concentration of enzymes increase.</p> | ||
| - | <p> </p> | + | <p> </p> |
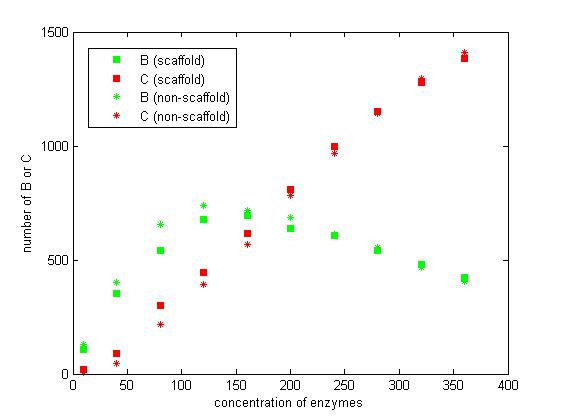
<p>We select the number of E1 and E2 for 10, 40, 80, 120, 160, 200, 240, 280, 320 and 360 to record the number of C after 1200 iterations.</p> | <p>We select the number of E1 and E2 for 10, 40, 80, 120, 160, 200, 240, 280, 320 and 360 to record the number of C after 1200 iterations.</p> | ||
<div><img src="http://www.jiajunlu.com/igem/zju_model2_7.jpg"></div> | <div><img src="http://www.jiajunlu.com/igem/zju_model2_7.jpg"></div> | ||
<p>Figure 7. The number of B and C vary according to the concentration of enzymes.</p> | <p>Figure 7. The number of B and C vary according to the concentration of enzymes.</p> | ||
| - | <p> </p> | + | <p> </p> |
<p>From the figure 7, we find that when the concentration of enzymes is too low and too high, the difference between scaffold and non-scaffold system is not noticeable. Only when the concentration of enzymes is at a certain range of value, the advantages of scaffold system is significant.</p> | <p>From the figure 7, we find that when the concentration of enzymes is too low and too high, the difference between scaffold and non-scaffold system is not noticeable. Only when the concentration of enzymes is at a certain range of value, the advantages of scaffold system is significant.</p> | ||
| Line 560: | Line 560: | ||
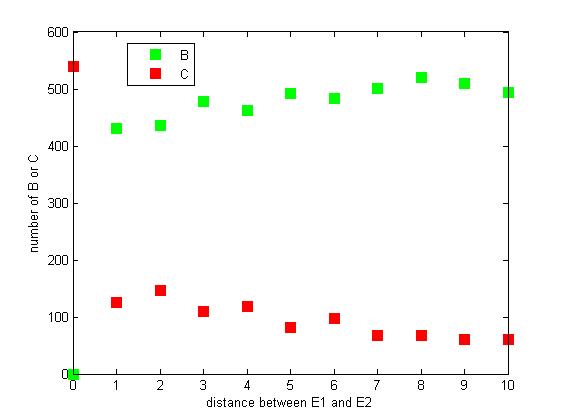
<p>Figure 8. The number of B or C vary according to the distance between E1 and E2</p> | <p>Figure 8. The number of B or C vary according to the distance between E1 and E2</p> | ||
| - | <p> </p> | + | <p> </p> |
<p>From figure 8, it is easily to figure out that as the distance between E1 and E2 increasing, the final number of C is decreasing. </p> | <p>From figure 8, it is easily to figure out that as the distance between E1 and E2 increasing, the final number of C is decreasing. </p> | ||
| Line 576: | Line 576: | ||
<h3>Assumption</h3> | <h3>Assumption</h3> | ||
<p>There are two aptamers on the RNA scaffold named aptamer1 (A1) and aptamer2 (A2). Aptamer1 is binding with MS2 and aptamer2 is binding with PP7. Before establishing the model, we declare some assumptions.</p> | <p>There are two aptamers on the RNA scaffold named aptamer1 (A1) and aptamer2 (A2). Aptamer1 is binding with MS2 and aptamer2 is binding with PP7. Before establishing the model, we declare some assumptions.</p> | ||
| - | <p> </p> | + | <p> </p> |
<p>1.After mixing the RNA scaffold, MS2 and PP7, no RNA, MS2 and PP7 are added to the solution or removed from the solution.</p> | <p>1.After mixing the RNA scaffold, MS2 and PP7, no RNA, MS2 and PP7 are added to the solution or removed from the solution.</p> | ||
| - | <p> </p> | + | <p> </p> |
<p>2.MS2 would not bind with aptamer2 and PP7 would not bind with aptamer1.</p> | <p>2.MS2 would not bind with aptamer2 and PP7 would not bind with aptamer1.</p> | ||
| - | <p> </p> | + | <p> </p> |
<p>3.The binding of MS2 to aptamer1 and the binding of PP7 to aptamer2 are independent with each other. The binding of one would not affect the binding of the other.</p> | <p>3.The binding of MS2 to aptamer1 and the binding of PP7 to aptamer2 are independent with each other. The binding of one would not affect the binding of the other.</p> | ||
| - | <p> </p> | + | <p> </p> |
<p>Symbols and Parameters Declaration</p> | <p>Symbols and Parameters Declaration</p> | ||
<p>[`MS2`] : Concentration of MS2</p> | <p>[`MS2`] : Concentration of MS2</p> | ||
| Line 600: | Line 600: | ||
<p>[`K_{+2}`] : Association rate of aptamer2 to PP7</p> | <p>[`K_{+2}`] : Association rate of aptamer2 to PP7</p> | ||
<p>[`K_{-2}`] : Dissociation rate of aptamer2 to PP7</p> | <p>[`K_{-2}`] : Dissociation rate of aptamer2 to PP7</p> | ||
| - | <p> </p> | + | <p> </p> |
<h3>Differential equation modeling</h3> | <h3>Differential equation modeling</h3> | ||
| - | <p> </p> | + | <p> </p> |
<p>The binding of aptamer1 to MS2 and aptamer2 to PP7 can be presented as reaction formula:</p> | <p>The binding of aptamer1 to MS2 and aptamer2 to PP7 can be presented as reaction formula:</p> | ||
| - | <p> </p> | + | <p> </p> |
<p>`MS2+A1 \leftrightarrow MS2A1`</p> | <p>`MS2+A1 \leftrightarrow MS2A1`</p> | ||
<p>`PP7+A2 \leftrightarrow PP7A2`</p> | <p>`PP7+A2 \leftrightarrow PP7A2`</p> | ||
| - | <p> </p> | + | <p> </p> |
<p>where MS2A1 is the MS2-A1 complex and PP7A2 is the PP7-A2.</p> | <p>where MS2A1 is the MS2-A1 complex and PP7A2 is the PP7-A2.</p> | ||
| - | <p> </p> | + | <p> </p> |
<p>According to the definition of association rate and dissociation rate, we can obtain the differential equations:</p> | <p>According to the definition of association rate and dissociation rate, we can obtain the differential equations:</p> | ||
| - | <p> </p> | + | <p> </p> |
<p>`\frac{d[MS2A1]}{dt}=k_{+1}[MS2][A1]-k_{-1}[MS2A1]`</p> | <p>`\frac{d[MS2A1]}{dt}=k_{+1}[MS2][A1]-k_{-1}[MS2A1]`</p> | ||
<p>`\frac{d[PP7A2]}{dt}=k_{+2}[PP7][A2]-k_{-2}[PP7A2]`</p> | <p>`\frac{d[PP7A2]}{dt}=k_{+2}[PP7][A2]-k_{-2}[PP7A2]`</p> | ||
| - | <p> </p> | + | <p> </p> |
<p>And it is obvious that</p> | <p>And it is obvious that</p> | ||
| - | <p> </p> | + | <p> </p> |
<p>`[MS2]=[MS2_0]-[MS2A1][A1]=[RNA_0]-[MS2A1]`</p> | <p>`[MS2]=[MS2_0]-[MS2A1][A1]=[RNA_0]-[MS2A1]`</p> | ||
<p>`[PP7]=[PP7_0]-[PP7A2][A2]=[RNA_0]-[PP7A2]`</p> | <p>`[PP7]=[PP7_0]-[PP7A2][A2]=[RNA_0]-[PP7A2]`</p> | ||
| - | <p> </p> | + | <p> </p> |
<p>Therefore, we have the final differential equation</p> | <p>Therefore, we have the final differential equation</p> | ||
| - | <p> </p> | + | <p> </p> |
<P>`\frac{d[MS2A1]}{dt}=k_{+1}([MS2_0]-[MS2A1])([RNA_0]-[MS2A1])-k_{-1}[MS2A1]`</P> | <P>`\frac{d[MS2A1]}{dt}=k_{+1}([MS2_0]-[MS2A1])([RNA_0]-[MS2A1])-k_{-1}[MS2A1]`</P> | ||
<P>`\frac{d[PP7A2]}{dt}=k_{+2}([PP7_0]-[PP7A2])([RNA_0]-[PP7A2])-k_{-2}[PP7A2]`</P> | <P>`\frac{d[PP7A2]}{dt}=k_{+2}([PP7_0]-[PP7A2])([RNA_0]-[PP7A2])-k_{-2}[PP7A2]`</P> | ||
| Line 629: | Line 629: | ||
<h3>Equilibrium analysis</h3> | <h3>Equilibrium analysis</h3> | ||
| - | <p> </p> | + | <p> </p> |
<p>We solve the differential equations numerically using the "ode" solver in Matlab. Titolo et at once come up with an approach to determine the equilibrium dissociation constant. This constant is dependent on anisotropies of the sample, aptamer, and intensities of the polarizers[1]. Therefore, the association rate constant and dissociation rate constant are usually experimentally determined values. It is difficult for us to determine the constants precisely since they vary in terms of experimental environment. </p>According to literature, we assumed that</p> | <p>We solve the differential equations numerically using the "ode" solver in Matlab. Titolo et at once come up with an approach to determine the equilibrium dissociation constant. This constant is dependent on anisotropies of the sample, aptamer, and intensities of the polarizers[1]. Therefore, the association rate constant and dissociation rate constant are usually experimentally determined values. It is difficult for us to determine the constants precisely since they vary in terms of experimental environment. </p>According to literature, we assumed that</p> | ||
| - | <p> </p> | + | <p> </p> |
<P>`k_{+1}=2 \times 10^4 M^{-1}S^{-1}`</P> | <P>`k_{+1}=2 \times 10^4 M^{-1}S^{-1}`</P> | ||
<P>`k_{-1}=2.18 \times 10^{-4} S^{-1}`</P> | <P>`k_{-1}=2.18 \times 10^{-4} S^{-1}`</P> | ||
<P>`k_{+2}=1.5 \times 10^4 M^{-1}S^{-1}`</P> | <P>`k_{+2}=1.5 \times 10^4 M^{-1}S^{-1}`</P> | ||
<P>`k_{-2}=1.63 \times 10^{-4} S^{-1}`</P> | <P>`k_{-2}=1.63 \times 10^{-4} S^{-1}`</P> | ||
| - | <p> </p> | + | <p> </p> |
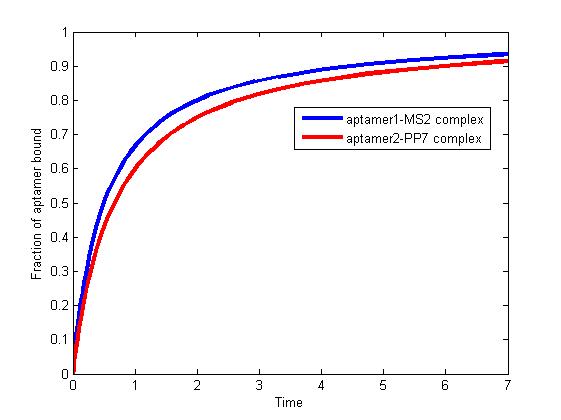
<p>The results are shown as follows:</p> | <p>The results are shown as follows:</p> | ||
<div><img src="http://www.jiajunlu.com/igem/zju_model3_1.jpg"></div> | <div><img src="http://www.jiajunlu.com/igem/zju_model3_1.jpg"></div> | ||
<p>Figure 1. The fraction of aptamer1-MS2 complex and the fraction of aptamer2-PP7 complex are increasing and finally reach equilibrium. </p> | <p>Figure 1. The fraction of aptamer1-MS2 complex and the fraction of aptamer2-PP7 complex are increasing and finally reach equilibrium. </p> | ||
| - | <p> </p> | + | <p> </p> |
<p>As we mentioned above, the binding of MS2 to aptamer1 and the binding of PP7 to aptamer2 are independent with each other. The binding of one would not affect the binding of the other. From probability theoretical perspective, the fraction of RNA scaffold binding with both MS2 and PP7 is equal to the fraction of RNA scaffold binding with MS2 multiply the fraction of RNA scaffold binding with PP7. The RNA scaffold binding with both MS2 and PP7 is what we need to improve the reaction rate of pathways. </p> | <p>As we mentioned above, the binding of MS2 to aptamer1 and the binding of PP7 to aptamer2 are independent with each other. The binding of one would not affect the binding of the other. From probability theoretical perspective, the fraction of RNA scaffold binding with both MS2 and PP7 is equal to the fraction of RNA scaffold binding with MS2 multiply the fraction of RNA scaffold binding with PP7. The RNA scaffold binding with both MS2 and PP7 is what we need to improve the reaction rate of pathways. </p> | ||
| - | <p> </p> | + | <p> </p> |
<h3>References</h3> | <h3>References</h3> | ||
<p>[1] Ajish S. R. Potty, Katerina Kourentzi, Han Fang, George W. Jackson, Xing Zhang, Glen B. Legge, Richard C. Willson. Biophysical Characterization of DNA Aptamer Interactions with Vascular Endothelial Growth Factor. 2008.</p> | <p>[1] Ajish S. R. Potty, Katerina Kourentzi, Han Fang, George W. Jackson, Xing Zhang, Glen B. Legge, Richard C. Willson. Biophysical Characterization of DNA Aptamer Interactions with Vascular Endothelial Growth Factor. 2008.</p> | ||
Revision as of 16:45, 24 September 2012