 "
"
Team:ZJU-China/model s2 3.htm
From 2012.igem.org
A large scale simulation
The initial state is as following:
Edge of cube: 50 units
The amount of A: 2000
The amount of B: 0
The amount of C: 0
The amount of E1: 50
The amount of E2: 50
The distance between E1 and E2 for RNA scaffold: 2 units
After 1200 iterations, the scaffold and non-scaffold results are as following:
| Scaffold | Non-scaffold | ||
|---|---|---|---|
| A (Substrate) | 1417 | 1470 | |
| B (Intermediate) | 436 | 451 | |
| C (Product) | 147 | 79 | |
| E1 (Enzyme1) | 50 | 50 | |
| E2 (Enzyme2) | 50 | 50 |
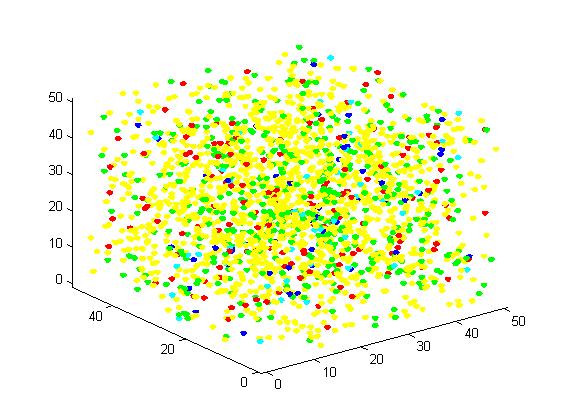
Fig 4. Result of scaffold system for large scale simulation. After 1200 iterations, there are 436 B and 147 C.
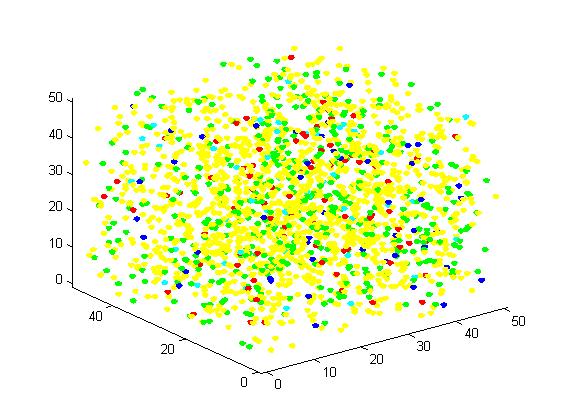
Fig 5. Result of non-scaffold system for large scale simulation. After 1200 iterations, there are 451 B and 79 C.
Comparison between the two system
As the iteration increasing, the number of A is decreasing and the number of B and C are increasing. We record the number of B and C for both scaffold system and non-scaffold system as iteration grows to watch the reaction rate of pathway (i.e. the number of C).
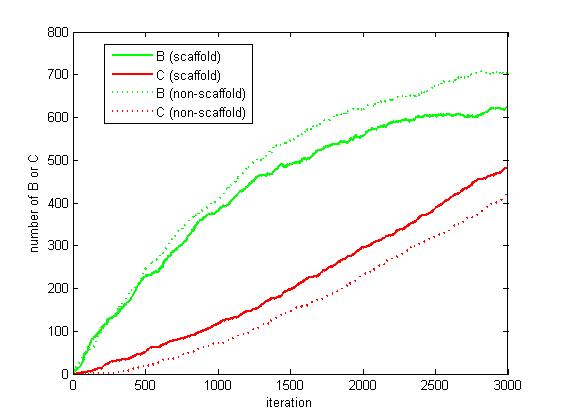
Fig 6. The number of B and C as iteration grows.
From figure 4.5.6, it is obvious that the number of C for scaffold system is more than that for non-scaffold system and the number of B for scaffold system is less than that for non-scaffold system. This phenomenon can be interpreted as that the probability that B meets an E2 is highly increased since their distance is closer. Therefore, it is safely to draw a conclusion that the reaction rate of pathway has been speed up because of the scaffold bringing two enzymes closer.