 "
"
Team:ZJU-China/model s2 2.htm
From 2012.igem.org
| Line 240: | Line 240: | ||
<p align="justify">The distance between E1 and E2 for RNA scaffold: 2 units</p> | <p align="justify">The distance between E1 and E2 for RNA scaffold: 2 units</p> | ||
<p align="justify"> </p> | <p align="justify"> </p> | ||
| - | <p align="justify">In the figure, we use the color <b style="color:#FFBF00">yellow</b> to represent <b style="color:#FFBF00">A</b>, <b style="color:#31B404">green</b> to <b style="color:#31B404">B</b>, <b style="color:#DF013A">red</b> to <b style="color:#DF013A">C</b>, blue to E1 and cyan to E2. This rule is used for all the figures in this section. The figures present the results vividly and visually. In addition, this is a random simulation so that we run the same code for 20 times and have an average outcome which is more convincing.</p> | + | <p align="justify">In the figure, we use the color <b style="color:#FFBF00">yellow</b> to represent <b style="color:#FFBF00">A</b>, <b style="color:#31B404">green</b> to <b style="color:#31B404">B</b>, <b style="color:#DF013A">red</b> to <b style="color:#DF013A">C</b>, <b style="color:#00BFFF">blue</b> to <b style="color:#00BFFF">E1</b> and <b style="color:#0431B4">cyan</b> to <b style="color:#0431B4">E2</b>. This rule is used for all the figures in this section. The figures present the results vividly and visually. In addition, this is a random simulation so that we run the same code for 20 times and have an average outcome which is more convincing.</p> |
<div class="floatC"><img src="http://www.jiajunlu.com/igem/zju_model2_1.jpg" width="400px"></div> | <div class="floatC"><img src="http://www.jiajunlu.com/igem/zju_model2_1.jpg" width="400px"></div> | ||
Latest revision as of 14:56, 25 October 2012
A small scale simulation
A small scale simulation is used to verify our algorithm, providing a clearly recognize of our algorithm.
The initial parameters are as followings:
Edge of cube: 30 units
The amount of A: 200
The amount of B: 0
The amount of C: 0
The amount of E1: 25
The amount of E2: 25
The distance between E1 and E2 for RNA scaffold: 2 units
In the figure, we use the color yellow to represent A, green to B, red to C, blue to E1 and cyan to E2. This rule is used for all the figures in this section. The figures present the results vividly and visually. In addition, this is a random simulation so that we run the same code for 20 times and have an average outcome which is more convincing.
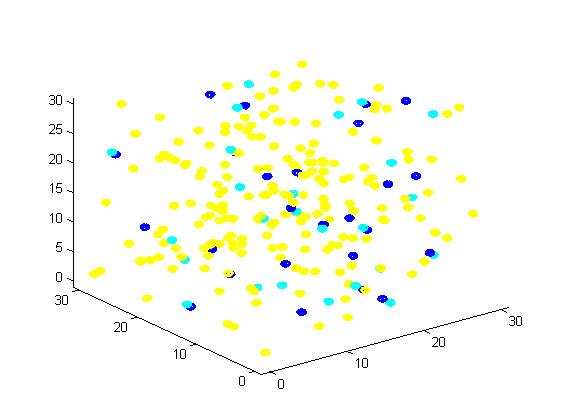
Fig 1. The initial state of the molecules for small scale simulation. The edge of cube is 30. There are 100 A, 25 E1 and 25 E2, which are randomly scattered in the cube container. After 1000 iterations, the scaffold and non-scaffold results are as following:
| Scaffold | Non-scaffold | |
|---|---|---|
| A (Substrate) | 94 | 101 |
| B (Intermediate) | 63 | 73 |
| C (Product) | 43 | 26 |
| E1 (Enzyme1) | 25 | 25 |
| E2 (Enzyme2) | 25 | 25 |
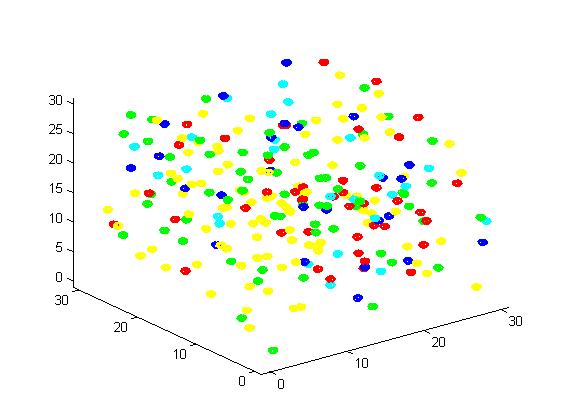
Fig 2. Result of scaffold system for small scale simulation. After 1000 iterations, there are 63 B and 43 C.
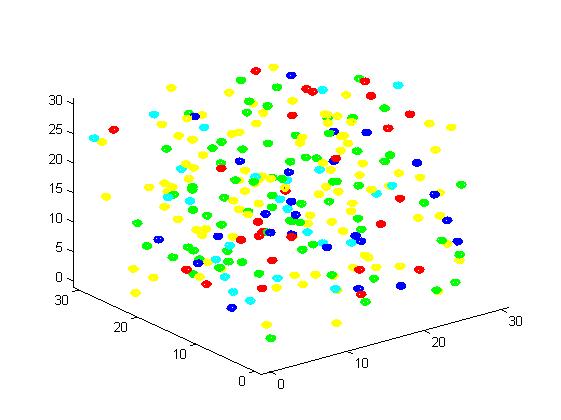
Fig 3. Result of non-scaffold system for small scale simulation. After 1000 iterations, there are 73 B and 26 C.
From the results, we can find that the number of C for scaffold is more than those for non-scaffold. Therefore, enzyme one and enzyme two being on a RNA scaffold can help to improve the reaction rate. The figures can help to provide a visible reflection. Though the small scale simulation has verified our algorithm, we also present a large scale simulation to draw more conclusions.