Team:Valencia Biocampus/modeling1
From 2012.igem.org
Alejovigno (Talk | contribs) |
Alejovigno (Talk | contribs) |
||
| Line 25: | Line 25: | ||
| - | [[Image:Dashed.png]] | + | [[Image:Dashed.png|center|400px]] |
Revision as of 12:27, 26 September 2012
Contents |
Modeling Bacteria
Here we modeled several of the Bacteria constructions.
Are you hot?
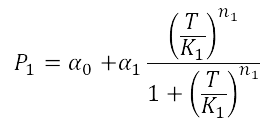
For the case of the Heat Shock promoter, we decided to model the static transfer function of the Fluorescent Intensity as a result of the Temperature with the folow equation:
Here
In order to estimate the parameters of this model we performed a heat shock experiment.
Analysis corresponding to a heat shock applied during 10 minutes at different tempe-ratures ranging from 20ºC up to 51ºC. For each temperature three samples were tested. Fluorescence Intensity (FI) and optical density (OD) were measured at t1=60 minutes and t2=120 minutes after application of the heat pulse had finished.
The first practical problem we encountered was the lack of enough heating coats. Be-cause of these we took the culture, and we splitted the experiments in two batches. FI and OD were measured at t1=60, and t2=120 for batch number 1, while for batch number 2 the heat shock was delayed by 40 minutes with respect to the first batch. Therefore, measu-rements for batch no.2 were taken at t1=100, and t2=160 minutes respectively.
During this 40 minutes delay, the microorganism was growing. Therefore, the heat shock in batch no. 2 was applied to a larger population than in the case of batch no.1. Consequently, the measurements of FI and DO gave much higher values. This affects the ratio FI/DO, were the two batches can be clearly distinguished (see figure 1).
 "
"

