 "
"
Team:UC Chile/Cyanolux/Modelling
From 2012.igem.org
Juan Alamos (Talk | contribs) |
Juan Alamos (Talk | contribs) |
||
| Line 79: | Line 79: | ||
<h1>Applying the model: Synechocystis promoters</h1> | <h1>Applying the model: Synechocystis promoters</h1> | ||
| - | We applied our model to solve the question of which promoters should we use to meet our | + | We applied our model to solve the question of which promoters should we use to meet our [https://2012.igem.org/Team:UC_Chile/Cyanolux/Project_short#Strategy strategy goals] |
The results are shown below: | The results are shown below: | ||
| - | |||
| - | |||
| - | |||
| - | |||
| - | |||
| - | |||
| - | |||
| - | |||
| - | |||
| - | |||
| - | |||
| - | |||
| - | |||
| - | |||
| - | |||
| - | |||
| - | |||
| - | |||
| - | |||
| - | |||
| - | |||
| - | |||
Promoter Peak hour | Promoter Peak hour | ||
| Line 167: | Line 145: | ||
MatLab result | MatLab result | ||
| - | + | Finally we had the protein concentrations at different times | |
| - | + | ||
| - | + | ||
| - | Finally we | + | |
| Line 178: | Line 153: | ||
[[UC-chileDiffs.m]] | [[UC-chileDiffs.m]] | ||
| - | + | This combination of promoters was the one that best fits our strategy: Maximize substrate concentration during dusk hours | |
| - | + | ||
| - | + | ||
| - | + | ||
| - | + | ||
| - | + | ||
| - | + | ||
| - | + | ||
| - | + | ||
| - | + | ||
| - | + | ||
| - | + | ||
| - | + | ||
| - | + | ||
| - | + | ||
| - | + | ||
[[File:ucchile111111.png|500px|center]] | [[File:ucchile111111.png|500px|center]] | ||
Revision as of 03:49, 27 October 2012

Contents |
Why Modelling?:
Synechocystis transcriptional circadian oscillation makes it an exceptional chassis if time control of synthetic metabolic processes is desired. Nevertheless, the functionality of some of these processes depends upon precise timing. While there are hundreds of genes known to oscillate in Synechocystis genome -each with its own peak, strenght and amplitude- it can be tricky to choose the right ones. Here is where our modeling approach comes on stage.
Model Overview:
Model Application
Our model works as a user-friendly black box. The user´s input is the desired time of protein concentration peak and the program´s output is a list of suggested promoters. It can be adjusted to take as input the time on which enzymatic products concentration peaks , or to maximize an intermediate metabolite that depends not just on production but also consumption. Finally, its logical design can be applied to any other organism that exhibits circadian oscillation.

What´s inside the box?

The microarray data points were adjusted by a least squares algorithm into sine functions for each promoter.

Where k, theta and y are parameters to adjust. x is protein concentration
This equation accounts for protein production and its included into this form of universal balance equation:
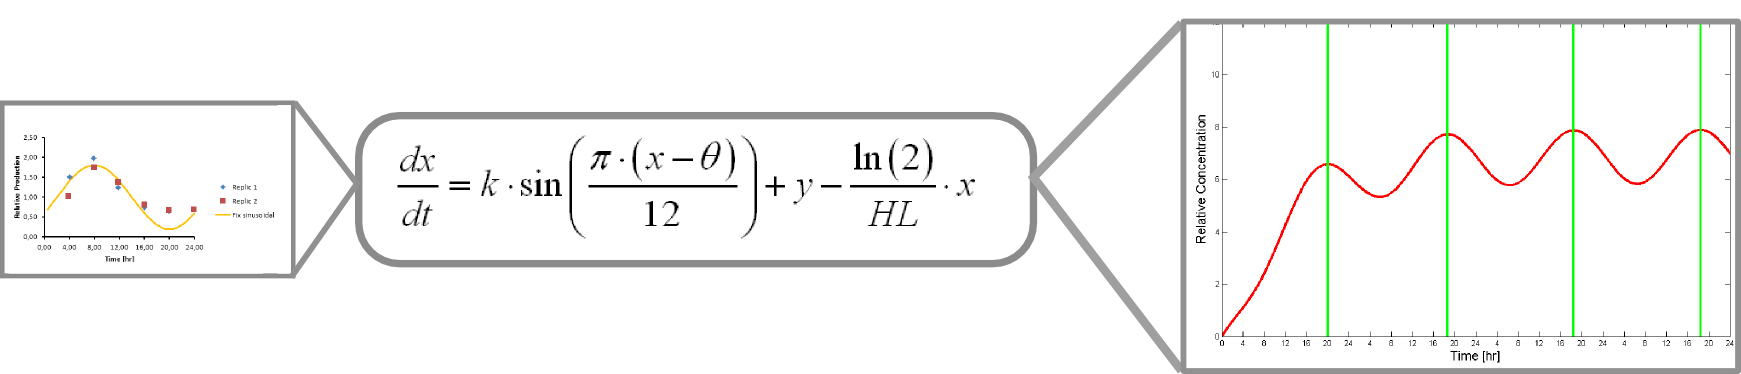
Where HL is protein´s half life
The resulting plot of this equation predicts protein concentration over time.
As a complement, we developed a list of relative promoter strengths. We took one promoter present in all datasets to make a relative scale, then, we transformed it to an absolute scale using a promoter quantitatively characterized in literature by comparing it to the relative scale promoter.
Extended Model
The approach can be extended to consider as input the product of the protein enzymatic activity instead of the protein itself.
Moreover, it can be adjusted to a two-protein model in which protein 1 produces the metabolite and protein 2 consumes it.
Applying the model: Synechocystis promoters
We applied our model to solve the question of which promoters should we use to meet our strategy goals
The results are shown below:
Promoter Peak hour
PsigE 8
Pta 14
Paa3 9
So, the protein generation models for each of the promoters are:
sigE production=0,8028*sen(π(t-2)/12)+1

Pta production=0,6246*sen(π(t-8)/12)+1

Pcaa3 production=0,9493*sen(π(t-3)/12)+1

Solving ODE’s
Assumptions: reaction only depends on promoter activity. Protein half life expression of 8 hours.
LuxAB concentrations
We start with the fundamental balance law:
Entries-exits+generation-consumption= accumulation
As there is no entries nor exits (closed system) the expression becomes
Generation-consumption= accumulation
For LuxAB we know
Generation= k_1*sen((π*(t-8))/12)+1 (obtained above)
Consumption=ln(2)/t_m *X(t)
Equation to solve
dX/dt=k_1*sen((π*(t-8))/12)+1-ln(2)/t_m *X(t)
Using Matlab to solve this ODE
For LuxCDEG
Generation=k2*sen((π*(t-2))/24)+1
Consumption=ln(2)/t_m *Y(t)
Equation to solve
dY/dt=k_1*sen((π*(t-8))/12)+1-ln(2)/t_m *Y(t)
MatLab result
Finally we had the protein concentrations at different times
The files for the following models are:
This combination of promoters was the one that best fits our strategy: Maximize substrate concentration during dusk hours


