|
|
| Line 33: |
Line 33: |
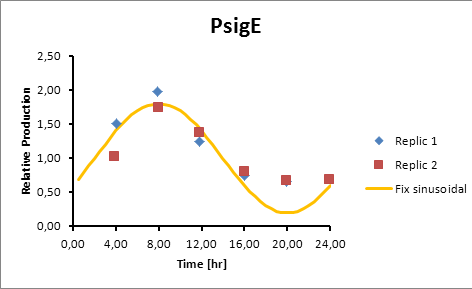
| | sigE production=0,8028*sen(π(t-2)/12)+1 | | sigE production=0,8028*sen(π(t-2)/12)+1 |
| | | | |
| - | [[File:sigeprodction.jpg]] | + | [[File:sigeprodction.jpg|center]] |
| | | | |
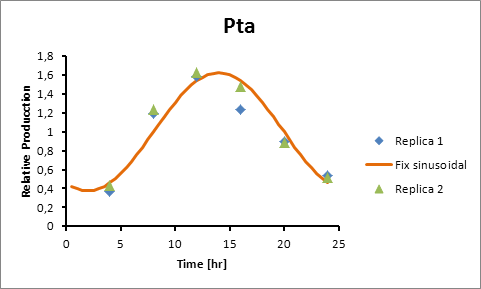
| | Pta production=0,6246*sen(π(t-8)/12)+1 | | Pta production=0,6246*sen(π(t-8)/12)+1 |
| | | | |
| - | [[File:ptaproductoihj.jpg]] | + | [[File:ptaproductoihj.jpg|center]] |
| | | | |
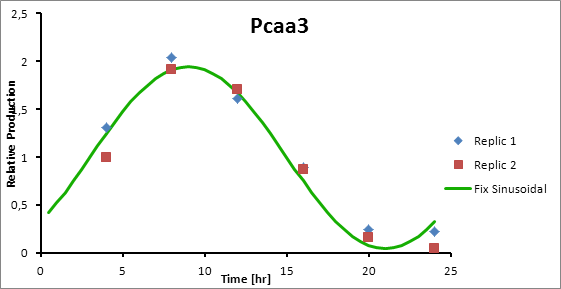
| | Pcaa3 production=0,9493*sen(π(t-3)/12)+1 | | Pcaa3 production=0,9493*sen(π(t-3)/12)+1 |
| | | | |
| - | [[File:pcaa3production.jpg]] | + | [[File:pcaa3production.jpg|center]] |
| | | | |
| | <font size="3">Solving ODE’s</font> | | <font size="3">Solving ODE’s</font> |
| Line 99: |
Line 99: |
| | | | |
| | | | |
| - | [[File:ucchile111111.png|500px]] | + | [[File:ucchile111111.png|500px|center]] |
| | | | |
| - | [[File:222222.png|500px]] | + | [[File:222222.png|500px|center]] |
| | | | |
| - | [[File:33333333.png|500px]] | + | [[File:33333333.png|500px|center]] |
| | | | |
| - | [[File:444444.png|500px]] | + | [[File:444444.png|500px|center]] |
| | | | |
| - | [[File:555555.png|500px]] | + | [[File:555555.png|500px|center]] |
| | | | |
| - | [[File:666666.png|500px]] | + | [[File:666666.png|500px|center]] |
| | | | |
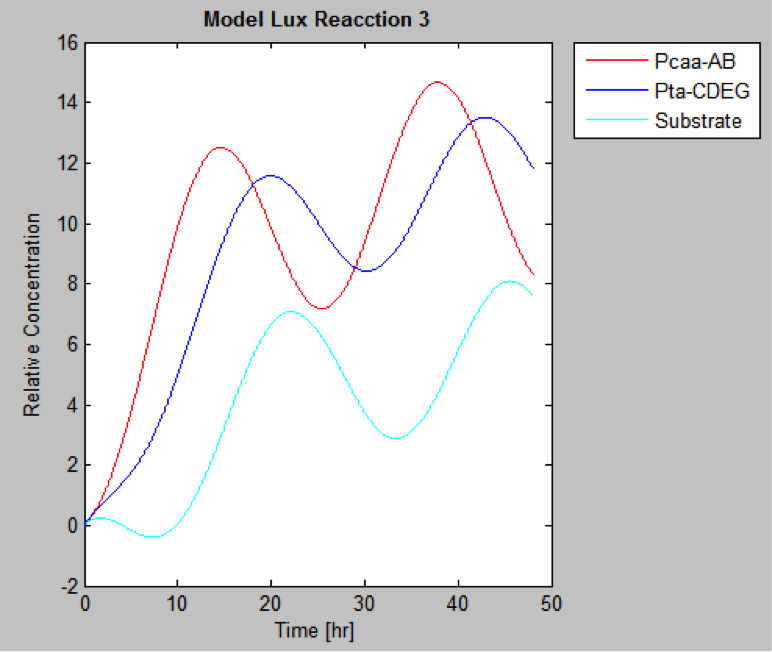
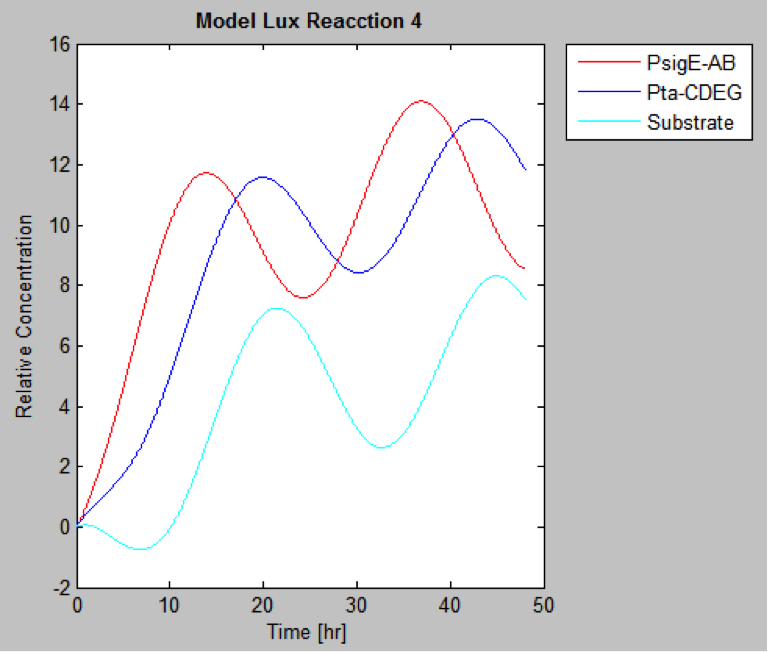
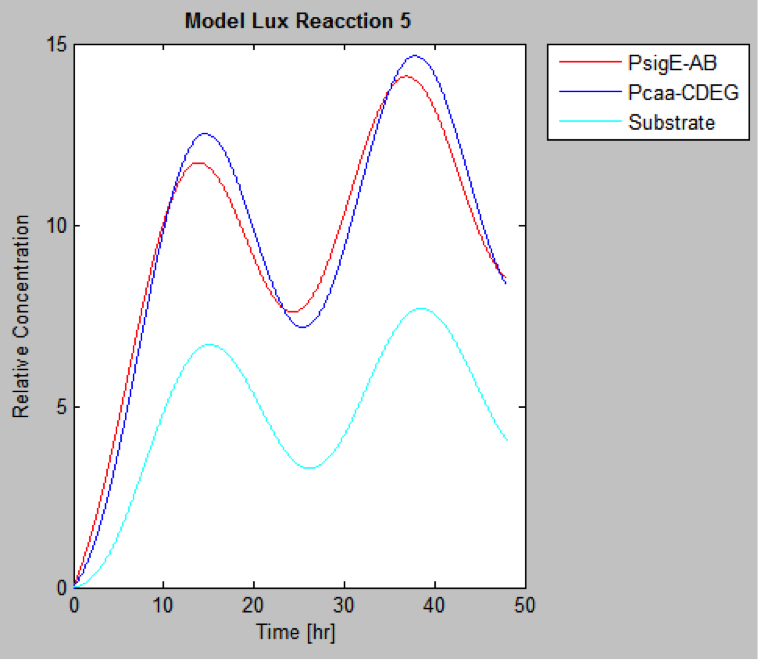
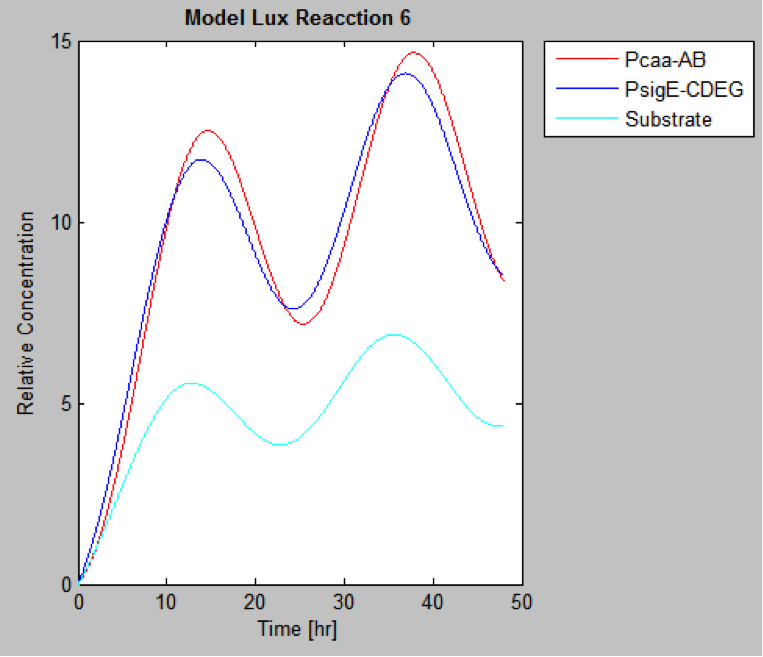
| | And this is the best model because it yields highest substrate concentration at the desired time (12 hr) | | And this is the best model because it yields highest substrate concentration at the desired time (12 hr) |

Why?
To express circadian under circadian oscillation it was essential to identify the ideal promoters that can yield highest substrate concentrations at the exact time our biolamp is on i.e. by night.
Based on literature (ref) we found that suitable promoters to start our model were sigE (sll1689), Transaldolase (slr1793) and Cytochrome aa3 (sll1898).
Therefore, in the following section we explain how to model the oscillation in product generation under three circadian promoters: sigE (sll1689), Transaldolase (slr1793) and Cytochrome aa3 (sll1898).
Methodology
Product generation by promoter
From known sigE (sll1689) production data we could build up a model using MatLab software. (Please check our script!).
Basically, what we have after data adjustment is a sine function consistent with the oscillatory nature of the circadian rhythm.
Generation = C*sen(2π(t-(peak-6))/12)+1
The C parameter was optimized using Excel Solver’s algorithm of least squares.
For Transaldolase (slr1793) and Cytochrome aa3 (sll1898) a microarray data was adjusted (using the same algorithm of least squares) to obtain:
Promoter Peak hour
PsigE 8
Pta 14
Paa3 9
So, the protein generation models for each of the promoters are:
sigE production=0,8028*sen(π(t-2)/12)+1
Pta production=0,6246*sen(π(t-8)/12)+1
Pcaa3 production=0,9493*sen(π(t-3)/12)+1
Solving ODE’s
Assumptions: reaction only depends on promoter activity.
Protein half life expression of 8 hours.
LuxAB concentrations
We start with the fundamental balance law:
Entries-exits+generation-consumption= accumulation
As there is no entries nor exits (closed system) the expression becomes
Entries-exits+generation-consumption= accumulation
For LuxAB we know
Generation= k_1*sen((π*(t-8))/12)+1 (obtained above)
Consumption=ln(2)/t_m *X(t)
Equation to solve
dX/dt=k_1*sen((π*(t-8))/12)+1-ln(2)/t_m *X(t)
Using Matlab to solve this ODE
For LuxCDEG
Generation=k2*sen((π*(t-2))/24)+1
Consumption=ln(2)/t_m *Y(t)
Equation to solve
dY/dt=k_1*sen((π*(t-8))/12)+1-ln(2)/t_m *Y(t)
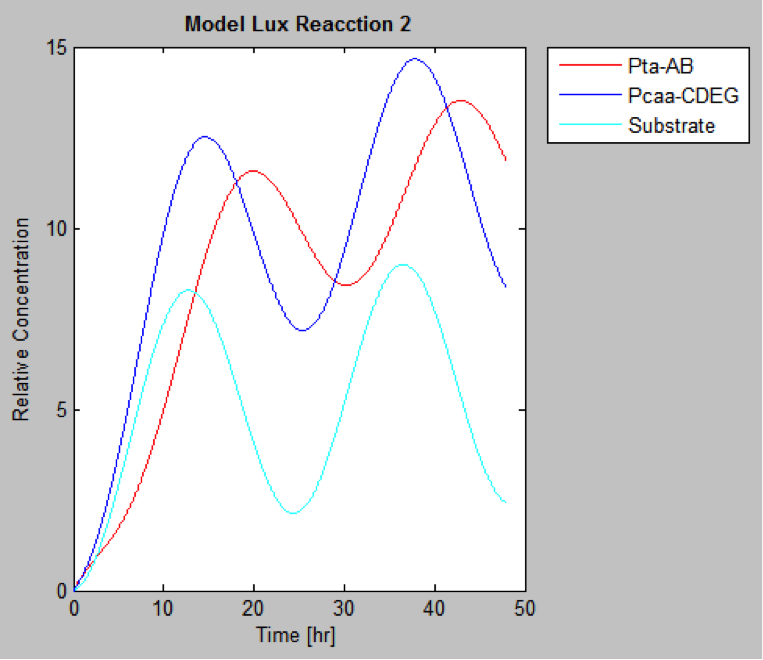
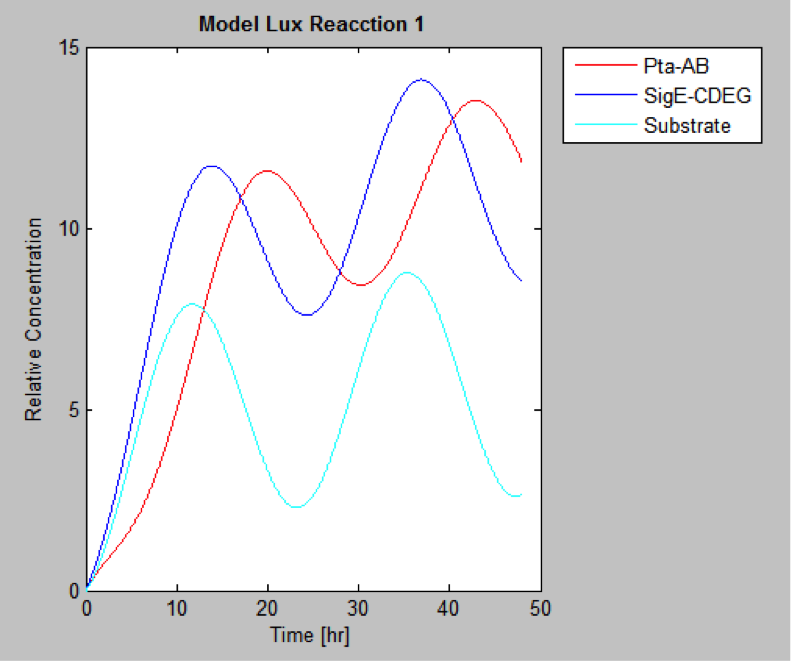
MatLab result
Finally we have the protein concentrations at different times
The files for the following models are:
Digitize2.m
UC-chileDiffs.m
The following are the models we obtained by MatLab
And this is the best model because it yields highest substrate concentration at the desired time (12 hr)

 "
"

