"
"
Team:TU-Delft/informationtheory
From 2012.igem.org
Revision as of 20:07, 20 December 2012 by MennoWitteveen (Talk | contribs)


Introduction
Signaling pathways and genetic circuitry have the capacity to transmit and process information about certain states in the environment. They are used by the cell to make decisions about whether to take certain actions to remain well adapted. Until now we have used models to describe these dynamics with the goal of eventually having enough insight into the systems so we can actually engineer them.Because of the apparent random nature of many biochemical systems interest in stochastic modeling has increased over the years. Complex stochastic biochemical pathways can now be simulated and models keep coming closer to reality. The only problem is that we as users of these models do not have many tools to evaluate the stochastic output of these system. A new tool that would be useful in our case is an objective way to assess the information processing capacity of our system. The right way to asses this would be at the single cell level as this is the environment were our circuit actually functions. Therefore we used single cell imaging to acquire data to assess the processed information from input to output or put different: From signal to response. This information flow can be described with the following equation.

Using this data we determine the mutual information in the yeast pheromone cascade from signal to response. The mutual signal/response information can then be expressed in one clarifying number: the BioBit.

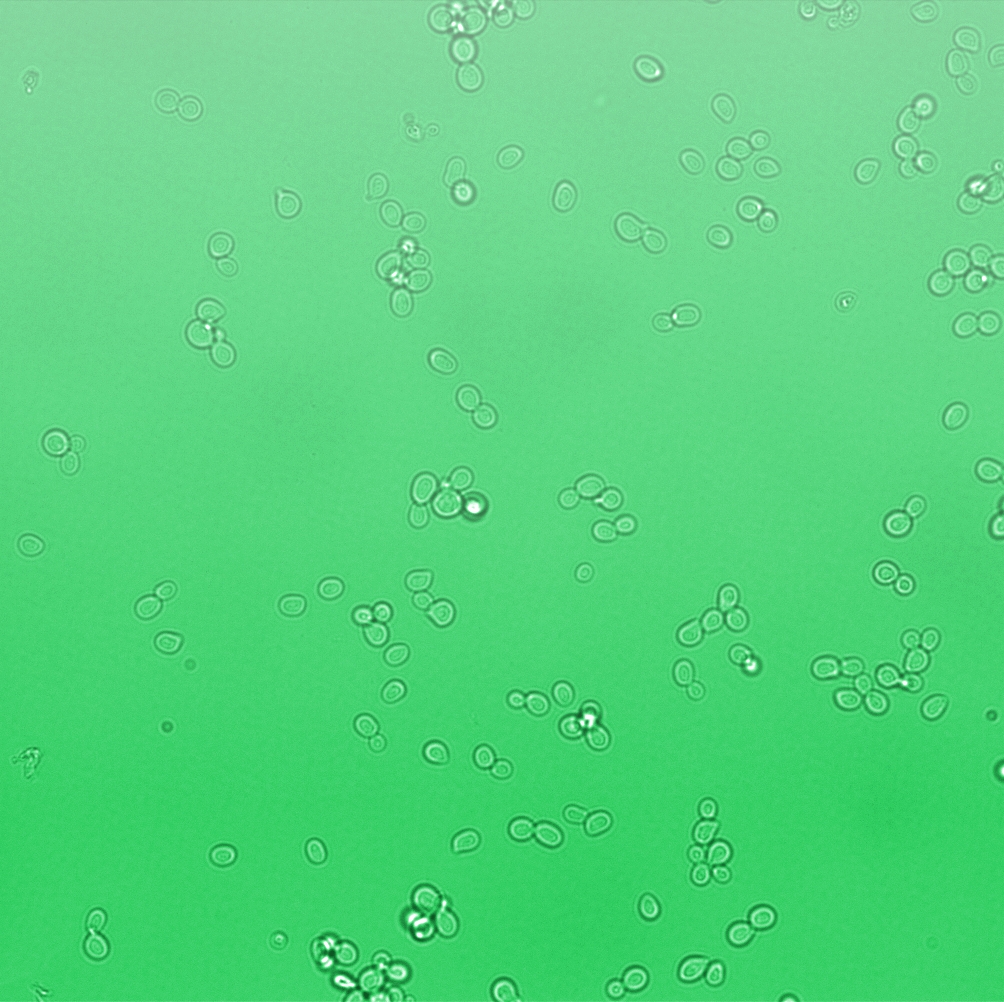
The BioBit is a number that represents the length of a string of ones and zeros in which information can be encoded, thus quantifying the amount of information a certain biological system can process. As described in the reporter section, data from single cells was gathered by a Robotic High-through-put Fluorescence Microscopy Setup. This enabled us to also assess the temporal dynamics of single cells which is also useful for validating cellular stochastic models of the yeast pheromone cascade. Below a picture is shown which indicates the problem on a single cell level. How many values can the cell distinguish? This is what the biobit value quantifies

The above picture and the idea orginated from Cheong et al. 2011 Using this approach we could also determine the temporal dynamics of the information processing capacity for many time points. With this data we could also analyze the maximum response for individual cells and thereby getting more insight into the system than would be possible with flow cytometry.
Result
Because temporal fluorescence optimal did occur in a relatively small time period the fluorescence was determined at the mean experimental maximum of t = 3.5 h.
The concentrations 1t/m8 are:
1: 300µm / 2: 100µm / 3: 30µm / 4: 10µm / 5: 3µm / 6: 1µm / 7: 0,3 µm / 8: 0 µm respectively.
On the vertical axis one can see the cell count and on the horizontal axis this fluorescence in arbitrary units is shown. This data was generated by High-throughput microscopy with automated cell annotation by the V-Cell ID software. The data was analysed in MATLAB according to the computational methods of Cheong et al. 2011.
Conclusion
Eventually we used this data to compute the information bitvalue to get BioBit for the yeast pheromone cascade. This value was calculated to be '0.6' equal to 2^0.6=1.51 detectable values on the single cell level. In the future this technique can be used to classify and evaluate the information processing capacity of genetic circuits.References
[1] Raymond Cheong, Alex Rhee, Chiaochun Joanne Wang, Ilya Nemenman, Andre Levchenko. Information Transduction Capacity of Noisy Biochemical Signaling Networks, Science. (2011)