Team:SUSTC-Shenzhen-B/lab results

From 2012.igem.org

(Difference between revisions)
 
Line 400: Line 400:
                                     <li><a href="https://2012.igem.org/Team:SUSTC-Shenzhen-B/introduction">Overview</a></li>
                                     <li><a href="https://2012.igem.org/Team:SUSTC-Shenzhen-B/introduction">Overview</a></li>
                                     <li><a href="https://2012.igem.org/Team:SUSTC-Shenzhen-B/algorithm">Algorithm</a></li>
                                     <li><a href="https://2012.igem.org/Team:SUSTC-Shenzhen-B/algorithm">Algorithm</a></li>
-
                                     <li><a href="https://2012.igem.org/Team:SUSTC-Shenzhen-B/achievements">Achievements</a></li>
+
                                     <li><a href="https://2012.igem.org/Team:SUSTC-Shenzhen-B/achievements">Results</a></li>
                                     <li><a href="https://2012.igem.org/Team:SUSTC-Shenzhen-B/Download">Download</a></li>
                                     <li><a href="https://2012.igem.org/Team:SUSTC-Shenzhen-B/Download">Download</a></li>
                                     <li><a href="https://2012.igem.org/Team:SUSTC-Shenzhen-B/comment">Comment</a></li>
                                     <li><a href="https://2012.igem.org/Team:SUSTC-Shenzhen-B/comment">Comment</a></li>

Latest revision as of 21:18, 26 October 2012

Title

Result


1. Fluorescence microscope results

Our plasmid design contains a RFP and GFP. Fluorescence microscope pictures Figure 1 shows that GFP is expressed.

(Figure 1 Those bacteria who express GFP is seen under the fluorescence microscope activated by 488nm light.The picture shows the expression of the GFP. )

2.Flow cytometry results

Figure2-a

Figure2-b

Flow cytometry results of GFP expression in experiment group Figure2-a and control group Figure2-b.The average GFP fluorescence strength of control group is 432 unit and of experiment group is 251 unit. Therefore, the terminator efficiency is 251/432=0.58

3.Agreement with theoretical prediction

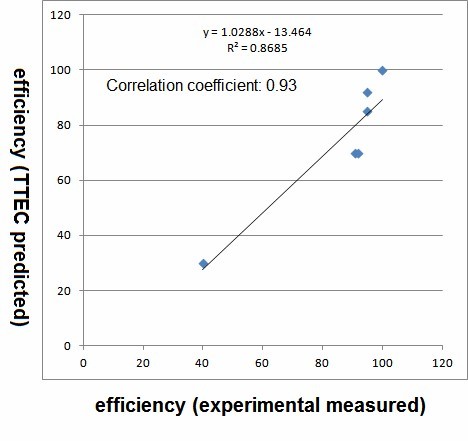
(Figure 3 The horizontal ordinate represents the value of efficiencies measured by experiment. The vertical ordinate represents the value of efficiencies predicted by TTEC. We can see a good agreement between experimental efficiency and TTEC predicted efficiency.)

(Figure 4 Here listed the sequences of terminator whose efficiencies are measured in the lab.)