|
|
| (2 intermediate revisions not shown) |
| Line 400: |
Line 400: |
| | <li><a href="https://2012.igem.org/Team:SUSTC-Shenzhen-B/introduction">Overview</a></li> | | <li><a href="https://2012.igem.org/Team:SUSTC-Shenzhen-B/introduction">Overview</a></li> |
| | <li><a href="https://2012.igem.org/Team:SUSTC-Shenzhen-B/algorithm">Algorithm</a></li> | | <li><a href="https://2012.igem.org/Team:SUSTC-Shenzhen-B/algorithm">Algorithm</a></li> |
| - | <li><a href="https://2012.igem.org/Team:SUSTC-Shenzhen-B/achievements">Achievements</a></li> | + | <li><a href="https://2012.igem.org/Team:SUSTC-Shenzhen-B/achievements">Results</a></li> |
| | <li><a href="https://2012.igem.org/Team:SUSTC-Shenzhen-B/Download">Download</a></li> | | <li><a href="https://2012.igem.org/Team:SUSTC-Shenzhen-B/Download">Download</a></li> |
| | <li><a href="https://2012.igem.org/Team:SUSTC-Shenzhen-B/comment">Comment</a></li> | | <li><a href="https://2012.igem.org/Team:SUSTC-Shenzhen-B/comment">Comment</a></li> |
| Line 481: |
Line 481: |
| | <p>Flow cytometry results of GFP expression in experiment group Figure2-a and control group Figure2-b.The average GFP fluorescence strength of control group is 432 unit and of experiment group is 251 unit. Therefore, the terminator efficiency is 251/432=0.58</p> | | <p>Flow cytometry results of GFP expression in experiment group Figure2-a and control group Figure2-b.The average GFP fluorescence strength of control group is 432 unit and of experiment group is 251 unit. Therefore, the terminator efficiency is 251/432=0.58</p> |
| | <h3 class="STYLE2"><font face="Arial, Helvetica">3.Agreement with theoretical prediction</font></h3> | | <h3 class="STYLE2"><font face="Arial, Helvetica">3.Agreement with theoretical prediction</font></h3> |
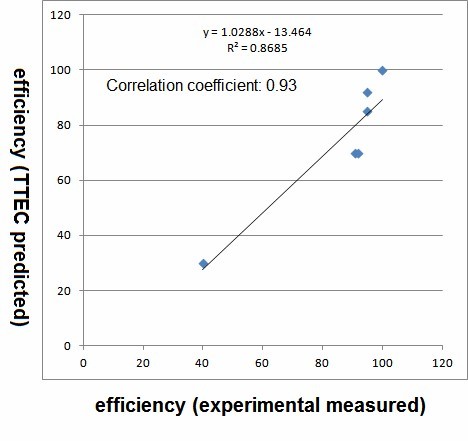
| - | <p class="STYLE3"><span class="STYLE2"><img src=" https://static.igem.org/mediawiki/2012/d/d6/92.png" class="img_fl img_border" //font /></span></p> | + | <p class="STYLE3"><span class="STYLE2"><img src="https://static.igem.org/mediawiki/2012/d/d5/Labresult.jpg" class="img_fl img_border" //font /></span></p> |
| - | <p class="STYLE3">(Figure 3 According to our experiment measured terminator efficiencies and our software predicted dscores, we create fit curve to relate all the data . To correspond to the figure 3, we choose linear fit curve to link all the data. There are 5 valuable points of terminator efficiencies. The sequences are listed below. In the experiment, we transform 9 terminators to plasmid mutant-psb1a3-GF and only get 5 reliably terminators’ data. The points appeared on the figure are terminators whose number is 1,4,6,7,8 )</p> | + | <p class="STYLE3">(Figure 3 The horizontal ordinate represents the value of efficiencies measured by experiment. The vertical ordinate represents the value of efficiencies predicted by TTEC. We can see a good agreement between experimental efficiency and TTEC predicted efficiency.)</p> |
| | <p class="STYLE4"><span class="STYLE2"><img src=" https://static.igem.org/mediawiki/2012/2/2b/94.png" class="img_fl img_border" //font /></span></p> | | <p class="STYLE4"><span class="STYLE2"><img src=" https://static.igem.org/mediawiki/2012/2/2b/94.png" class="img_fl img_border" //font /></span></p> |
| | <p class="STYLE3">(Figure 4 Here listed the sequences of terminator whose efficiencies are measured in the lab.)</p> | | <p class="STYLE3">(Figure 4 Here listed the sequences of terminator whose efficiencies are measured in the lab.)</p> |
 "
"