Team:SEU O China/Result/AddExperiment
From 2012.igem.org
| Line 9: | Line 9: | ||
<hr> | <hr> | ||
<br><br><br> | <br><br><br> | ||
| - | <div style="width: 600px; padding: 10px 100px | + | <div style="width: 600px; padding: 10px 100px 10px 200px;"> |
</html> | </html> | ||
| Line 24: | Line 24: | ||
We diluted the liquid cultrue of TBY, FtsZ and controls into the relatively identical level as their initial concentration. Those parts were all inserted in the pet-32a plasmids. After further dilution of TBY, FtsZ and controls into different level, we cultivated those bacteria on the surface of solid LB medium in 3 dfferent IPTG levels: 0.0mM, 0.5mM and 1.0mM. The conditions was strictly controlled at the temperature of 37 ℃ and it last for 14 hours. The controls aimed to rule out the possibility of damaged to the bacteria from IPTG. Details are illustrated here: | We diluted the liquid cultrue of TBY, FtsZ and controls into the relatively identical level as their initial concentration. Those parts were all inserted in the pet-32a plasmids. After further dilution of TBY, FtsZ and controls into different level, we cultivated those bacteria on the surface of solid LB medium in 3 dfferent IPTG levels: 0.0mM, 0.5mM and 1.0mM. The conditions was strictly controlled at the temperature of 37 ℃ and it last for 14 hours. The controls aimed to rule out the possibility of damaged to the bacteria from IPTG. Details are illustrated here: | ||
| - | + | <html></div><div align="center" ></html> | |
| - | + | {|class="wikitable" | |
| - | + | | IPTG(mM) || 0.0 || 0.5 (1.0 in Controls) || 1.0 (3.0 in Controls) | |
| - | + | ||
| - | + | ||
| - | <html></div></html> | + | |
| - | {| | + | |
| - | | IPTG(mM) || 0.0 || 0.5 || 1.0 | + | |
|- | |- | ||
| Ftsz || [[File:Seufig1.jpg|250px]] || [[File:Seufig2.jpg|250px]]|| [[File:Seufig3.jpg|250px]] | | Ftsz || [[File:Seufig1.jpg|250px]] || [[File:Seufig2.jpg|250px]]|| [[File:Seufig3.jpg|250px]] | ||
| Line 37: | Line 32: | ||
| TBY || [[File:Seufig4.jpg|250px]]|| [[File:Seufig5.jpg|250px]]|| [[File:Seufig6.jpg|250px]] | | TBY || [[File:Seufig4.jpg|250px]]|| [[File:Seufig5.jpg|250px]]|| [[File:Seufig6.jpg|250px]] | ||
|- | |- | ||
| - | | | + | | Controls || [[File:Seufig7.jpg|250px]] || [[File:Seufig8.jpg|250px]] || [[File:Seufig9.jpg|250px]] |
|} | |} | ||
| - | <html> | + | <html></div> |
<div style="width: 600px; padding: 10px 100px 60px 200px;"></html> | <div style="width: 600px; padding: 10px 100px 60px 200px;"></html> | ||
'''Discussion''' | '''Discussion''' | ||
| + | |||
| + | |||
Comparison from left to right at every line obviously presents the inhibition of FtsZ and TBY, which is much more evident that the [https://2012.igem.org/Team:SEU_O_China/Result#incontent previous experiment]. | Comparison from left to right at every line obviously presents the inhibition of FtsZ and TBY, which is much more evident that the [https://2012.igem.org/Team:SEU_O_China/Result#incontent previous experiment]. | ||
Latest revision as of 03:21, 27 September 2012


Additional Experiments
The Comparision Experiment between TBY and FtsZ
Differing from FtsZ, TBY contains a paired termini structure, which is said to be able to protect the mRNA from degradation. In this experiment, we want to figure out whether the paired termini works in this structure.
We design the comparision experiment below:
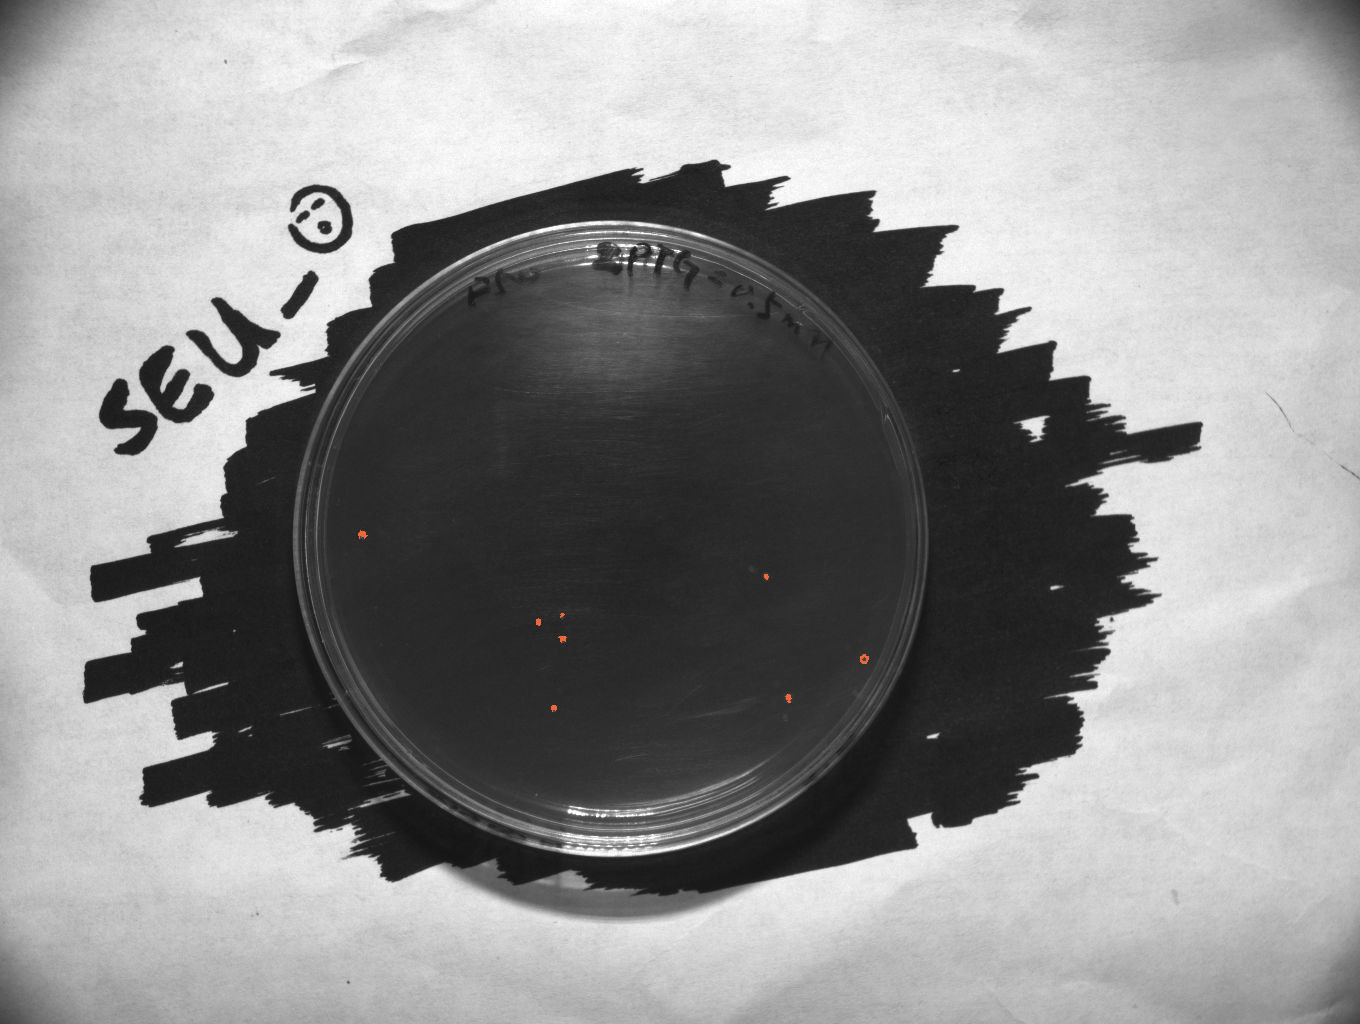
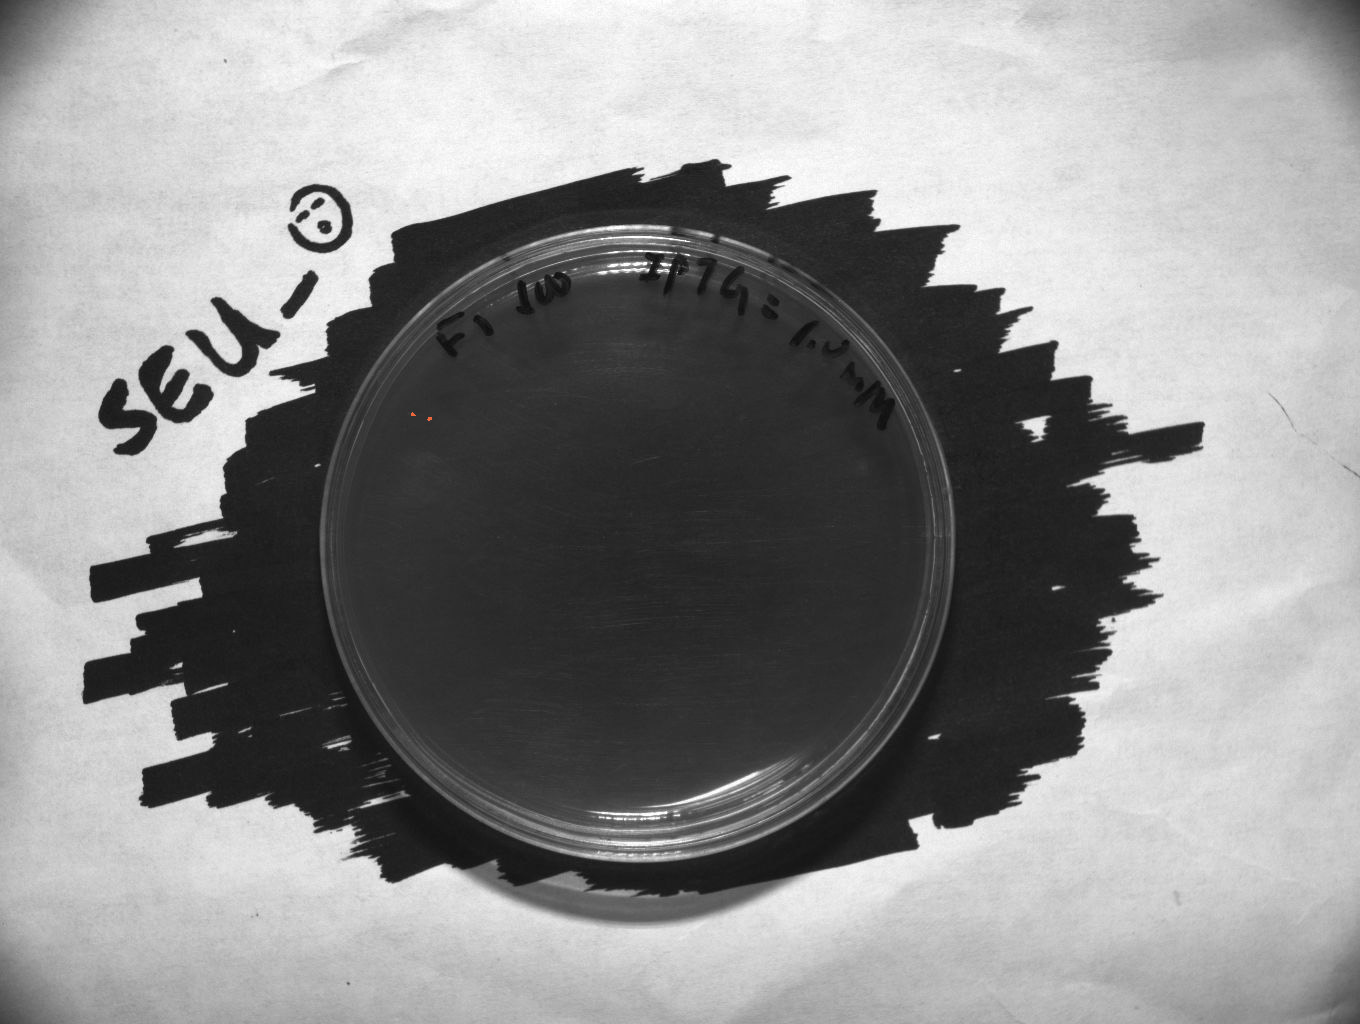
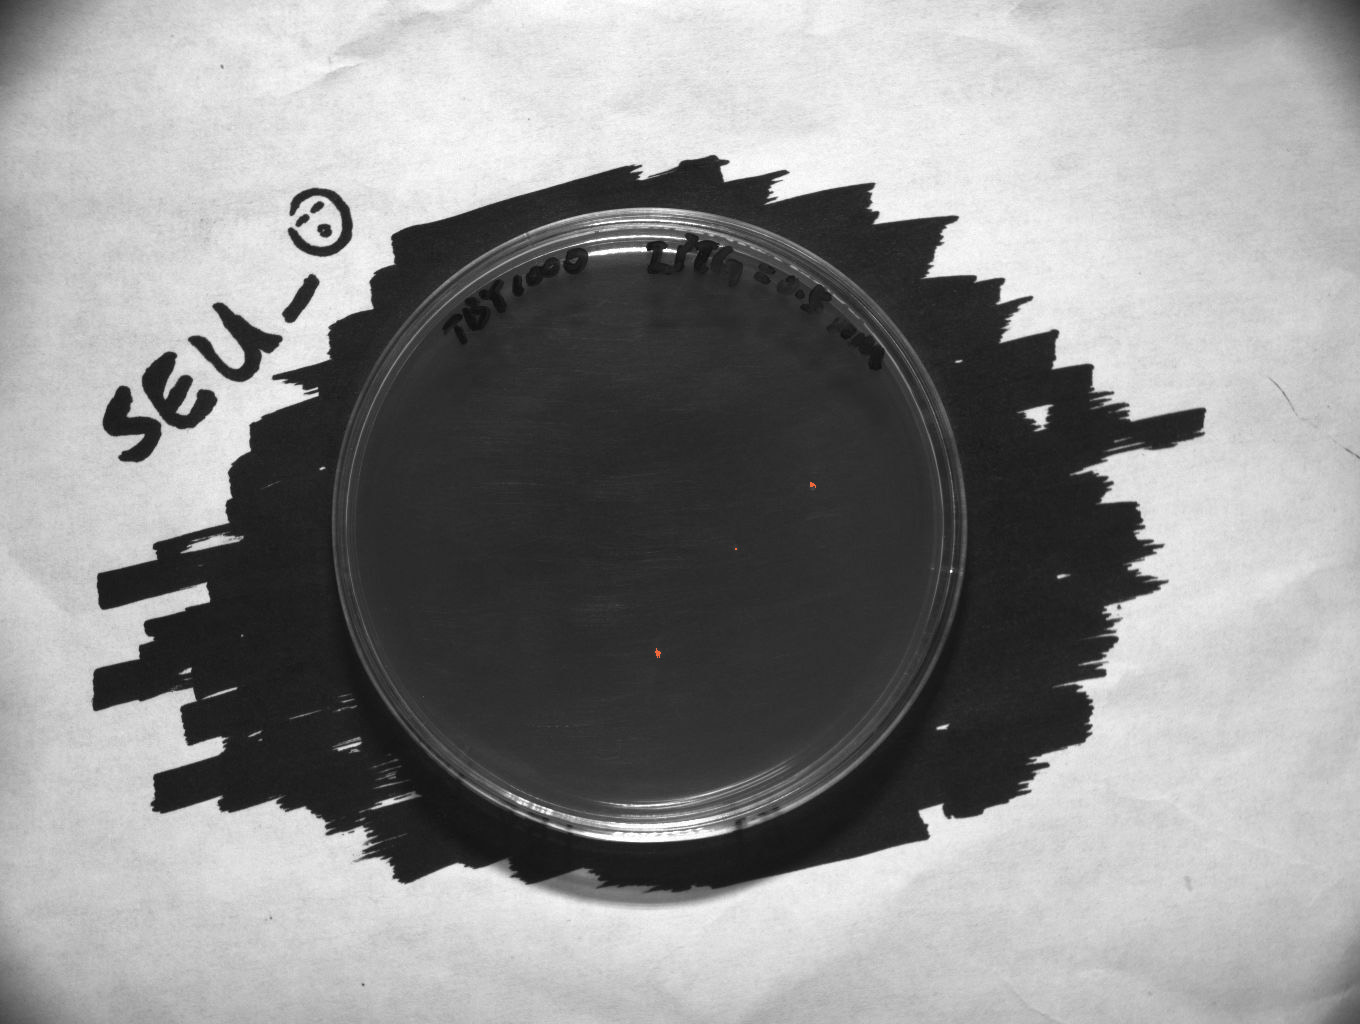
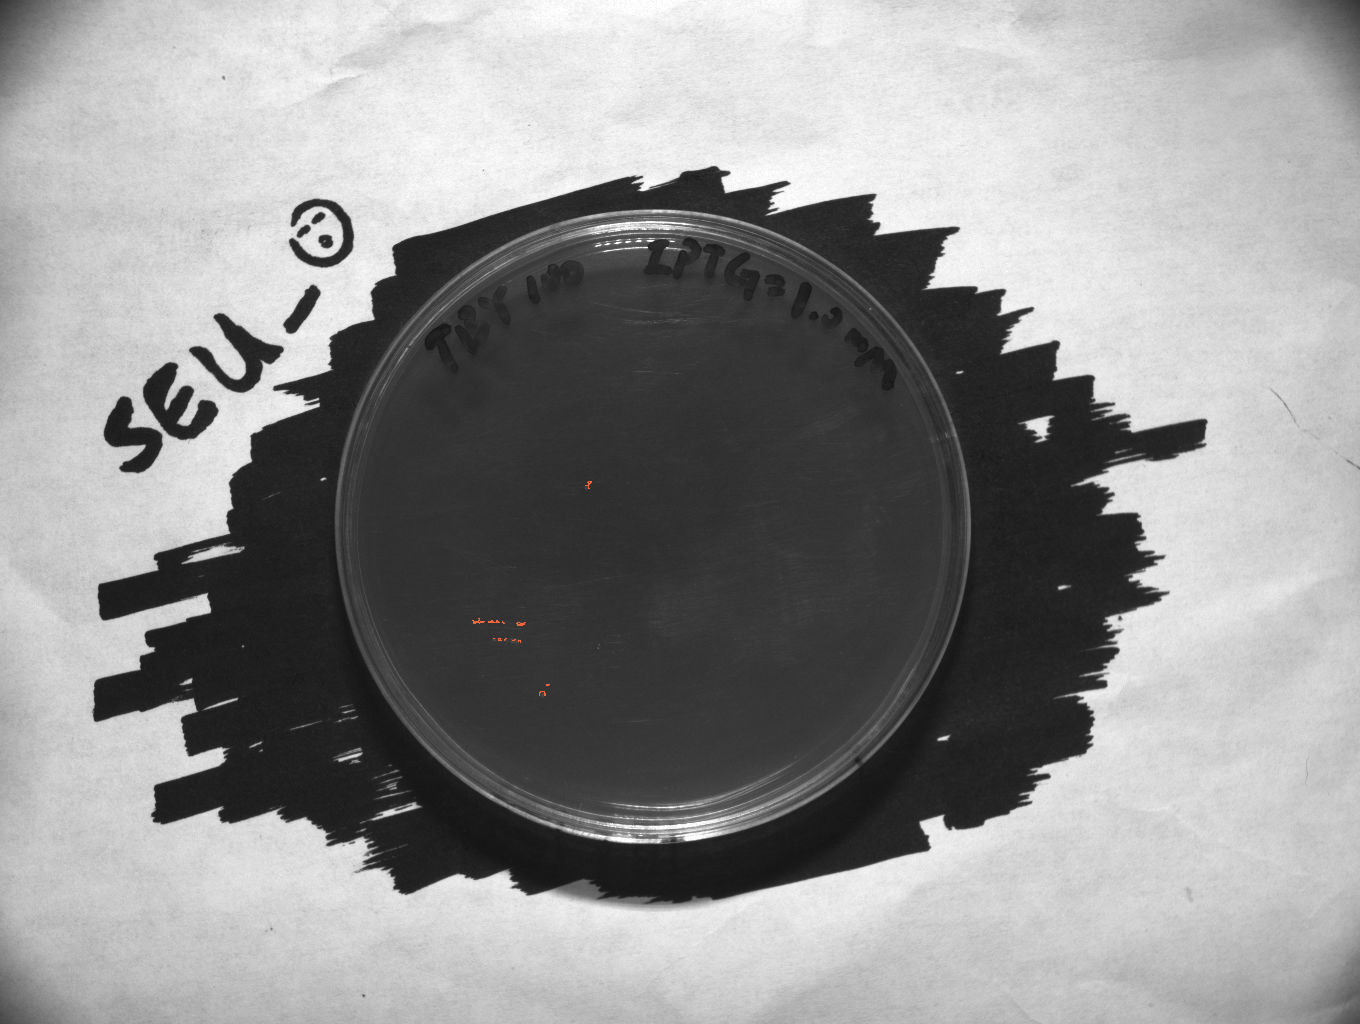
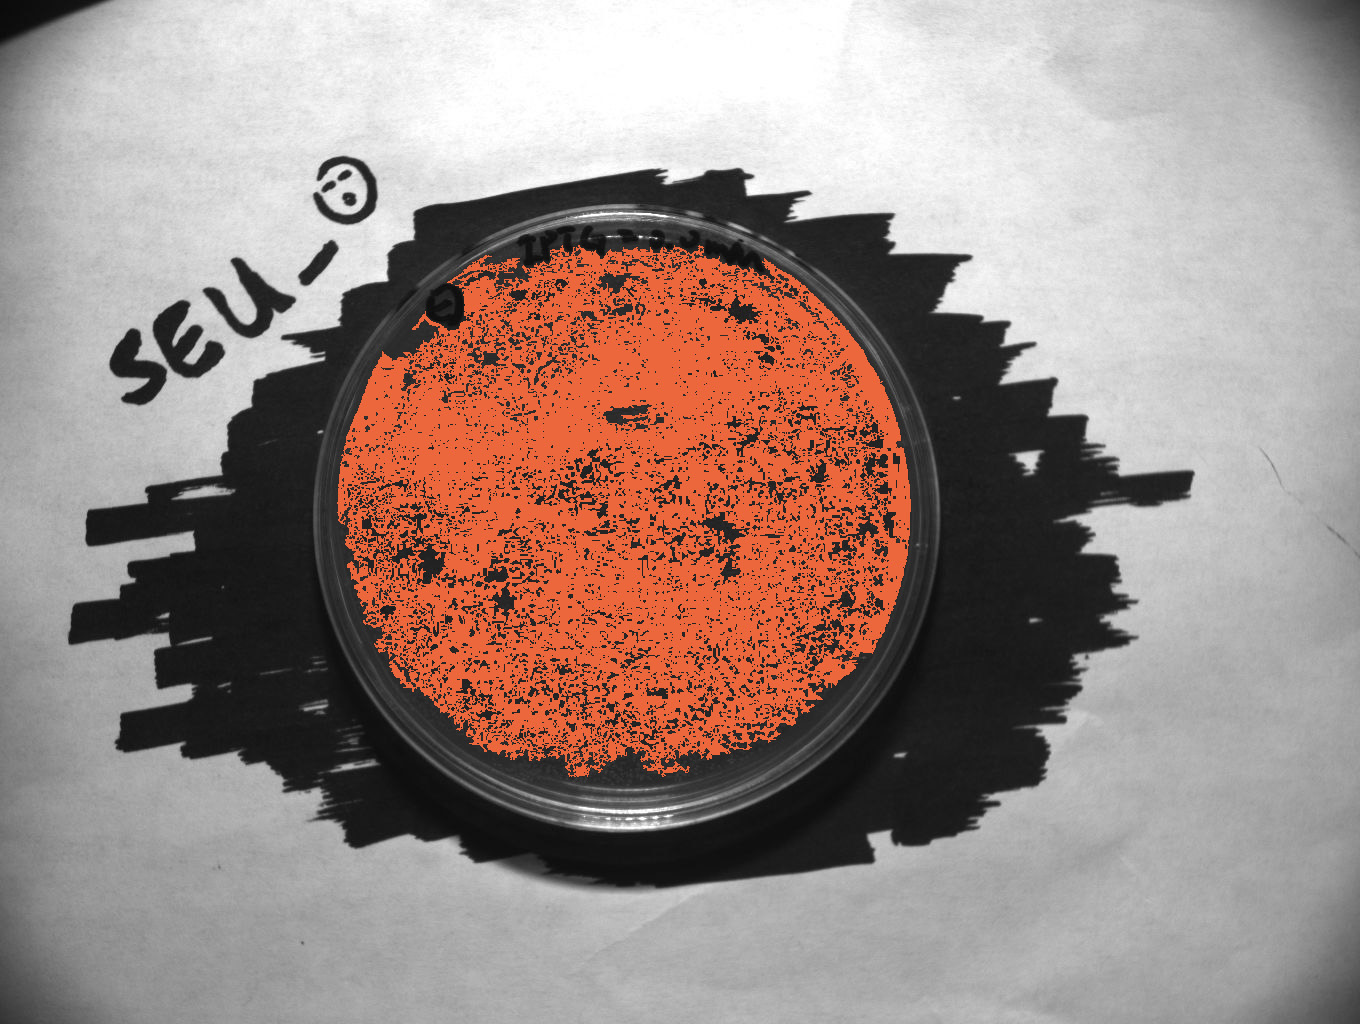
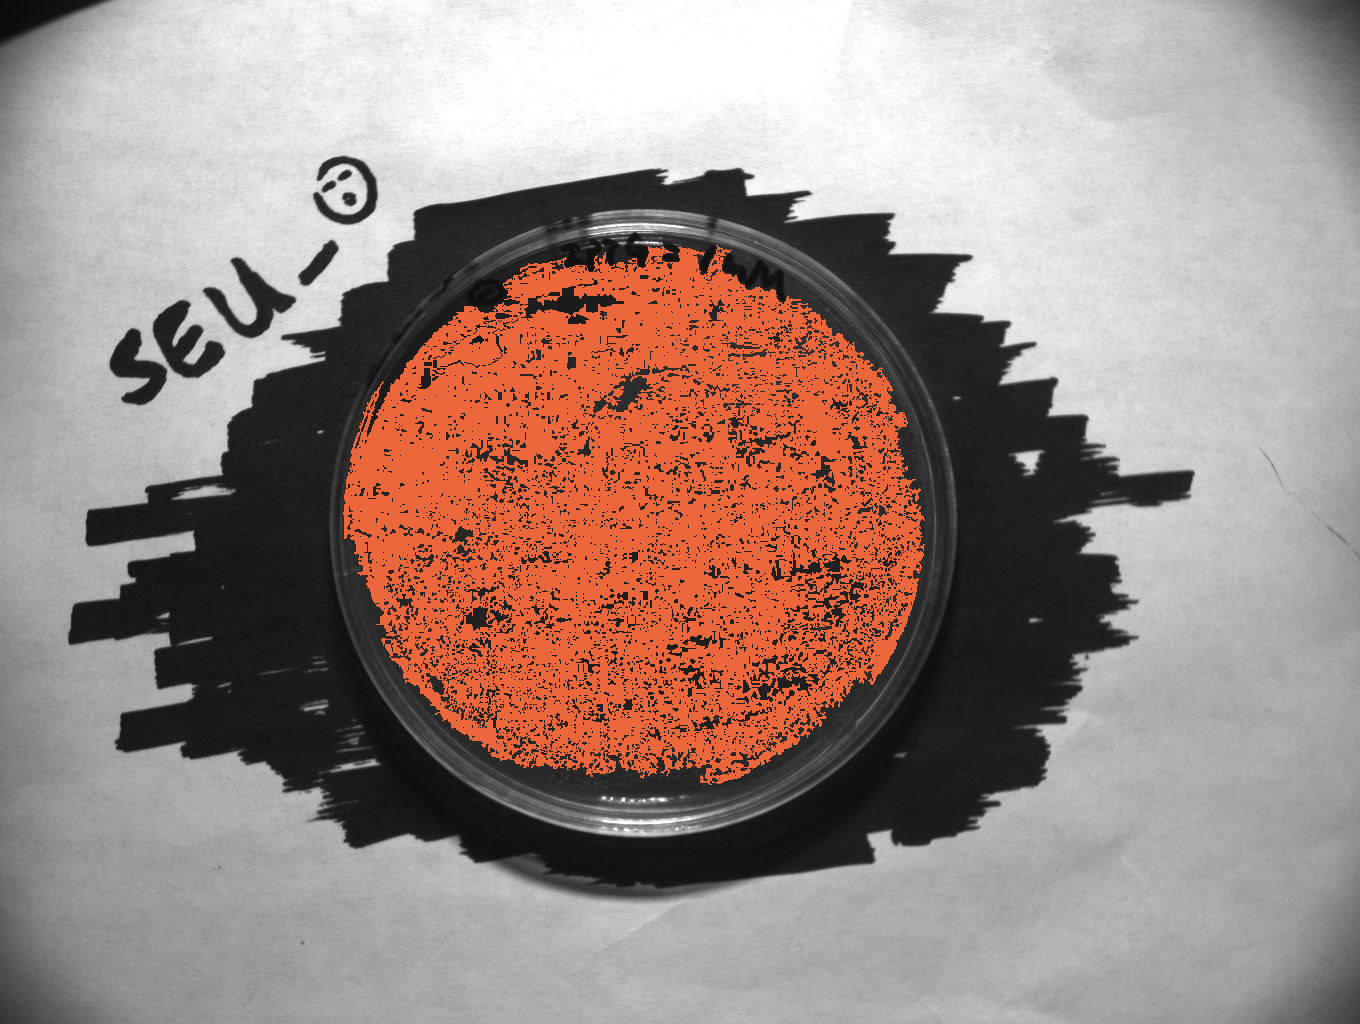
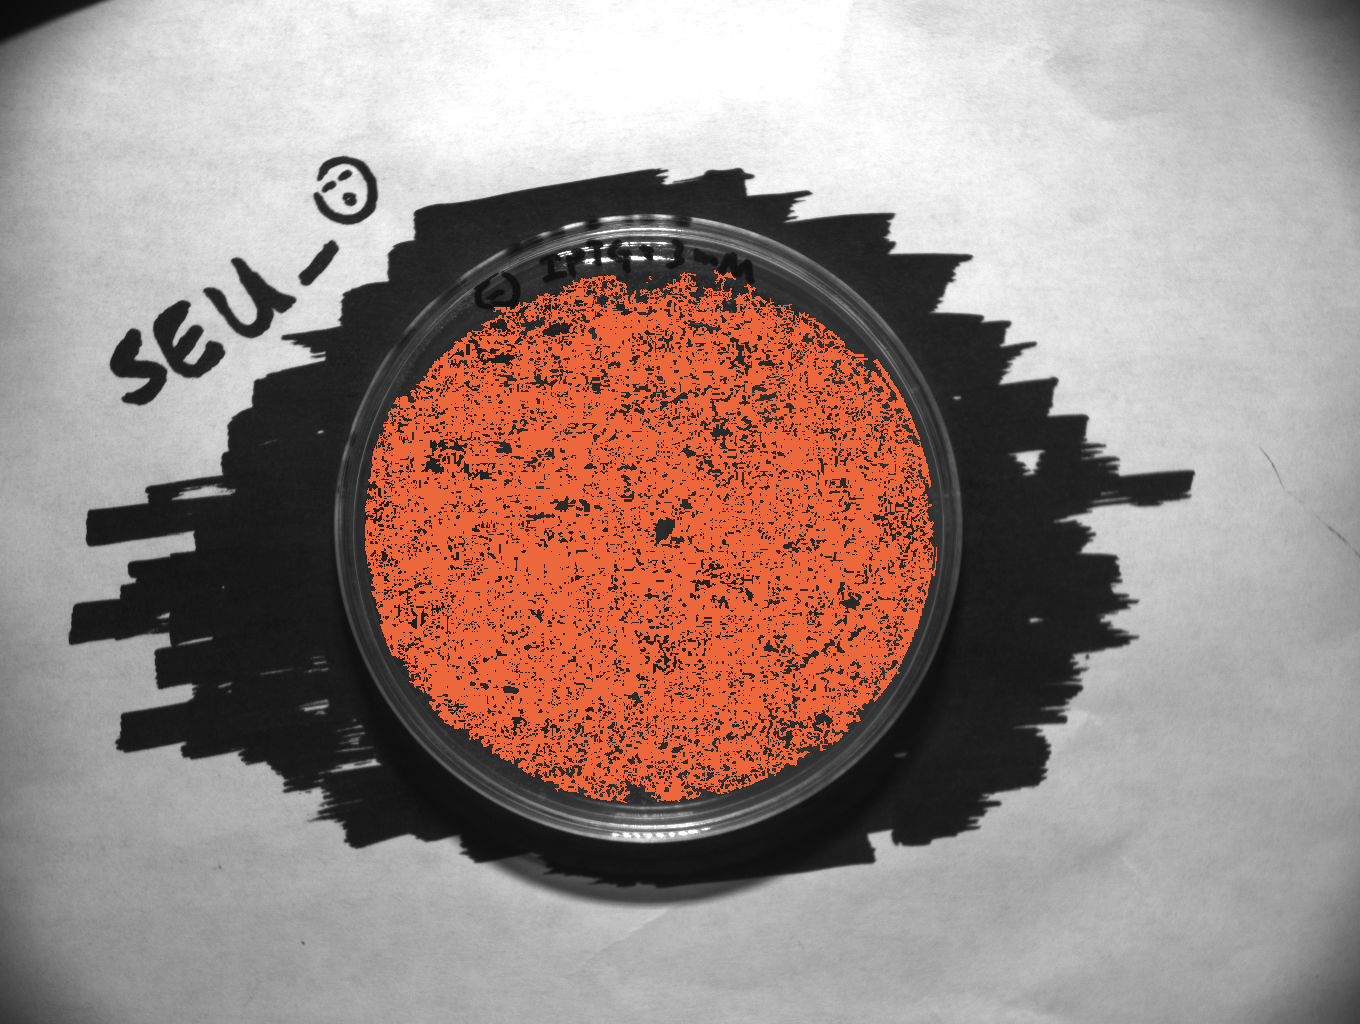
We diluted the liquid cultrue of TBY, FtsZ and controls into the relatively identical level as their initial concentration. Those parts were all inserted in the pet-32a plasmids. After further dilution of TBY, FtsZ and controls into different level, we cultivated those bacteria on the surface of solid LB medium in 3 dfferent IPTG levels: 0.0mM, 0.5mM and 1.0mM. The conditions was strictly controlled at the temperature of 37 ℃ and it last for 14 hours. The controls aimed to rule out the possibility of damaged to the bacteria from IPTG. Details are illustrated here:
Discussion
Comparison from left to right at every line obviously presents the inhibition of FtsZ and TBY, which is much more evident that the previous experiment.
Sadly, it shows limited difference when we compare the 3 figures from the top to the bottom at the IPTG level of 0.5mM and 1.0mM seperately. As the pet-32a is a relaxed plasmid with several copies in BL21(DE3) strains, it is hardly to tell the difference between FtsZ and TBY due to this experiments. We hope the further experiments, such as qRT-PCR, can figure out this problem.

 "
"
