 "
"
Team:NYMU-Taipei/ymiq5.html
From 2012.igem.org
| Line 82: | Line 82: | ||
<div align="left"> | <div align="left"> | ||
| - | <div class=out style='text-align:center'><img src=" | + | <div class=out style='text-align:center'><img src="https://static.igem.org/mediawiki/2012/0/0a/Ymiqw1.png" alt="" width="502" height="333" /><br /> |
<p align="center">Sulfite quinine reductase, SQR use hydrogen sulfide, H2S as electron resource to perform photosynthesis<br /> | <p align="center">Sulfite quinine reductase, SQR use hydrogen sulfide, H2S as electron resource to perform photosynthesis<br /> | ||
</p></div> | </p></div> | ||
| Line 88: | Line 88: | ||
<br /> | <br /> | ||
<br /> | <br /> | ||
| - | <div class=out style='text-align:center'><img src=" | + | <div class=out style='text-align:center'><img src="https://static.igem.org/mediawiki/2012/f/f2/Ymiqw2.png" alt="" width="398" height="314" /><br /> |
Cyanobacteria contain different of cytochrome. We can detect them by different wavelength fluorescent light.<br /> | Cyanobacteria contain different of cytochrome. We can detect them by different wavelength fluorescent light.<br /> | ||
( http://www.masa.asn.au/phpBB3/viewtopic.php?t=233828&p=960435 )<br /> | ( http://www.masa.asn.au/phpBB3/viewtopic.php?t=233828&p=960435 )<br /> | ||
| Line 100: | Line 100: | ||
<br /> | <br /> | ||
</p> | </p> | ||
| - | <div class=out style='text-align:center'><img src=" | + | <div class=out style='text-align:center'><img src="https://static.igem.org/mediawiki/2012/c/ce/Ymiqw3.png" alt="" width="434" height="334" /><br /> |
We culture Synechococcus sp. PCC7942 wildtype and sqr transformed one in BG-11 medium with suitable shaker. <br /> | We culture Synechococcus sp. PCC7942 wildtype and sqr transformed one in BG-11 medium with suitable shaker. <br /> | ||
<br /> | <br /> | ||
| Line 110: | Line 110: | ||
<p>Freshly made sodium sulfide containing medium was added into the experiment group. The concentration of sodium sulfide was 2.5 mM, and additional 2.5mM of sodium sulfide was added every 24 hours. 3-(3,4-dichlorophenyl)-1,1-dimethylurea (DCMU) [2], a chemical which can block photosystem II was also added into both experiment and control group. A positive control group was established by simply cultivated cyanobacteria in fresh medium. As followed, we analyze by flow cytometry analysis, 730 nm absorption assay and plating of bacteria. | <p>Freshly made sodium sulfide containing medium was added into the experiment group. The concentration of sodium sulfide was 2.5 mM, and additional 2.5mM of sodium sulfide was added every 24 hours. 3-(3,4-dichlorophenyl)-1,1-dimethylurea (DCMU) [2], a chemical which can block photosystem II was also added into both experiment and control group. A positive control group was established by simply cultivated cyanobacteria in fresh medium. As followed, we analyze by flow cytometry analysis, 730 nm absorption assay and plating of bacteria. | ||
| - | <br /><div class=out style='text-align:center'><img src=" | + | <br /><div class=out style='text-align:center'><img src="https://static.igem.org/mediawiki/2012/2/23/Ymiqw4.png" alt="" width="558" height="262" /><br /> |
DCMU specifically block photosynthesis system II<br /> | DCMU specifically block photosynthesis system II<br /> | ||
( http://5e.plantphys.net/article.php?ch=7&id=75 )<br /> | ( http://5e.plantphys.net/article.php?ch=7&id=75 )<br /> | ||
| Line 120: | Line 120: | ||
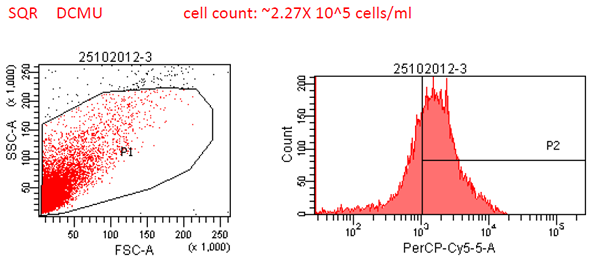
<p><span class="subtitle">Flow cytometry analysis </span></p> | <p><span class="subtitle">Flow cytometry analysis </span></p> | ||
</div> | </div> | ||
| - | <div class=out style='text-align:center'><img src=" | + | <div class=out style='text-align:center'><img src="https://static.igem.org/mediawiki/2012/2/28/Ymiqw5.png" alt="" width="475" height="361" /><br /> |
We use flow cytometry with multiple wavelength fluorescent light to find out the differences between two groups. <br /> | We use flow cytometry with multiple wavelength fluorescent light to find out the differences between two groups. <br /> | ||
<br /> | <br /> | ||
| Line 126: | Line 126: | ||
<p>The automation of viability analysis method via flow cytometer was reported in previous research [3]. In our experiment, cells were analyzed using a flow cytometer FACSCanto. The chlorophyll fluorescence filter set (excitation: 435/40 nm; beam splitter: 510 nm; emission: 515 nm long-pass) were used [3]. By using the automated counting function of FACSCanto, we examined the accurate number of cell. The green fluorescence of the cell area was constrained at an intensity value of 50 to differentiate between red (viable) and green (non-viable) cells [3]. The percentage of red and green cells and the exact cell concentration was calculated. | <p>The automation of viability analysis method via flow cytometer was reported in previous research [3]. In our experiment, cells were analyzed using a flow cytometer FACSCanto. The chlorophyll fluorescence filter set (excitation: 435/40 nm; beam splitter: 510 nm; emission: 515 nm long-pass) were used [3]. By using the automated counting function of FACSCanto, we examined the accurate number of cell. The green fluorescence of the cell area was constrained at an intensity value of 50 to differentiate between red (viable) and green (non-viable) cells [3]. The percentage of red and green cells and the exact cell concentration was calculated. | ||
</p> | </p> | ||
| - | <div class=out style='text-align:center'><img src=" | + | <div class=out style='text-align:center'><img src="https://static.igem.org/mediawiki/2012/3/3e/Ymiqw6.png" alt="" width="558" height="385" /><br /> |
Different fluorescent dyes and its wavelength | Different fluorescent dyes and its wavelength | ||
(http://www.epitomics.com/images/DyLight%20Spectra%20Chart.jpg ) | (http://www.epitomics.com/images/DyLight%20Spectra%20Chart.jpg ) | ||
| Line 135: | Line 135: | ||
<div class="title">Results & Discussion</div> | <div class="title">Results & Discussion</div> | ||
<br /> | <br /> | ||
| - | <div class=out style='text-align:center'><img src=" | + | <div class=out style='text-align:center'><img src="https://static.igem.org/mediawiki/2012/f/f9/Ymiqw7.png" width="600" height="300" /><br /> |
</div> | </div> | ||
| - | <br /><div class=out style='text-align:center'><img src=" | + | <br /><div class=out style='text-align:center'><img src="https://static.igem.org/mediawiki/2012/b/ba/Ymiqw8.png" width="600" height="283" /><br /> |
</div> | </div> | ||
| - | <br /><div class=out style='text-align:center'><img src=" | + | <br /><div class=out style='text-align:center'><img src="https://static.igem.org/mediawiki/2012/f/fc/Ymiqw9.png" width="600" height="262" /><br /> |
</div> | </div> | ||
| - | <br /><div class=out style='text-align:center'><img src=" | + | <br /><div class=out style='text-align:center'><img src="https://static.igem.org/mediawiki/2012/d/d5/Ymiqw10.png" width="600" height="266" /><br /> |
</div> | </div> | ||
| - | <br /><div class=out style='text-align:center'><img src=" | + | <br /><div class=out style='text-align:center'><img src="https://static.igem.org/mediawiki/2012/b/b1/Ymiqw11.png" width="600" height="291" /><br /> |
</div> | </div> | ||
| - | <br /><div class=out style='text-align:center'><img src=" | + | <br /><div class=out style='text-align:center'><img src="https://static.igem.org/mediawiki/2012/7/72/Ymiqw12.png" width="600" height="249" /><br /> |
</div> | </div> | ||
| - | <br /><div class=out style='text-align:center'><img src=" | + | <br /><div class=out style='text-align:center'><img src="https://static.igem.org/mediawiki/2012/b/bc/Ymiqw13.png" width="600" height="244" /><br /> |
</div> | </div> | ||
<br /> | <br /> | ||
| Line 157: | Line 157: | ||
</ol> | </ol> | ||
<br /> | <br /> | ||
| - | <div class=out style='text-align:center'><img src=" | + | <div class=out style='text-align:center'><img src="https://static.igem.org/mediawiki/2012/3/3a/Ymiqw14.png" alt="" width="422" height="302" /><br /> |
<p align="left">When DCMU challenge bacteria, SQR transformed croup can produce more fluorescent light(higher photosynthesis ability, live better)</div> | <p align="left">When DCMU challenge bacteria, SQR transformed croup can produce more fluorescent light(higher photosynthesis ability, live better)</div> | ||
| - | <div class=out style='text-align:center'><img src=" | + | <div class=out style='text-align:center'><img src="https://static.igem.org/mediawiki/2012/6/6d/Ymiqw15.png" alt="" width="405" height="299" /> |
| - | <p align="left">In SQR group, we use DCMU to challenge bacteria. Adding Na2S bacteria produce more fluorescent light. </div><div class=out style='text-align:center'><img src=" | + | <p align="left">In SQR group, we use DCMU to challenge bacteria. Adding Na2S bacteria produce more fluorescent light. </div><div class=out style='text-align:center'><img src="https://static.igem.org/mediawiki/2012/b/b9/Ymiqw16.png" alt="" width="382" height="280" /> |
<p align="left">We survey several papers and hypothesize that the fluorescent comes from cytochrome b6f, which is an important role in the downstream of photosynthesis system II and the electron transport chain. (Erwin J. G. Peterman,Stephan-Olav Wenk et al, Fluorescence and Absorption Spectroscopy of the Weakly Fluorescent Chlorophyll a in Cytochrome b6f of Synechocystis PCC6803, Biophysical Journal Volume 75 July 1998 389–398)<br /> | <p align="left">We survey several papers and hypothesize that the fluorescent comes from cytochrome b6f, which is an important role in the downstream of photosynthesis system II and the electron transport chain. (Erwin J. G. Peterman,Stephan-Olav Wenk et al, Fluorescence and Absorption Spectroscopy of the Weakly Fluorescent Chlorophyll a in Cytochrome b6f of Synechocystis PCC6803, Biophysical Journal Volume 75 July 1998 389–398)<br /> | ||
<br /> | <br /> | ||
| Line 169: | Line 169: | ||
</div> | </div> | ||
<p>Based on the flow cytometry result, we double check our bacteria amount by 730nm absorption:</p> | <p>Based on the flow cytometry result, we double check our bacteria amount by 730nm absorption:</p> | ||
| - | <div class=out style='text-align:center'><img src=" | + | <div class=out style='text-align:center'><img src="https://static.igem.org/mediawiki/2012/9/9f/Ymiqw17.png" alt="" width="559" height="394" /><br /> |
</div> | </div> | ||
<ol> | <ol> | ||
| Line 181: | Line 181: | ||
</div> | </div> | ||
<p>Viable cell concentrations were also determined by spreading 0.1 mL of culturing cyanobacteria on BG-11 agar plates. Colony counts were conducted after these plates were incubated for 7 days at room temperature. The plating was performed in duplicates for every sample.</p> | <p>Viable cell concentrations were also determined by spreading 0.1 mL of culturing cyanobacteria on BG-11 agar plates. Colony counts were conducted after these plates were incubated for 7 days at room temperature. The plating was performed in duplicates for every sample.</p> | ||
| - | <div class=out style='text-align:center'><img src=" | + | <div class=out style='text-align:center'><img src="https://static.igem.org/mediawiki/2012/6/6c/Ymiqw18.png" width="509" height="557" /><br /> |
<p align="left" >We culture bacteria into solid plate. After incubation for about 10 days, we will count the colonies and compare each group. <br /> | <p align="left" >We culture bacteria into solid plate. After incubation for about 10 days, we will count the colonies and compare each group. <br /> | ||
<br /> | <br /> | ||
| Line 190: | Line 190: | ||
</p> | </p> | ||
</div> | </div> | ||
| - | <div class=out style='text-align:center'><img src=" | + | <div class=out style='text-align:center'><img src="https://static.igem.org/mediawiki/2012/2/25/Ymiqw19.png" alt="" width="407" height="482" /><br /> |
<p align="left" >We culture two group bacteria with stable lamina CO2 input and compare the CO2 for each group.<br /> | <p align="left" >We culture two group bacteria with stable lamina CO2 input and compare the CO2 for each group.<br /> | ||
</div> | </div> | ||
<p>It’s very interesting that when adding Na2S to both two bacteria group, we get the similar result. We hypothesize that Na2S might generate adversity to bacteria. Thus, It’s very important to analyze CO2 consumption. CO2 concentration and analysis were examined by the infrared CO2 analyzer and FL22 Algal CO2 Package respectively [4]. Cyanobacteria samples were cultured for 24 hours following CO2 analysis. CO2 fixation rates were calculated in terms of CO2 exchange rate as the following equation: </p> | <p>It’s very interesting that when adding Na2S to both two bacteria group, we get the similar result. We hypothesize that Na2S might generate adversity to bacteria. Thus, It’s very important to analyze CO2 consumption. CO2 concentration and analysis were examined by the infrared CO2 analyzer and FL22 Algal CO2 Package respectively [4]. Cyanobacteria samples were cultured for 24 hours following CO2 analysis. CO2 fixation rates were calculated in terms of CO2 exchange rate as the following equation: </p> | ||
<div class=out style='text-align:center'> | <div class=out style='text-align:center'> | ||
| - | <p align="center" ><img src=" | + | <p align="center" ><img src="https://static.igem.org/mediawiki/2012/d/dd/Ymiqw20.png" alt="" width="433" height="60" /> </div> |
<p>The HCO3 concentration in the culture medium was also measured with Carbon Dioxide Enzymatic Assay of BQ Kits (Bio-Quant, USA).</p> | <p>The HCO3 concentration in the culture medium was also measured with Carbon Dioxide Enzymatic Assay of BQ Kits (Bio-Quant, USA).</p> | ||
<div class=out style='text-align:center'> | <div class=out style='text-align:center'> | ||
| - | <p align="center" ><img src=" | + | <p align="center" ><img src="https://static.igem.org/mediawiki/2012/b/bc/Ymiqw21.png" alt="" width="558" height="320" /> <br /> |
<p align="left"> We will analyze CO2 consumption for SQR grop and wildtype cyanobacteria to find out the activity of them. Finally, We will use DCMU to challenge two groups of bacteria and perform this assay again ( http://www.quora.com/Carbon-Dioxide ) <br /> | <p align="left"> We will analyze CO2 consumption for SQR grop and wildtype cyanobacteria to find out the activity of them. Finally, We will use DCMU to challenge two groups of bacteria and perform this assay again ( http://www.quora.com/Carbon-Dioxide ) <br /> | ||
<br /> | <br /> | ||
Latest revision as of 03:12, 27 October 2012


Sulfite quinine reductase, SQR use hydrogen sulfide, H2S as electron resource to perform photosynthesis

Cyanobacteria contain different of cytochrome. We can detect them by different wavelength fluorescent light.
( http://www.masa.asn.au/phpBB3/viewtopic.php?t=233828&p=960435 )
Cyanobacteria Culture
Both wild type and sqr stain of Synechococcus sp. PCC7942 were cultivated in BG-11 medium (Allen M.M. 1968) [1]. The initial cell concentration was adjusted to an OD730 of 0.2. The experiment was initialized after the addition of unicellular blue-green algae, and the six-well plates were placed on a 100 r.p.m. shaker.

We culture Synechococcus sp. PCC7942 wildtype and sqr transformed one in BG-11 medium with suitable shaker.
DCMU blocking assay
Freshly made sodium sulfide containing medium was added into the experiment group. The concentration of sodium sulfide was 2.5 mM, and additional 2.5mM of sodium sulfide was added every 24 hours. 3-(3,4-dichlorophenyl)-1,1-dimethylurea (DCMU) [2], a chemical which can block photosystem II was also added into both experiment and control group. A positive control group was established by simply cultivated cyanobacteria in fresh medium. As followed, we analyze by flow cytometry analysis, 730 nm absorption assay and plating of bacteria.
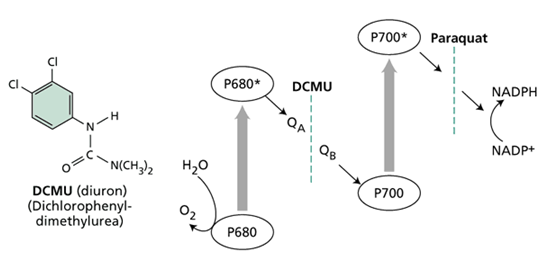
DCMU specifically block photosynthesis system II
( http://5e.plantphys.net/article.php?ch=7&id=75 )
Flow cytometry analysis

We use flow cytometry with multiple wavelength fluorescent light to find out the differences between two groups.
The automation of viability analysis method via flow cytometer was reported in previous research [3]. In our experiment, cells were analyzed using a flow cytometer FACSCanto. The chlorophyll fluorescence filter set (excitation: 435/40 nm; beam splitter: 510 nm; emission: 515 nm long-pass) were used [3]. By using the automated counting function of FACSCanto, we examined the accurate number of cell. The green fluorescence of the cell area was constrained at an intensity value of 50 to differentiate between red (viable) and green (non-viable) cells [3]. The percentage of red and green cells and the exact cell concentration was calculated.

Different fluorescent dyes and its wavelength (http://www.epitomics.com/images/DyLight%20Spectra%20Chart.jpg )


- We kill wildtype cyanobacteria with 4oC environment for 2 weeks
- We find out that when adding Na2S to our DCMU blocked SQR bacteria, they show more fluorescent light(higher photosynthesis ability, live better)
- We find out that when bacteria are challenged with DCMU, SQR group can live better than Wldtype group, which means SQR gene help cyanobacteria survive in the adversity(DCMU, Na2S)
- It’s very interesting when we compare data:

When DCMU challenge bacteria, SQR transformed croup can produce more fluorescent light(higher photosynthesis ability, live better)

In SQR group, we use DCMU to challenge bacteria. Adding Na2S bacteria produce more fluorescent light.

We survey several papers and hypothesize that the fluorescent comes from cytochrome b6f, which is an important role in the downstream of photosynthesis system II and the electron transport chain. (Erwin J. G. Peterman,Stephan-Olav Wenk et al, Fluorescence and Absorption Spectroscopy of the Weakly Fluorescent Chlorophyll a in Cytochrome b6f of Synechocystis PCC6803, Biophysical Journal Volume 75 July 1998 389–398)
730 nm absorption
Based on the flow cytometry result, we double check our bacteria amount by 730nm absorption:

- When challenge bacteria with DCMU, SQR transformed cyanobacteria live better than wildtype(higher photosynthesis, better adversity resistance)
- It’s very interesting that when add Na2S into two kinds of bacteria, it might produce more difficulty for living(maybe the Na2S concentration is wrong? HS- binds to Fe and generate worse environment for bacteria)
Plating of bacteria
Viable cell concentrations were also determined by spreading 0.1 mL of culturing cyanobacteria on BG-11 agar plates. Colony counts were conducted after these plates were incubated for 7 days at room temperature. The plating was performed in duplicates for every sample.

We culture bacteria into solid plate. After incubation for about 10 days, we will count the colonies and compare each group.
CO2 consumption analysis

We culture two group bacteria with stable lamina CO2 input and compare the CO2 for each group.
It’s very interesting that when adding Na2S to both two bacteria group, we get the similar result. We hypothesize that Na2S might generate adversity to bacteria. Thus, It’s very important to analyze CO2 consumption. CO2 concentration and analysis were examined by the infrared CO2 analyzer and FL22 Algal CO2 Package respectively [4]. Cyanobacteria samples were cultured for 24 hours following CO2 analysis. CO2 fixation rates were calculated in terms of CO2 exchange rate as the following equation:

The HCO3 concentration in the culture medium was also measured with Carbon Dioxide Enzymatic Assay of BQ Kits (Bio-Quant, USA).

We will analyze CO2 consumption for SQR grop and wildtype cyanobacteria to find out the activity of them. Finally, We will use DCMU to challenge two groups of bacteria and perform this assay again ( http://www.quora.com/Carbon-Dioxide )
References
- Allen MM (1968) Simple conditions for growth of unicellular blue-green algae. J Phycol 4: 1-3
- Adaptation to Hydrogen Sulfide of Oxygenic and Anoxygenic Photosynthesis among Cyanobacteria YEHUDA COHEN,'* BO BARKER J0RGENSEN,2 NIELS PETER REVSBECH,2 AND RICARDO POPLAWSKIl H. Steinitz Marine Biology Laboratory, The Hebrew University of Jerusalem, Eilat 88103, Israel,1 and Institute of Ecology and Genetics, University of Aarhus, Ny Munkegade, DK 8000, Aarhus C, Denmark2 Received 1 July 1985/Accepted 22 October 1985
- A simple viability analysis for unicellular cyanobacteria using a new autofluorescence assay, automated microscopy, and ImageJ Katja Schulze1,2*, Diana A López1, Ulrich M Tillich1 and Marcus Frohme1 BMC Biotechnology 2011, 11:118 doi:10.1186/1472-6750-11-118
- Enhancing CO2 bio-mitigation by genetic engineering of cyanobacteria† Pei-Hong Chen,a Hsien-Lin Liu,a Yin-Ju Chen,a Yi-Hsiang Cheng,a Wei-Ling Lin,a Chien-Hung Yeha and Chuan-Hsiung Chang*ab Received 16th January 2012, Accepted 7th June 2012 DOI: 10.1039/c2ee21124f
-
Sulfide as Energy Generator
-
Sulfur Oxide Terminator
-
Denitrifying Machine
-
Cd+2 Collector
-
Becoming Venusian