Team:LMU-Munich/Data/crustpromoters
From 2012.igem.org
Franzi.Duerr (Talk | contribs) |
|||
| Line 10: | Line 10: | ||
| - | <p align="justify">The figure below shows the result of the evaluation of the three promoters (P<sub>''cgeA''</sub>, P<sub>''cotV''</sub>, P<sub>''cotYZ''</sub>) for the spore crust proteins with a previous version of the luminescence reporter vector [http://partsregistry.org/wiki/index.php?title=Part:BBa_K823025 BBa_K823025]. For each promoter two independent clones were | + | <p align="justify">The figure below shows the result of the evaluation of the three promoters (P<sub>''cgeA''</sub>, P<sub>''cotV''</sub>, P<sub>''cotYZ''</sub>) for the spore crust proteins with a previous version of the luminescence reporter vector [http://partsregistry.org/wiki/index.php?title=Part:BBa_K823025 BBa_K823025]. For each promoter two independent clones were evaluated three times. To link the promoter activities to the growth phase, the optical density (OD<sub>600</sub>) was measured throughout the whole experiment. </p> |
| Line 22: | Line 22: | ||
{| style="color:black;" cellpadding="0" width="90%" cellspacing="0" border="0" align="center" style="text-align:left;" | {| style="color:black;" cellpadding="0" width="90%" cellspacing="0" border="0" align="center" style="text-align:left;" | ||
|style="width: 70%;background-color: #EBFCE4;" | | |style="width: 70%;background-color: #EBFCE4;" | | ||
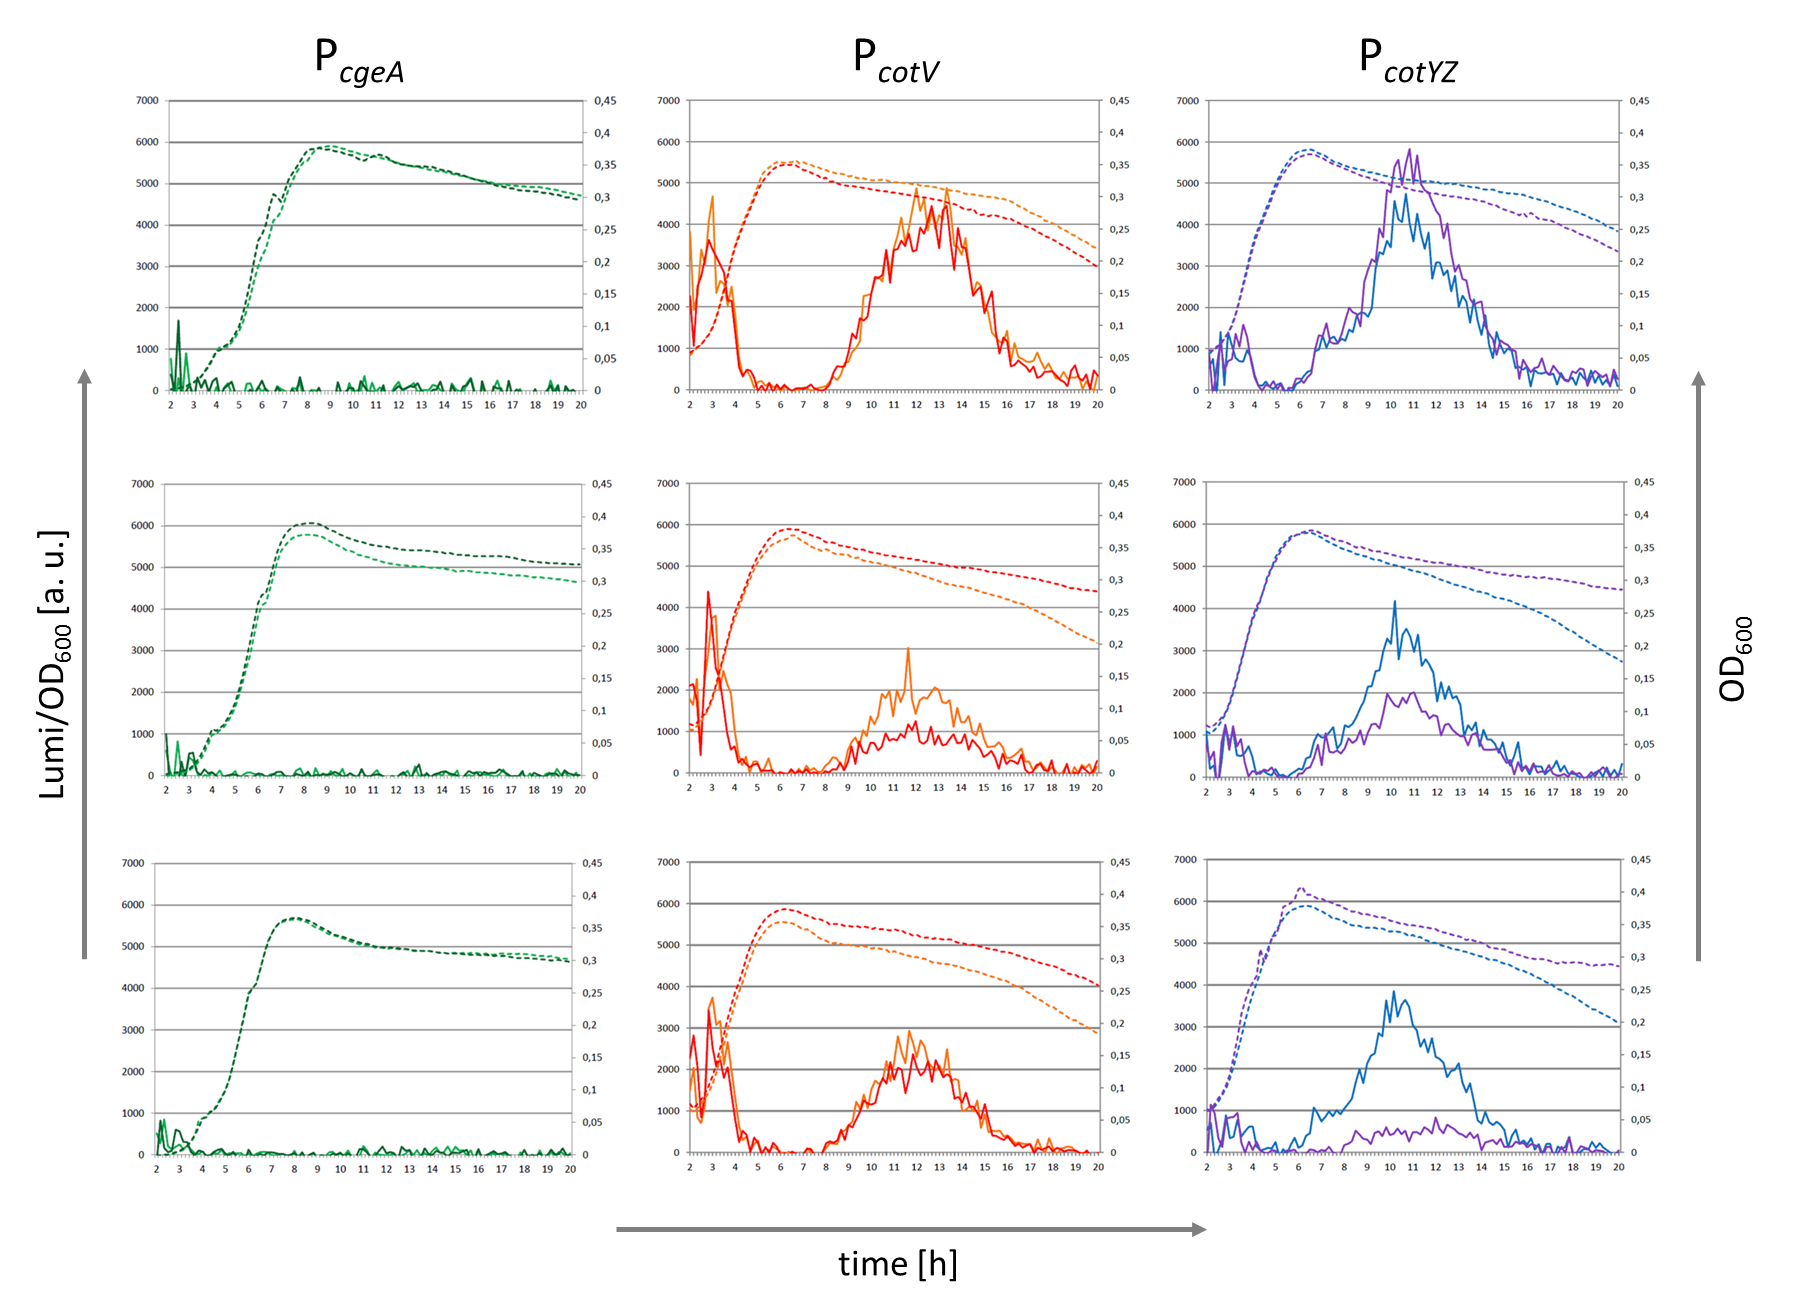
| - | <font color="#000000"; size="2"><p align="justify">Fig. 1:The result of the measurement of the three promoters P<sub>''cgeA''</sub>, P<sub>''cotV''</sub> and P<sub>''cotYZ''</sub> fused to the lux operon. The left vertical axis displays the luminescence divided by the OD<sub>600</sub> and the left one shows the OD<sub>600</sub>. On the horizontal axis the time is illustrated. The | + | <font color="#000000"; size="2"><p align="justify">Fig. 1:The result of the measurement of the three promoters P<sub>''cgeA''</sub>, P<sub>''cotV''</sub> and P<sub>''cotYZ''</sub> fused to the lux operon. The left vertical axis displays the luminescence divided by the OD<sub>600</sub> and the left one shows the OD<sub>600</sub>. On the horizontal axis the time is illustrated. The continuous lines show the luminescence which correlates with the promoter activity and the dotted lines display the growth curve of each clone.</p></font> |
|} | |} | ||
|} | |} | ||
Revision as of 23:13, 26 September 2012

The LMU-Munich team is exuberantly happy about the great success at the World Championship Jamboree in Boston. Our project Beadzillus finished 4th and won the prize for the "Best Wiki" (with Slovenia) and "Best New Application Project".
[ more news ]

Crust promoter evaluation
The figure below shows the result of the evaluation of the three promoters (PcgeA, PcotV, PcotYZ) for the spore crust proteins with a previous version of the luminescence reporter vector BBa_K823025. For each promoter two independent clones were evaluated three times. To link the promoter activities to the growth phase, the optical density (OD600) was measured throughout the whole experiment.
|
The native promoters of cotZ, PcotYZ and PcotV, show a clear signal late in stationary phase, as expected. PcotYZ is activated two hours earlier than PcotV and both promoters are active for about 12 hours. In contrast, PcgeA does not show any activity.
 "
"


