Team:Cambridge/Project/DesignProcess
From 2012.igem.org
Luciferase and instrumentation
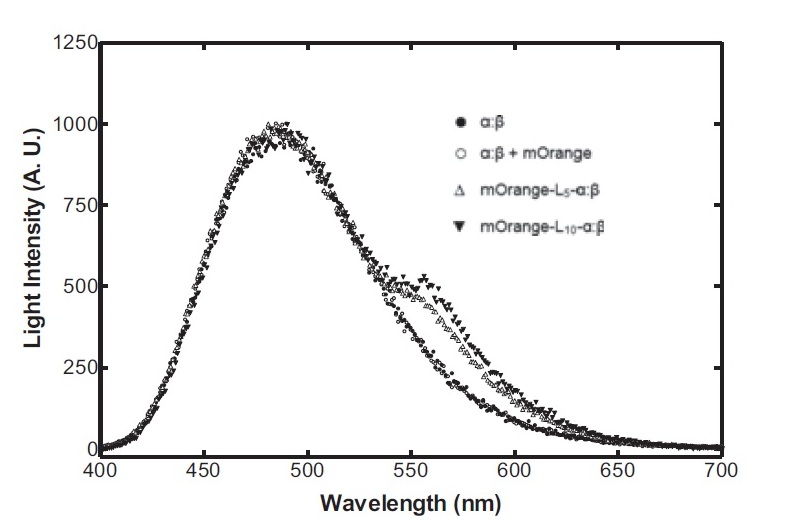
Having come across the OFP-luciferase fusion, the emission spectra of which appeared sufficiently distinct from that of the normal bacterial luciferase (a fairly distinctive blue), it became clear to the team that this would be a great opportunity for developing our own hardware and software which could be used as part of our kit. The difference in emission spectra could be identified by simple photo-resistors (70kΩ/200kΩ) and coloured theatrical filter gels. The emission spectra of the OFP/luciferase fusion is shown below:
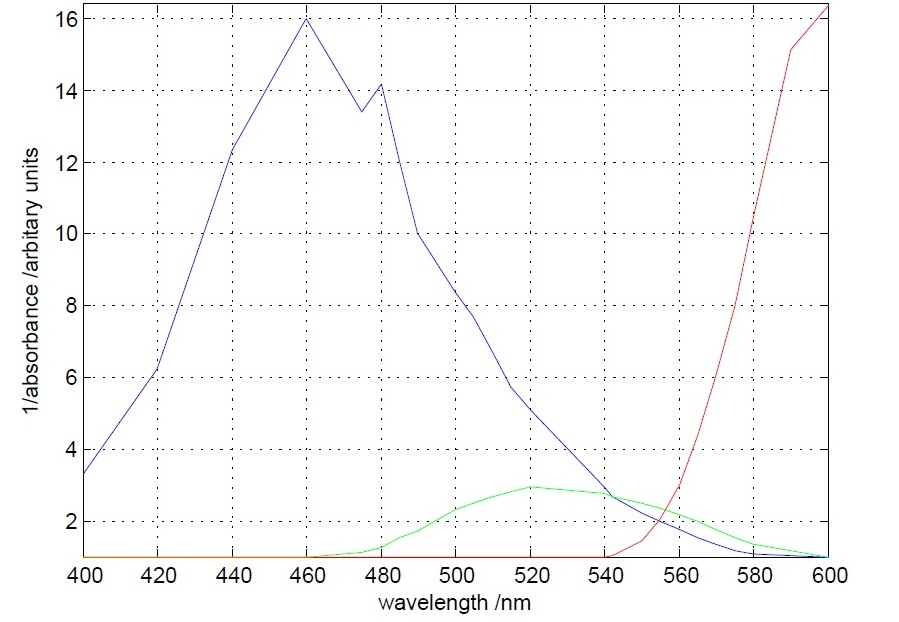
The first experiment to be done was the measurement of the absorbance (actually the inverse of it) of different theatrical filter gels. The target was to differentiate the 560 nm peak to the 490 nm peak. This was accomplished, as it can be seen below, by one blue and one orange filter gel.
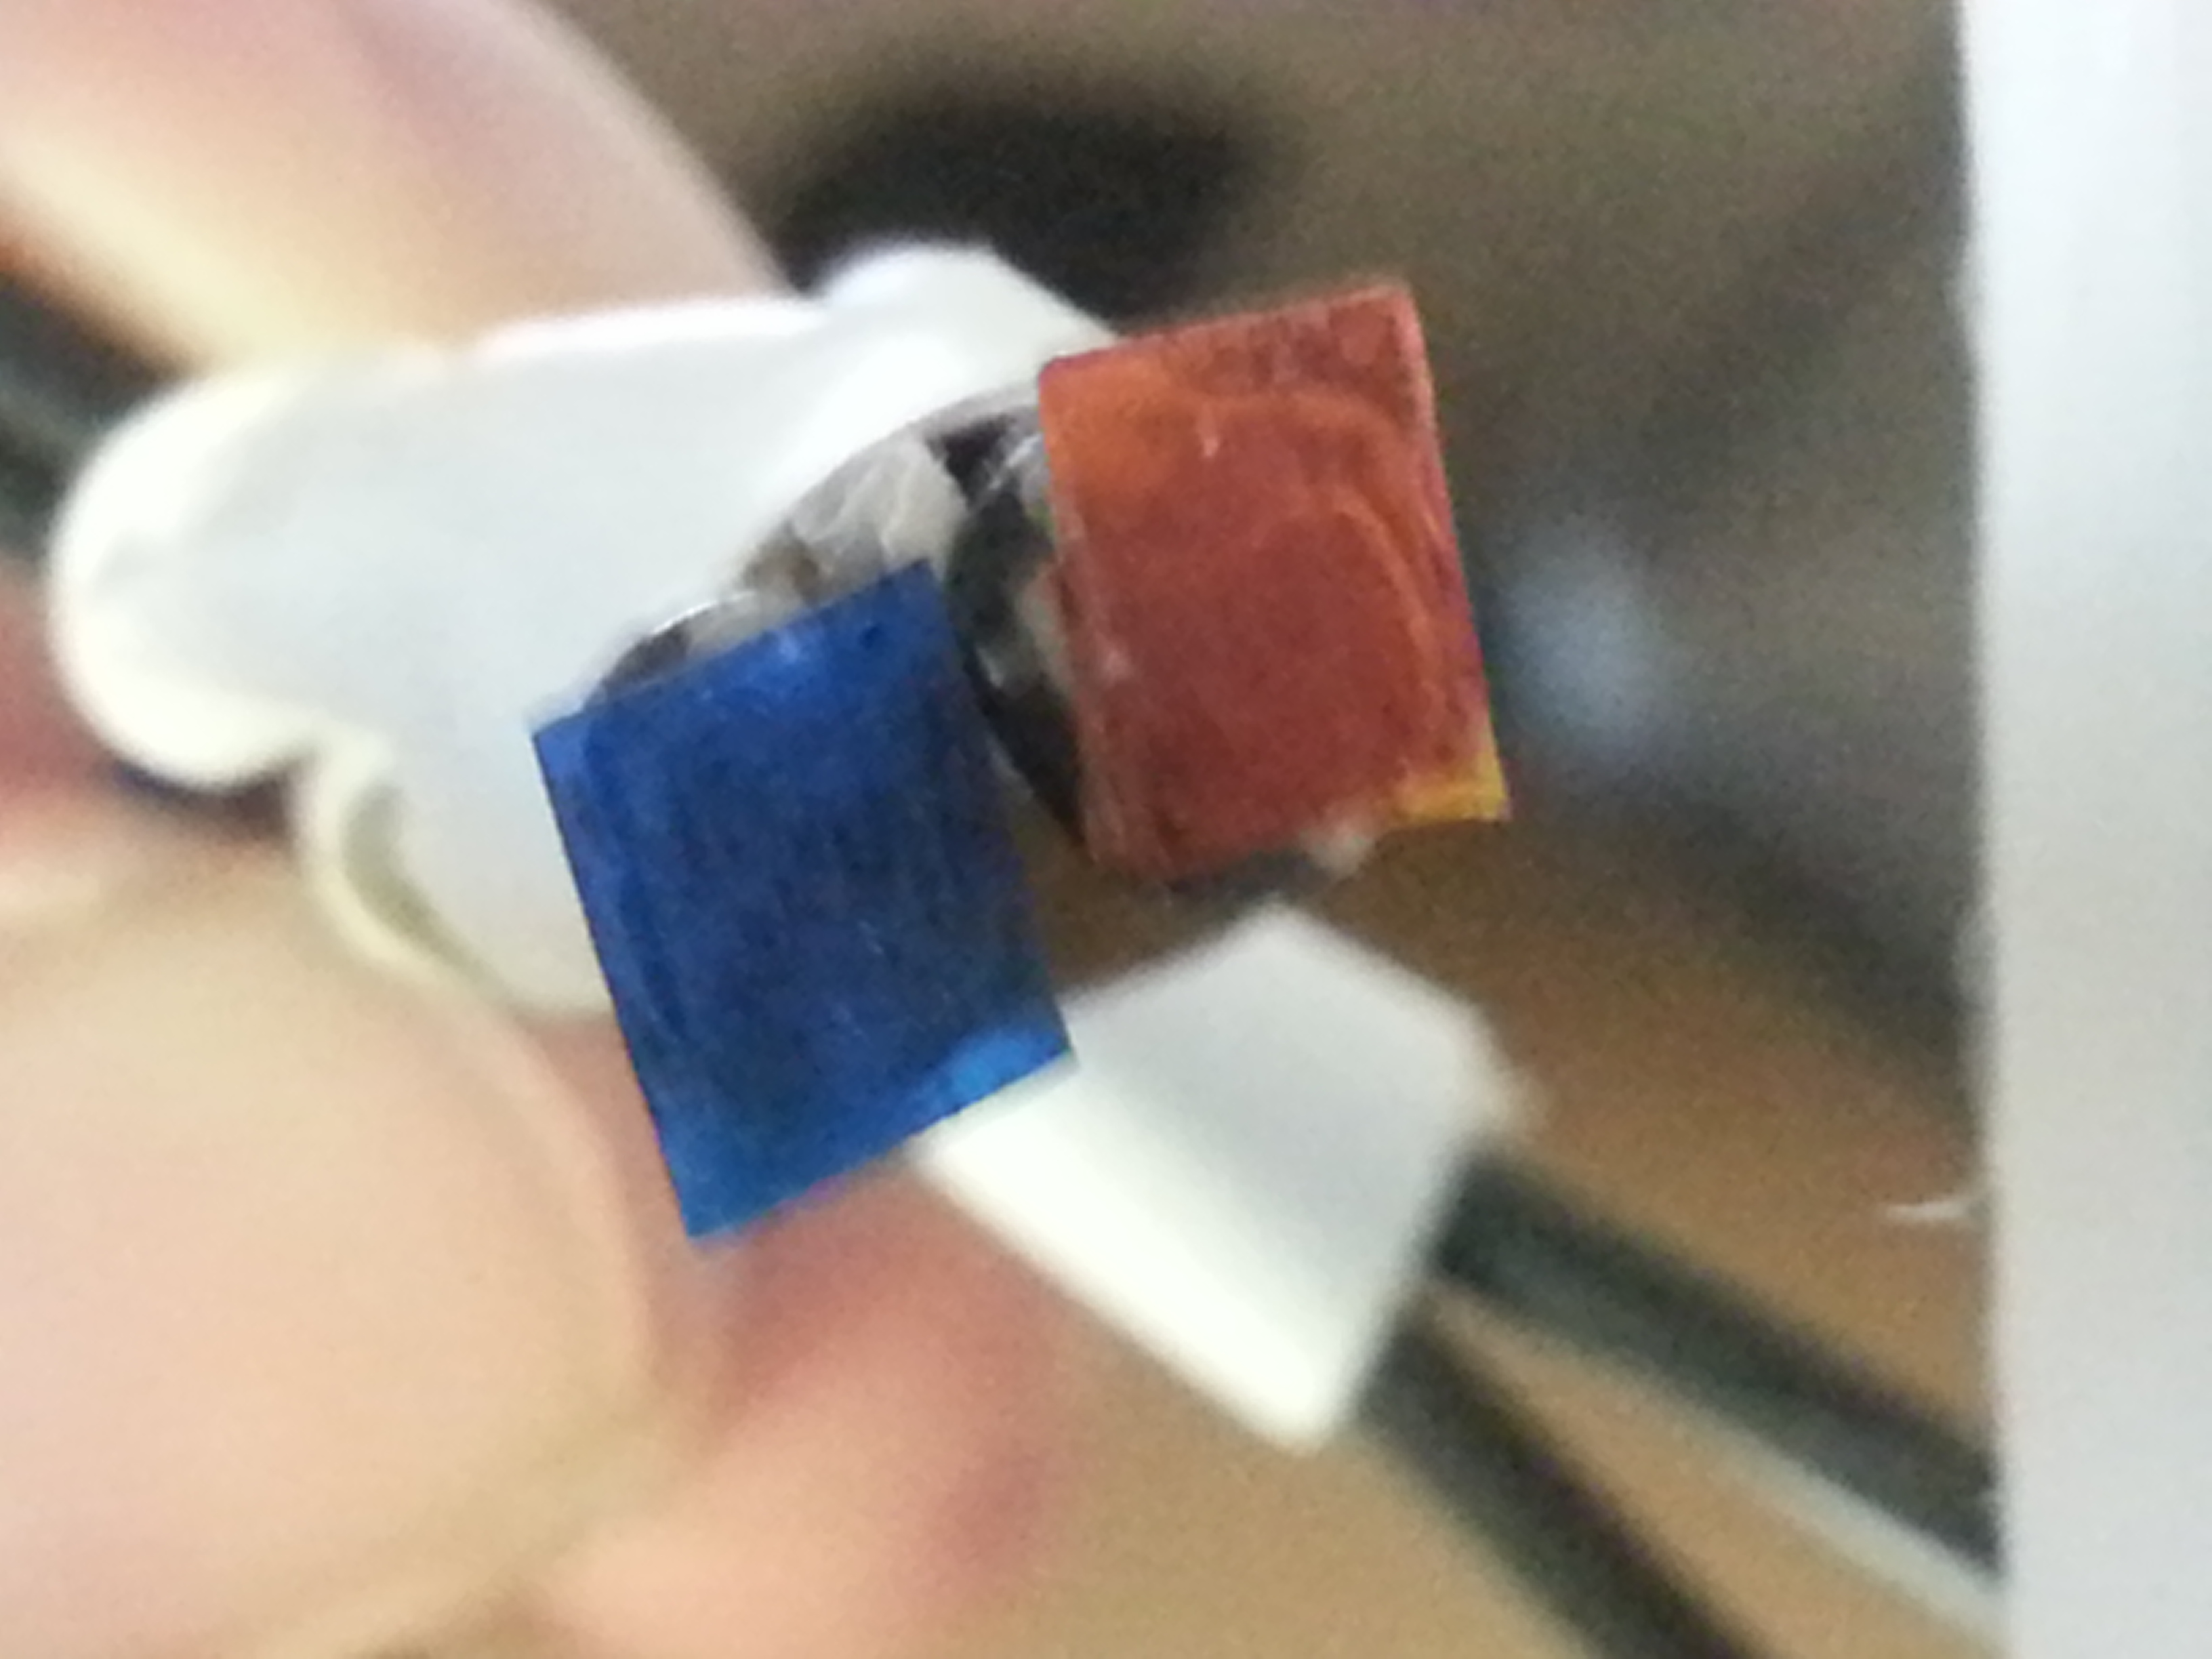
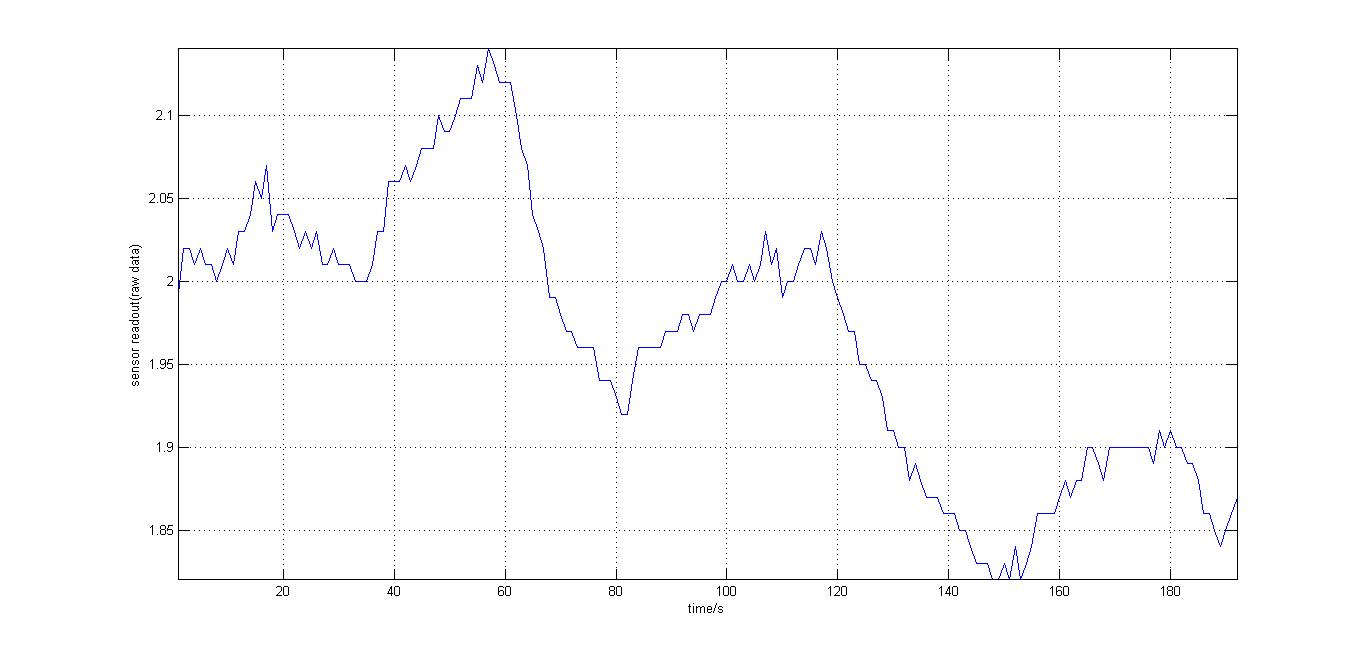
The second experiment to be done was the testing of the sensor with luciferase-producing E.Coli with lux genes, taken from the 2010 Cambridge team. The experiment was conducted by moving the tube containing these bacteria towards and away from our sensor (shown on the right). It should be noted that when this experiment took place, the blue and orange filters were placed in reverse. Therefore, light which consisted primarily of blue frequencies caused a rise instead of drop. For all the other experiments the blue and orange filters were placed in the right order. The results were again very encouraging, showing that the sensor was certainly reacting to even that minute amount of light.
Following on from that experiment, but now with the blue and orange filters in the right order, the sensitivity of the sensor was tested using a dilution series of luciferase-producing bacteria. 20ml Cultures were grown overnight from single colonies. The cultures were induced with 40ul of 1.5M arabinose (for a final concentration of 3mM).
Cultures were left for 2 1/2 hours for full induction. Subsequently, a culture was pelleted and resuspended in 4ml LB. Doubling dilutions, of volume 2ml, were made from this concentrate, down to 1/8th concentration.
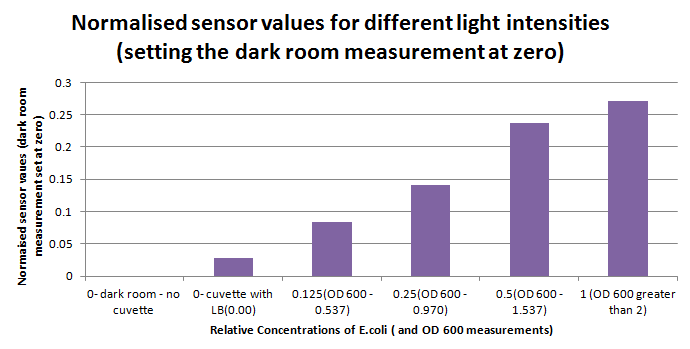
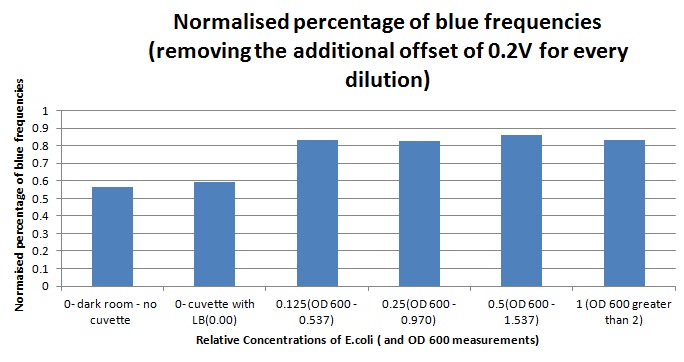
1ml of each 2ml dilution was analysed in each cuvette, which was placed in the cuvette holder we made ourselves. The result was very good. An almost linear relationship was obtained when data were normalised with the sensor value taken in the dark room without using the cuvette holder (1-(sensor value/sensor value in absolute dark)), presenting the sensitivity of the sensor to different intensities of light. This behaviour was expected due to the changing offset affecting the luciferase spectrum curve at different light intensities. The offset, using our data, was calculated to be about 0.2V for each dilution. A second graph is shown which takes into account this offset (and removes it), thus showing the presence of blue frequencies. The result was very good as the presence of blue frequencies throughout the dilution series is not only detected, but also found to be approximately constant.
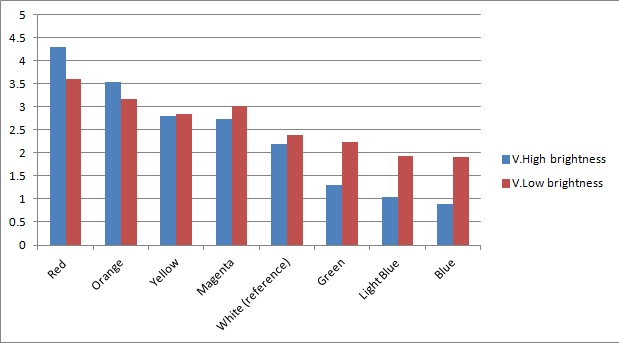
Once the sensor was built and tested for sensitivity, we needed to test that our circuitry correctly identified different frequencies (colours) of light. As can be seen below, measurements taken from orange and blue light yield values respectively above and below those from white light (our reference point). The data was taken using a constant intensity of light for each case (V.High and V.Low brightness). This was done with the aid of an Android phone and a specialised software application, called Color Flashlight, downloaded from the official Market.
As expected from the potential-divider design of our circuitry, orange and red frequencies caused the resistance of the LDR with the orange filter to decrease, leading to a higher voltage across the LDR with the blue filter. The opposite effect was observed with blue light. The reason that the white reference point is a bit lower than 2.5V (the expected value for a non-biased circuitry with a 5V source), is because we use resistors of total net resistance 1.67 kΩ before the blue LDR. This was done to bias the circuitry towards blue (i.e. decreasing the starting value) and thus cause orange light to have a larger impact when present. This was used in an attempt to compensate for the fact that the peak at 560nm (Orange) in MOrange/luciferase fusion spectrum is lower than the one at 490 nm (Blue).
As the major part of the instrumentation, the bio-electronic interface, had been made and tested, now we turned to implementing the parts of our project peripheral to the main sensor. This included the mechanical chassis of the prototype, the electronic/mechatronic (sensory and motory) components, and of course the software. A full analysis of the finished hardware/software can be seen in our Intstrumentation page. Below, the videos showing our instrumentation in action can be seen.
Further improvements on instrumentation design
Due to constraints on time and budget, we could not realise all of our aims for the sensor. What we have developed is a robust prototype which clearly demonstrates the potential our kit has as a cost-effective and reliable sensor. We include the considerations we could not realise below, in order to guide anyone who wishes to turn our prototype into a polished end product.
- The cuvette holders we made could be replaced with alternative cuvettes with bio-containment mechanisms. These cuvettes could have a hollow wall, containing an antibiotic or antiseptic. By applying a small amount of force on the sides with the lid on, the second layer would break, thus releasing the antibiotic inside the cuvette. The cuvette would then pose a greatly diminished biocontainment risk and so this would facilitate disposal.
- Microfluidic technology could be used to deliver the testing sample to the cuvettes. This would both reduce spillage, and potentially reduce the sample volumes required.
- For increased biosecurity, and where cost is not an issue, the device can have a sensor dedicated to each cuvette. In that way, parallel readings could be taken in a non-rotary device, reducing the exposure of the cuvettes not in the detector to the environment.
- Hall-effect sensors or barcode readings could be used to more accurately identify which cuvette was in the detector. Furthermore, these barcodes could also be useful for identifying what analyte is being assayed in the sample by each biosensor.
 "
"
