Team:Amsterdam/project/characterization experiments/
From 2012.igem.org
(Difference between revisions)
| Line 39: | Line 39: | ||
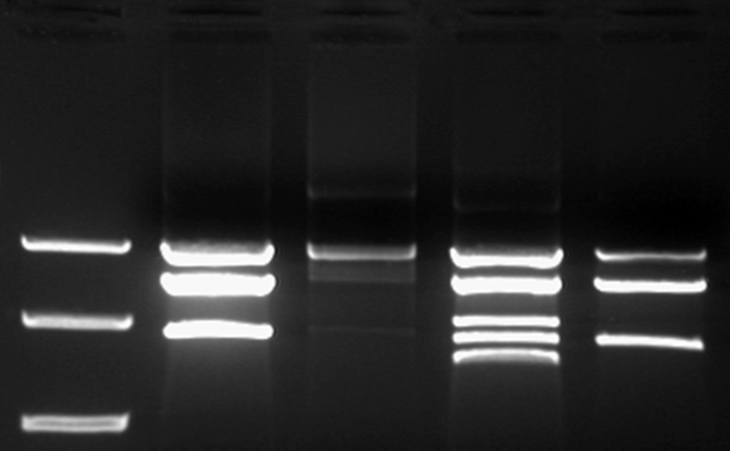
During the [growth curve experiment] several samples were taken on different time points to investigate the occurrence of methylation over the progression of time. | During the [growth curve experiment] several samples were taken on different time points to investigate the occurrence of methylation over the progression of time. | ||
| - | [[File:Amsterdam_characterization_experiments_gel_growth_curve_1.png|300px]] | + | [[File:Amsterdam_characterization_experiments_gel_growth_curve_1.png|300px|right]] |
Figure X shows first the samples without and then the samples with induction reveals an intermediate restriction profile over the progression of time with a gradual shift toward cut, without methylation, plasmid. But the two samples taken after 24 hours show a difference. The sample with signal shows only uncut, fully methylated, plasmid. | Figure X shows first the samples without and then the samples with induction reveals an intermediate restriction profile over the progression of time with a gradual shift toward cut, without methylation, plasmid. But the two samples taken after 24 hours show a difference. The sample with signal shows only uncut, fully methylated, plasmid. | ||
| Line 75: | Line 75: | ||
As with the LacH we suspect that the construct will act differently when taken from a stationary culture. So two experiments were performed on construct pSB1AT3+pBAD+Mtase where bacteria were grown for a minimum of 24 hours to reach stationary phase in the presence of arabinose. | As with the LacH we suspect that the construct will act differently when taken from a stationary culture. So two experiments were performed on construct pSB1AT3+pBAD+Mtase where bacteria were grown for a minimum of 24 hours to reach stationary phase in the presence of arabinose. | ||
| - | [[File: | + | [[File:Amsterdam_characterization_experiments_gel_48_hour_exposure_log_vs_stationary_1.png|300px|right]] |
| - | [[File: | + | [[File:Amsterdam_characterization_experiments_gel_48_hour_exposure_log_vs_stationary_2.png|300px|right]] |
Both figures X and Y show a dramatic shift from the intermediate digestion profile to the ‘on’ digestion profile. This is considered as a great success. | Both figures X and Y show a dramatic shift from the intermediate digestion profile to the ‘on’ digestion profile. This is considered as a great success. | ||
Revision as of 03:29, 26 September 2012
 "
"


