Team:Amsterdam/achievements/experimental
From 2012.igem.org
(Difference between revisions)
| Line 13: | Line 13: | ||
<h4>Setup of the read-out method</h4> | <h4>Setup of the read-out method</h4> | ||
| - | |||
| - | |||
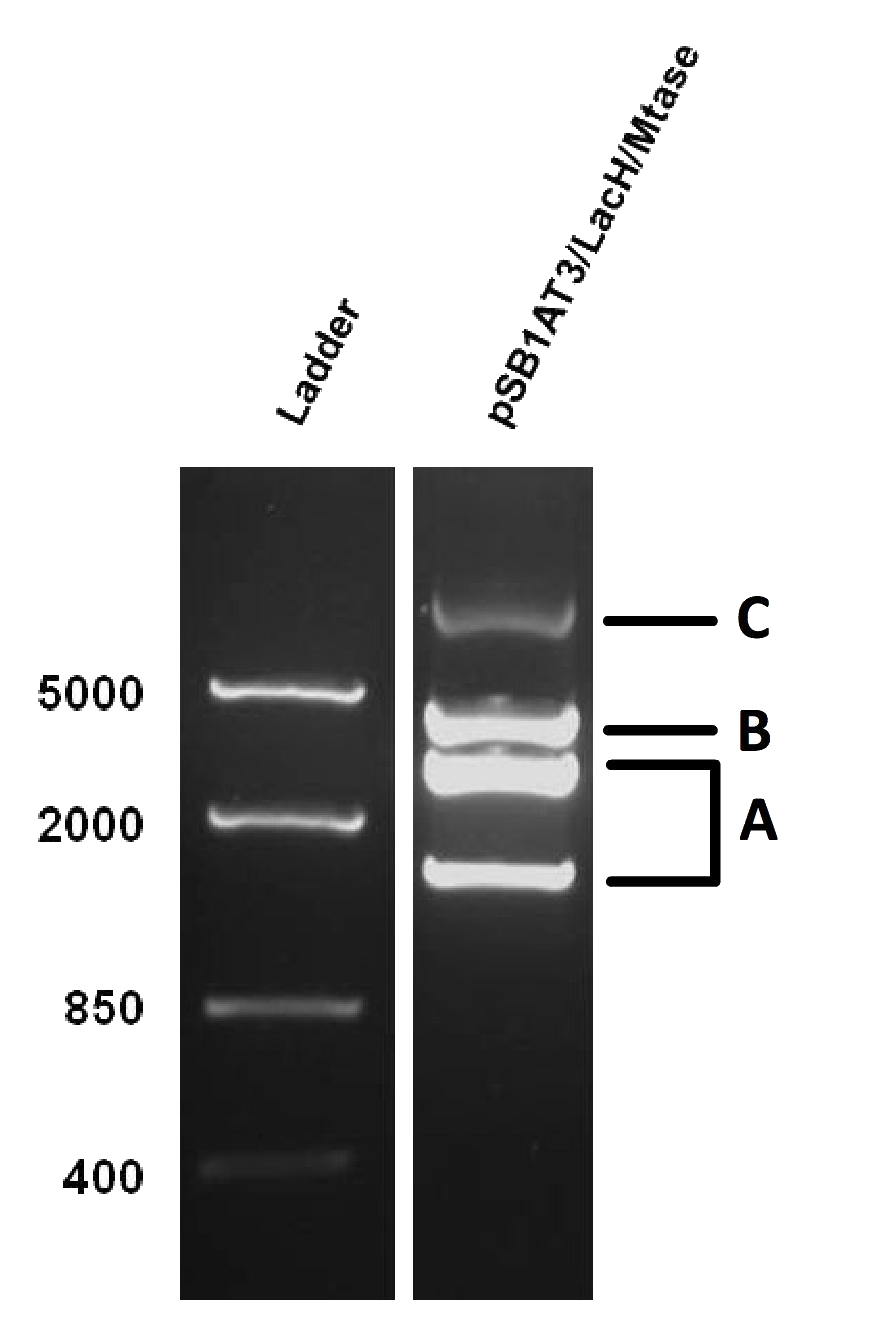
[[File:Amsterdam_experimental_results_1.png|thumb|300px|right|Figure 1]] | [[File:Amsterdam_experimental_results_1.png|thumb|300px|right|Figure 1]] | ||
| + | |||
| + | As mentioned in our molecular design, the restriction enzyme is unable to cut methylated restriction sites. We can expect different possible restriction profiles through ScaI restriction digestion since there is one ScaI site residing in the pSB1AT3 backbone and we created one ScaI site via a scar inside our memory module. Moreover, we expect to find either an off or intermediate state knowing that the LacH promoter driving the MTase has some basal activity. | ||
Figure 1 shows the result of a ScaI restriction digestion of the pSB1AT3/LacH/MTase construct without IPTG induction. The pattern displayed corresponds to a combination of bands indicating an intermediate state between an ‘off’ and ‘on’ situation. Interpretation of the read-out: absence of MTase expression in E. Coli leads to a complete digestion of our plasmid. Two bands of 2989 bp and 1621 bp are then observed (A). On the other hand, incomplete methylation of the plasmid at only one of the two ScaI sites shows a linearized plasmid band 4610 bp. Ultimately, a complete methylation of our memory module prevents ScaI to cut and a typical uncut plasmid profile is observed (C). | Figure 1 shows the result of a ScaI restriction digestion of the pSB1AT3/LacH/MTase construct without IPTG induction. The pattern displayed corresponds to a combination of bands indicating an intermediate state between an ‘off’ and ‘on’ situation. Interpretation of the read-out: absence of MTase expression in E. Coli leads to a complete digestion of our plasmid. Two bands of 2989 bp and 1621 bp are then observed (A). On the other hand, incomplete methylation of the plasmid at only one of the two ScaI sites shows a linearized plasmid band 4610 bp. Ultimately, a complete methylation of our memory module prevents ScaI to cut and a typical uncut plasmid profile is observed (C). | ||
<h4>Writing of our memory module upon IPTG induction</h4> | <h4>Writing of our memory module upon IPTG induction</h4> | ||
| - | |||
| - | |||
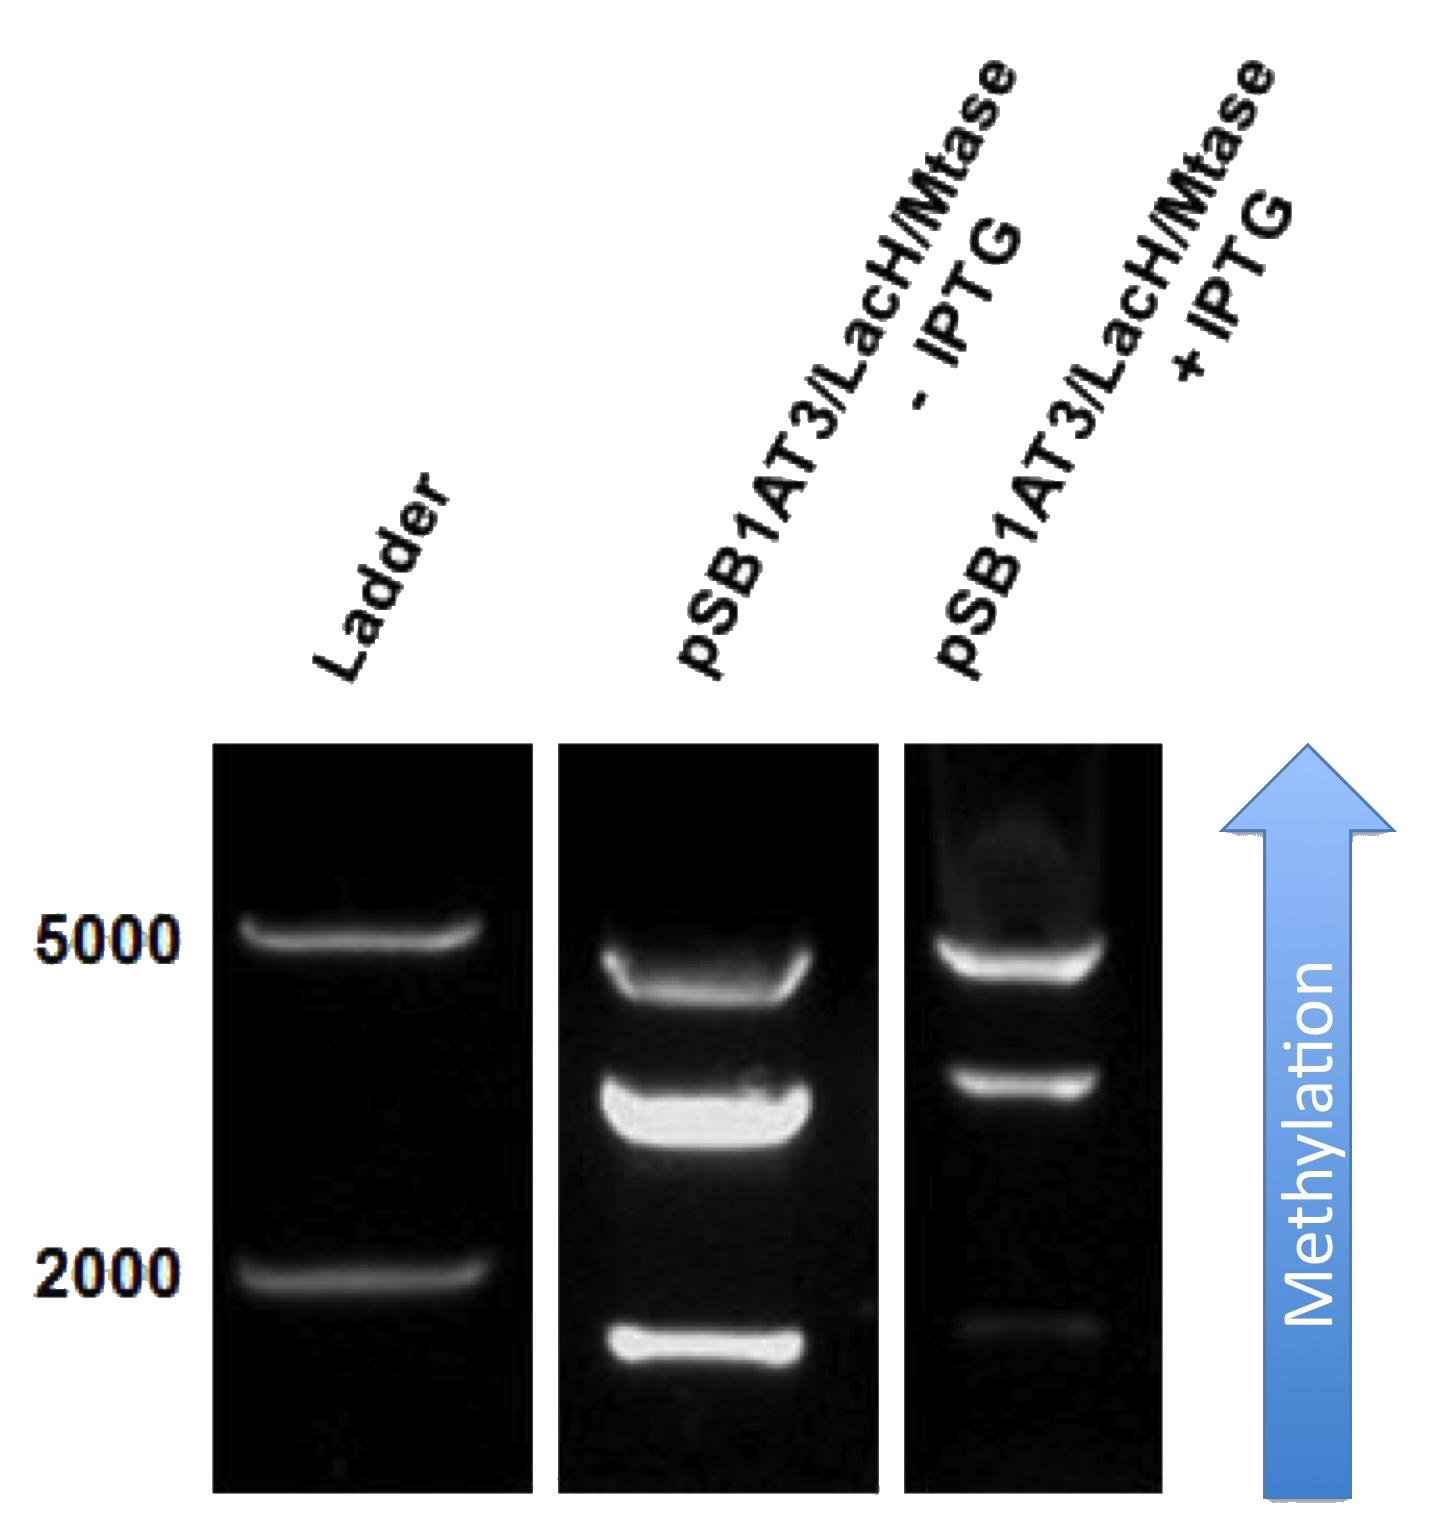
[[File:Amsterdam_experimental_results_2.png|thumb|300px|right|Figure 2]] | [[File:Amsterdam_experimental_results_2.png|thumb|300px|right|Figure 2]] | ||
| + | |||
| + | The next step was to see if IPTG-based induction of MTase expression would modify the methylation state of our biobrick thus changing the resulting restriction profile. In the presence of 1mM IPTG, the promoter should be activated providing MTase production inside the cells. Since our [model] for this experiment suggests that methylation occurs at a fast rate we expect that after 16h of IPTG induction, the read-out will dramatically shift to the uncut profile. | ||
Figure X doesn’t display a fully ‘on’ restriction profile but a gradual shift towards the restriction profile that represent s more uncut plasmid. This indicates that induction leads to an increase of methylation of the plasmid. Although, we still observe a gradual shift of the restriction profile meaning that the read-out doesn’t leave the intermediate state. | Figure X doesn’t display a fully ‘on’ restriction profile but a gradual shift towards the restriction profile that represent s more uncut plasmid. This indicates that induction leads to an increase of methylation of the plasmid. Although, we still observe a gradual shift of the restriction profile meaning that the read-out doesn’t leave the intermediate state. | ||
Revision as of 13:19, 26 September 2012
 "
"


