Team:Amsterdam/achievements/experimental
From 2012.igem.org
(Difference between revisions)
| (34 intermediate revisions not shown) | |||
| Line 7: | Line 7: | ||
<div id="sub-menu" class="content-block"> | <div id="sub-menu" class="content-block"> | ||
<h1>Experimental results</h1> | <h1>Experimental results</h1> | ||
| + | <div class="mw-collapsible"> | ||
__TOC__ | __TOC__ | ||
| + | </div> | ||
| + | <div class='clear'></div> | ||
| + | |||
<h2>First proof of concept: LacH+Mtase experiments</h2> | <h2>First proof of concept: LacH+Mtase experiments</h2> | ||
| - | We started testing our first biobrick and first proof of concept, upon finishing the insertion of our synthesized Methyltransferase (MTase) under the control of the LacH promoter in the pSB1AT3 backbone (link) | + | We started testing our first biobrick and first proof of concept, upon finishing the insertion of our synthesized Methyltransferase (MTase) under the control of the LacH promoter in the pSB1AT3 backbone (link), |
| - | <h4> | + | <h4>Set up of the Read-out method:</h4> |
| + | [[File:Amsterdam_exp_fig_1.png|300px|right|thumb|Figure 1]] | ||
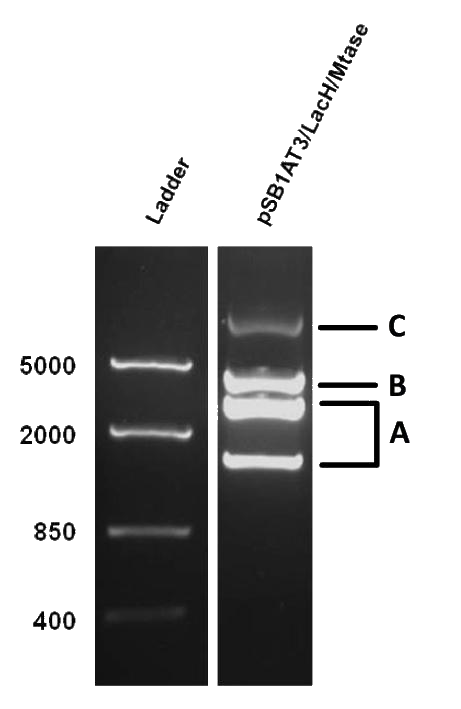
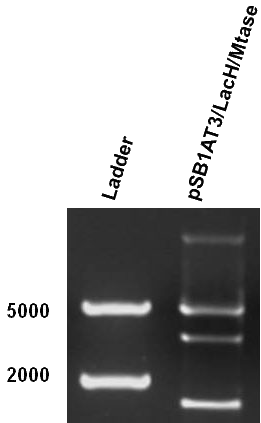
As mentioned in our molecular design, the restriction enzyme is unable to cut methylated restriction sites. We can expect different possible restriction profiles through ScaI restriction digestion since there is one ScaI site residing in the pSB1AT3 backbone and we created one ScaI site via a scar inside our memory module. Moreover, we expect to find either an off or intermediate state knowing that the LacH promoter driving the MTase has some basal activity. | As mentioned in our molecular design, the restriction enzyme is unable to cut methylated restriction sites. We can expect different possible restriction profiles through ScaI restriction digestion since there is one ScaI site residing in the pSB1AT3 backbone and we created one ScaI site via a scar inside our memory module. Moreover, we expect to find either an off or intermediate state knowing that the LacH promoter driving the MTase has some basal activity. | ||
| - | + | Figure 1 shows the result of a ScaI restriction digestion of the pSB1AT3/LacH/MTase construct without IPTG induction. The pattern displayed corresponds to a combination of bands indicating an intermediate state between an ‘off’ and ‘on’ situation. Interpretation of the read-out: absence of MTase expression in E. Coli leads to a complete digestion of our plasmid. Two bands of 2989 bp and 1621 bp are then observed (A). On the other hand, incomplete methylation of the plasmid at only one of the two ScaI sites shows a linearized plasmid band 4610 bp. Ultimately, a complete methylation of our memory module prevents ScaI to cut and a typical uncut plasmid profile is observed (C).<br\> | |
| - | + | ||
| - | Figure 1 shows the result of a ScaI restriction digestion of the pSB1AT3/LacH/MTase construct without IPTG induction. The pattern displayed corresponds to a combination of bands indicating an intermediate state between an ‘off’ and ‘on’ situation. Interpretation of the read-out: absence of MTase expression in E. Coli leads to a complete digestion of our plasmid. Two bands of 2989 bp and 1621 bp are then observed (A). On the other hand, incomplete methylation of the plasmid at only one of the two ScaI sites shows a linearized plasmid band 4610 bp. Ultimately, a complete methylation of our memory module prevents ScaI to cut and a typical uncut plasmid profile is observed (C). | + | |
<h4>Writing of our memory module upon IPTG induction</h4> | <h4>Writing of our memory module upon IPTG induction</h4> | ||
| + | [[File:Amsterdam_exp_fig_2.png|300px|right|thumb|Figure 2]] | ||
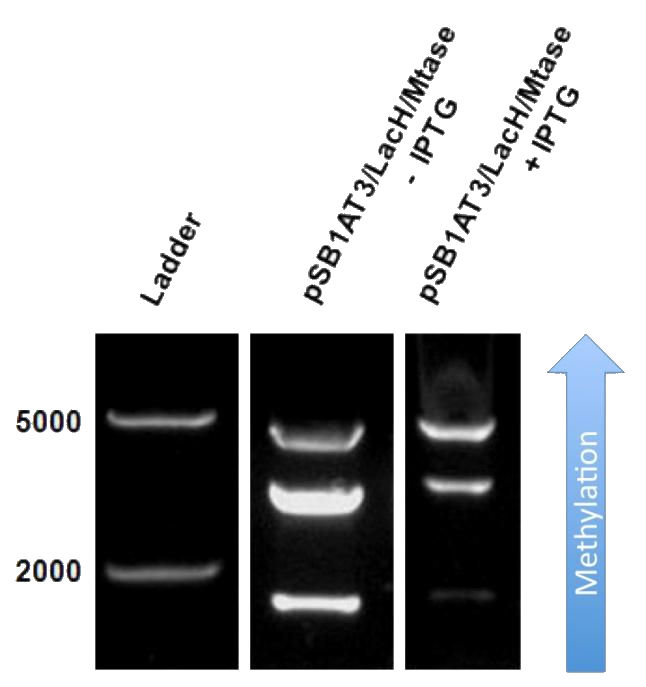
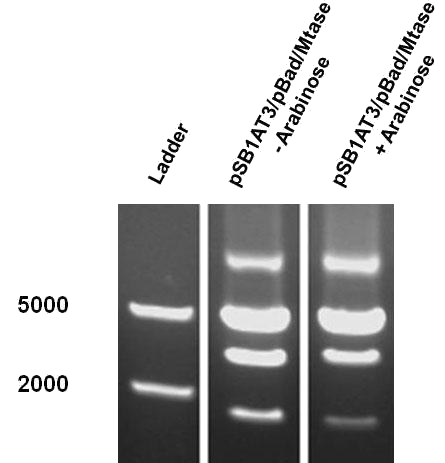
The next step was to see if IPTG-based induction of MTase expression would modify the methylation state of our biobrick thus changing the resulting restriction profile. In the presence of 1mM IPTG, the promoter should be activated providing MTase production inside the cells. Since our [model] for this experiment suggests that methylation occurs at a fast rate we expect that after 16h of IPTG induction, the read-out will dramatically shift to the uncut profile. | The next step was to see if IPTG-based induction of MTase expression would modify the methylation state of our biobrick thus changing the resulting restriction profile. In the presence of 1mM IPTG, the promoter should be activated providing MTase production inside the cells. Since our [model] for this experiment suggests that methylation occurs at a fast rate we expect that after 16h of IPTG induction, the read-out will dramatically shift to the uncut profile. | ||
| - | + | Read-out of our memory module after 16h IPTG induction still shows a partial methylation profile, indicating that our memory module is not fully methylated, we observe a gradual shift towards the uncut plasmid form. That means that IPTG induction leads to an increase of methylation of the plasmid and that our memory module was able to store this information: Our memory module is working!! | |
| - | Figure | + | <h4>Log phase vs stationary phase experiments</h4> |
| + | [[File:Amsterdam_exp_fig_3.png|300px|right|thumb|Figure 3]] | ||
| - | + | Bacteria at different phases of growth are known to react differently upon IPTG induction. When using LacH through IPTG induction it is known that bacteria perform better in the stationary phase because the lac-permease, needed for the correct uptake of IPTG inside the cell, can be quantitatively integrated into the membrane (ref.). Here we aim to try if our system functions better when in the stationary state. | |
| - | + | [[File:Amsterdam_exp_fig_4.png|300px|right|thumb|Figure 4]] | |
| - | + | Figure X shows the restriction profile taken from three different time points; 48, 72 and 96 hours where the first three correspond without induction and the last three have grown in the presence of IPTG. Since it is our understanding that IPTG is not degraded, so therefore no additional IPTG was added. No shift change in restriction profile is witnessed here, meaning that the log phase does not make a difference in this setup. | |
| + | The same bacterial batch was used in both experiments but for the stationary experiment first grown over a longer period of time (at least more then 24 hours), either with or without the inducer. | ||
| - | When comparing the restriction profiles | + | When comparing the different restriction profiles displayed in the figure X, there is a clear visible difference between the different phases of growth. The presence of the IPTG inducer over a longer period of time shows a different restriction read-out, which corresponds to a shift to the uncut plasmid profile. |
<h4>Growth curve digestion</h4> | <h4>Growth curve digestion</h4> | ||
| - | + | [[File:Amsterdam_exp_fig_5.png|300px|right|thumb|Figure 5]] | |
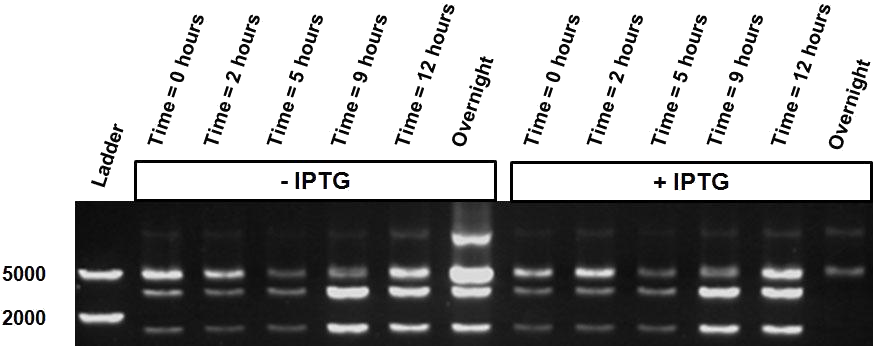
| - | [ | + | During the [growth curve experiment] several samples were taken on different time points to investigate the occurrence of methylation over the progression of time. |
| - | Figure | + | Figure 5 shows first the samples without and then the samples with induction revealing an intermediate restriction profile over the progression of time with a gradual shift toward cut, without methylation, plasmid. But the two samples taken after 24 hours show a difference. The sample with signal shows only uncut, fully methylated, plasmid. |
| - | + | Overall the LacH has worked in the sense that it has shown the activity of the Mtase but did not deliver a restriction profile fitting to the states ‘off’ and ‘on’. Several things can be considered about these findings as were also predicted in the Molecular Design. These experiments have not been performed in the presence of a high quantity of LacI as is suggested to lower the basal activity of LacH. Otherwise references reveal that using LacH in high-copy plasmids creates much more non-specific activity of the LacH than in a low-copy plasmid. | |
| - | + | <h2>Reducing basal activity of the LacH promoter using LacIQ E. Coli strain:</h2> | |
| + | Both modeling and experimental results show a strong basal activity of the LacH promoter leading to a substantial methylation of our memory module, even without IPTG present in the medium. an attempt to get rid of the basal activity of the promoter without induction and create a better ‘off’ state read-out. | ||
| - | + | [[File:Amsterdam_exp_fig_6.png|300px|right|thumb|Figure 6]] | |
| - | + | Since the silencing of the LacH promoter depends on the concentration of the LacI repressor, we chose to replace our standard DH5 E. Coli strain by the LacIQ strain (ref.). Investigation done on the LacH promoter revealed that a higher expression of LacI will show a better suppression and decrease of basal activity of the LacH promoter. | |
| - | + | We transformed our pSB1AT3/LacH/Mtase vector in both DH5 the LacIQ strain and performed a read-out experiment after 24h of growth and under 10 mM IPTG induction. | |
| - | + | The results of the read-out for the LacIQ E. Coli strain are inconclusive. No change in the ScaI restriction patterns are observed between plasmids isolated from both strains. Higher expression of LacI doesn’t reveal a restriction profile that confirms an ‘off’ state nor creates a shift towards an ‘off’ state. | |
| - | |||
| - | < | + | <h2>pBAD experiments</h2> |
| - | + | The Cellular Logbook was further characterised using the pBad promoter. Expression of any gene cloned behind the pBad promoter is controlled by the AraC activator and is believed to be tightly shut off in absence of arabinose. However, minute quantities of arabinose would be necessary to activate the promoter with very fast induction and high levels of expression of the gene (ref 1). Therefore, the pBad promoter was chosen in order to reduce the leakiness observed with the LacH promoter and to enable better characterisation of the Cellular Logbook. | |
| - | |||
| - | <h4> | + | <h4>Read-out</h4> |
| + | [[File:Amsterdam_exp_fig_7.png|300px|right|thumb|Figure 7]] | ||
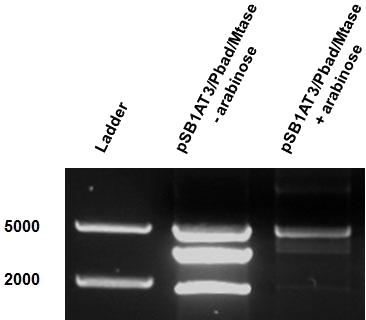
| - | + | The first characterisation experiment involved induction of pSB1AT3/pBad/Mtase in Library Efficient® DH5α™ competent cells (Invitrogen) in stationary phase with 1 % arabinose. The construct was digested with ScaI restriction enzyme after 24 hours incubation at 37˚C. Surprisingly, the same intermediate digestion profile as the LacH was observed. A combination of different methylation profiles can be inferred from the results. In the absence of arabinose, M.ScaI methyltransferase appears to be expressed and a significant number of plasmids present in the culture are fully methylated, accounting for the intense uncut DNA fragment observed. A similar pattern was observed in the presence of arabinose. | |
| - | [ | + | [[File:Amsterdam_exp_fig_8.png|300px|right|thumb|Figure 8]] |
| - | The | + | The second characterisation experiment involved the induction of pSB1AT3/pBad/Mtase in Efficient® DH5α™ competent cells (Invitrogen) in stationary phase with 2 % arabinose and incubation at 37˚C for 48 hours. Subsequent digestion with ScaI restriction enzyme showed a net shift towards the uncut profile is seen. |
| - | < | + | [[File:Amsterdam_exp_fig_9.png|300px|right|thumb|Figure 9]] |
| + | |||
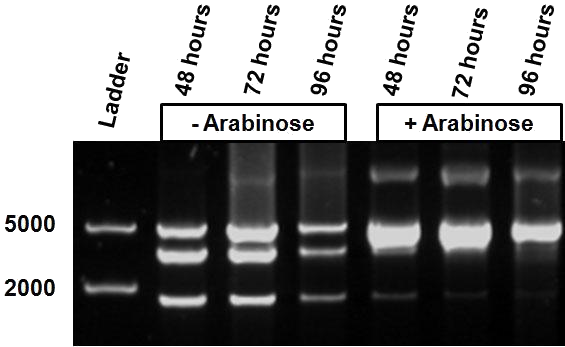
| + | The third characterisation experiment comprised of the stimulation of pSB1AT3/pBad/Mtase in Efficient® DH5α™ competent cells (Invitrogen) in stationary phase with addition of 2% arabinose daily. Samples were taken after 48, 72 and 96 hours, and digested with ScaI restriction enzyme. These results are consistent with the previous results, showing a gradual shift towards the “on-mode” with induction of the pBad promoter by addition of arabinose daily. | ||
| + | Unfortunately, the “off-mode” was not achieved in the absence of arabinose. All the experiments have been conducted into the high copy number plasmid pSB1at3. It is known that leaky expression is relative to the copy number of the plasmid (ref 2). Hence, the inability of the Cellular Logbook to show an “off-mode” in the absence of the signal could be attributed to the high copy number plasmid used in these experiments.<br\><br\><br\><br\><br\><br\> | ||
| - | |||
| - | |||
| - | |||
| - | |||
<h4>Growth curve digestion</h4> | <h4>Growth curve digestion</h4> | ||
| + | |||
| + | [[File:Amsterdam_exp_fig_10.png|300px|right|thumb|Figure 10]] | ||
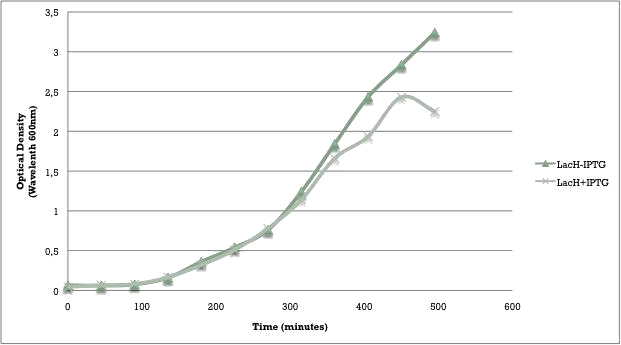
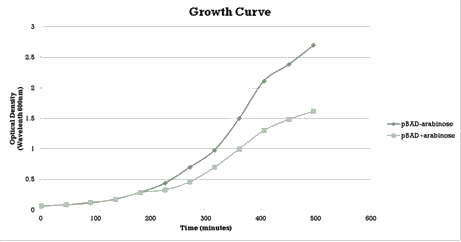
As with the LacH a growth curve experiment was conducted in similar fashion to characterize the acquired construct of pSB1AT3+pBAD+Mtase. | As with the LacH a growth curve experiment was conducted in similar fashion to characterize the acquired construct of pSB1AT3+pBAD+Mtase. | ||
| - | |||
| - | |||
Over the course of time the methylation pattern found in the gel show a shift towards the ‘on’ digestion profile in the presence of arabinose. After 24 hours though the digestion profile shows a complete ‘off’ state again. This is probably due to the E. coli using arabinose when it reaches the stationary phase and needs to find a different energy source for its metabolism. | Over the course of time the methylation pattern found in the gel show a shift towards the ‘on’ digestion profile in the presence of arabinose. After 24 hours though the digestion profile shows a complete ‘off’ state again. This is probably due to the E. coli using arabinose when it reaches the stationary phase and needs to find a different energy source for its metabolism. | ||
| + | |||
| + | |||
| + | <h2>References:</h2> | ||
| + | 1.http://www.ncbi.nlm.nih.gov/pmc/articles/PMC177145/pdf/1774121.pdf | ||
| + | 2.http://ac.els-cdn.com/S0378111904003361/1-s2.0-S0378111904003361-main.pdf?_tid=d1c81108-07de-11e2-aa0c-00000aacb35e&acdnat=1348666615_d506fa1671c164e61668bda06b5c3d01 | ||
| + | |||
</div> | </div> | ||
</div> | </div> | ||
{{Team:Amsterdam/Foot}} | {{Team:Amsterdam/Foot}} | ||
Latest revision as of 21:26, 26 September 2012
 "
"


