Team:University College London/Module 1/Modelling
From 2012.igem.org
Erinoerton (Talk | contribs) (→Results) |
Erinoerton (Talk | contribs) (→Reactions taking place in the model) |
||
| Line 59: | Line 59: | ||
| R5 || POPexmRNANahr.Psal → GFP.mRNA|| 0.11 || Transcription rate of GFP in molecules/sec (for GFP size 720bp<sup>10</sup>, transcription rate in E.coli 80bp/sec<sup>8</sup>) | | R5 || POPexmRNANahr.Psal → GFP.mRNA|| 0.11 || Transcription rate of GFP in molecules/sec (for GFP size 720bp<sup>10</sup>, transcription rate in E.coli 80bp/sec<sup>8</sup>) | ||
|- | |- | ||
| - | | R6 || GFP.mRNA → GFP|| 0. | + | | R6 || GFP.mRNA → GFP|| 0.084 || Translation rate of GFP in molecules/sec (for GFP size 240aa<sup>10</sup>, translation rate in E.coli 20aa/sec<sup>8</sup>) |
|- | |- | ||
| R9 || GFP.mRNA → 0 || 0.03 || Degradation rate of GFP mRNA product<sup>11</sup> must be taken into account due to suboptimal conditions | | R9 || GFP.mRNA → 0 || 0.03 || Degradation rate of GFP mRNA product<sup>11</sup> must be taken into account due to suboptimal conditions | ||
Revision as of 15:49, 21 September 2012
Contents |
Module 1: Detection
Description | Design | Construction | Characterisation | Modelling | Conclusions
Modelling
As our detection module is so closely tied up with our degradation module, our cell model for this module examines the hypothetical expression of GFP on detection of POPs. This allows us to assess the efficacy of detection as a stand-alone module before we look at its performance when incorporated into our degradation system.
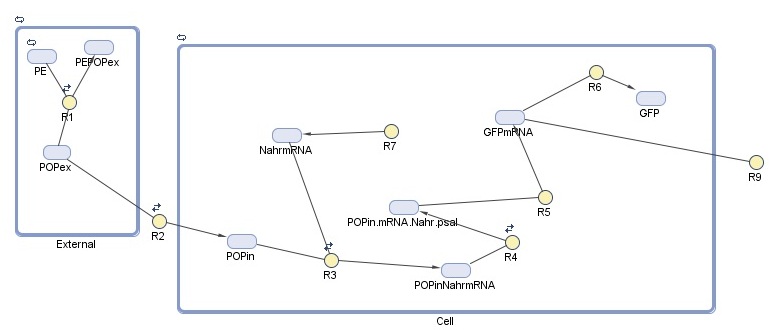
Our cell model for detection was created in SimBiology. This MathWorks software is a MATLAB extension that allows specification of the species, reactions, and compartments that make up a system - in our case, the cell and the external environment - and to run simulations on the specified system. For this module, we are interested in detection response, which we represent here as GFP production. The model is composed of two compartments:
-External represents the constant association and disassociation of persistent organic pollutants (POPs) that takes place in the ocean.
-Cell represents the reactions taking place inside the cell
Species
| Species | Initial value (molecules) | Notes |
|---|---|---|
| PE | 0.044 | Polyethylene found in North Pacific Gyre (value per cubic metre)1,2 |
| POPex | 0.0 | Persistent organic pollutants (ex = extracellular) that are not adhered to plastic surface |
| PEPOPex | 9.24E-5 | Persistent organic pollutants (ex = extracellular) that are adhered to the plastic surface3 |
| POPin | 0.5 | Persistent organic pollutants (in = intracellular) assumed from E. coli membrane permeability 4 |
| mRNANahR | 0.0 | NahR mRNA product |
| POPinNahR | 0.0 | Complex of the above two molecules |
| POPinNahRpSal | 0.0 | Complex of the above molecule and pSal (promoter that induces laccase transcription) |
| GFP | 0.0 | Green fluorescent protein |
| GFPmRNA | 0.0 | GFP mRNA product |
Reactions taking place in the model
| Number | Reaction | Reaction rate (molecules/sec) | Notes |
|---|---|---|---|
| R1 | PE + POPex ↔ PEPOPex | Forward: 1000 Backward: 1 | Pops have 1000 to 10000 times greater tendency to adhere to plastic than float free in the ocean5 |
| R2 | POPex ↔ POPin | Forward: 0.6 Backward: 0.4 | Based on membrane permeability4: diffusion gradient |
| R3 | POPin + mRNA.Nahr → POPin.mRNA.Nahr | Forward: 1 Backward: 0.0001 | Based on the assumption that the chemical structure/size of POPs is similar to salycilate6. Salycilate binds to the NahR mRNA product, which complex then binds to the pSal promoter. |
| R7 | 0 → mRNA.Nahr | Forward: 0.088 Backward: 0.6 | Transcription rate of NahR in molecules/sec (for NahR size 909 bp7, transcription rate in E.coli 80bp/sec8) under constitutive promoter control |
| R4 | POPinmRNANahr → POPinmRNANahr.Psal | Forward: 78200 Backward: 0.191 9 | NahR to pSal binding based on the assumption that POP-NahR binding has no effect on NahR-pSal binding |
| R5 | POPexmRNANahr.Psal → GFP.mRNA | 0.11 | Transcription rate of GFP in molecules/sec (for GFP size 720bp10, transcription rate in E.coli 80bp/sec8) |
| R6 | GFP.mRNA → GFP | 0.084 | Translation rate of GFP in molecules/sec (for GFP size 240aa10, translation rate in E.coli 20aa/sec8) |
| R9 | GFP.mRNA → 0 | 0.03 | Degradation rate of GFP mRNA product11 must be taken into account due to suboptimal conditions |
Results
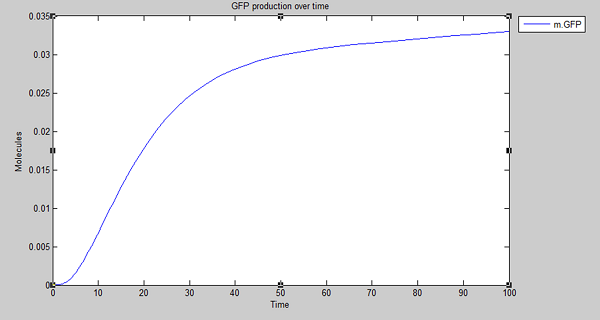
Our model shows the expected output - production of GFP on detection of persistent organic pollutants. With this in mind and satisfied that degradation is working as expected in silico, we extended the model to create the cell model for degradation
References
1. Goldstein M, Rosenberg M, Cheng L (2012) Increased oceanic microplastic debris enhances oviposition in an endemic pelagic insect, Biology Letters 10.1098
2. Andrady AL (2011) Microplastics in the marine environment. Marine Pollution Bulletin 62: 1596-1605
3. To follow
4. To follow
5. Mato Y, Isobe T, Takada H, Kanehiro H, Ohtake C, Kaminuma T (2001) Plastic Resin Pellets as a Transport Medium for Toxic Chemicals in the Marine Environment. Environ. Sci. Technol. 35: 318-324
6. https://2011.igem.org/Team:Peking_S/project/wire/harvest
7. http://www.xbase.ac.uk/genome/azoarcus-sp-bh72/NC_008702/azo2419;nahR1/viewer
8. http://kirschner.med.harvard.edu/files/bionumbers/fundamentalBioNumbersHandout.pdf
9. Park H, Lim W, Shin H (2005) In vitro binding of purified NahR regulatory protein with promoter Psal. Biochimica et Biophysica Acta 1775: 247-255
10. http://partsregistry.org/wiki/index.php?title=Part:BBa_I13522
11. To follow
 "
"

