Team:University College London/Module 5/Modelling
From 2012.igem.org
Contents |
Module 5: Salt Tolerance
Description | Design | Construction | Characterisation | Modelling | Results | Conclusions
Effects of IrrE on E. coli salt tolerance
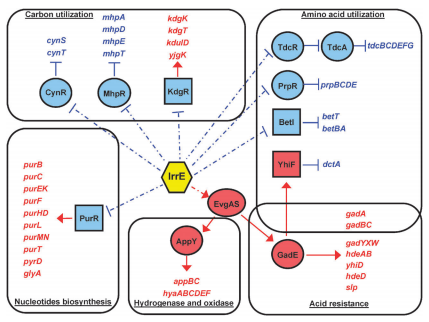
The regulation of irrE in E. coli is represented in the diagram below. As previously mentioned in our research page, the IrrE gene makes cells more resistant to stress caused from suboptimal environmental conditions. IrrE has a complex effect on the cell’s metabolism, triggering changes and cascade changes in multiple genes, as seen below. It represses several reactions (blue) and also it induces others (red).
We used the COBRA Matlab extension, which is designed to analyse the flux in cell growth caused in E. coli by altering biochemical reactions in the model. In our case, we used a tool that is specifically designed for gene knockout, wherein a gene which is already present in the uploaded model is removed and the resultant effect on cell growth analysed.
Aim: To investigate how the gene knockout affects the rate of growth of both wild type and modified E. coli, which has IrrE added under the hypothesis that it allows for better cell growth under high salt concentration conditions. As the environmental conditions cannot be changed in COBRA, we had to test the effect on IrrE under zero salt presence in the environment.
Hypothesis: There is greater growth for the modified bacterium when compared to wild-type E. coli.
Expectations: We expect modified E. coli to grow at a higher rate in comparison to that of wild type E. coli. This is because since in higher salt concentrations, IrrE enables better growth, we also expect this result in zero or low salt concentrations.
Methods
Input: The input specifies which gene to knock out. In this case, it is b4014 which is present in the model and which corresponds to the aceF gene.
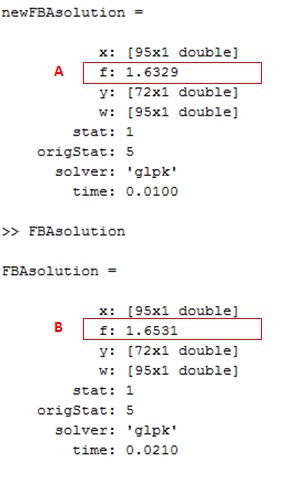
Output: In the screen shot below from COBRA, the simulation for cell growth for both wild-type and modified E. coli. Output A shows the cell growth rate for wild-type E. coli, with a value of 1.6531, while output B shows the cell growth for the modified bacterium with a value of 1.6329.
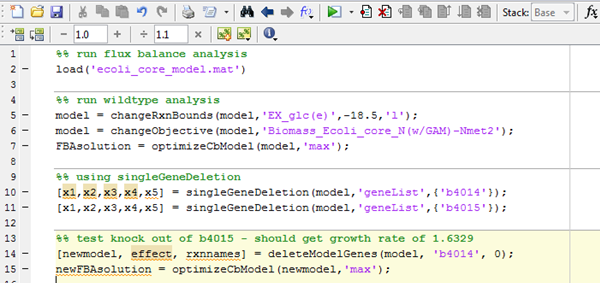
The diagram below shows a screen shot of the code used. The command on line 5 specifies glucose as a substrate for the system, with all other conditions (oxygen supply, carbon availability, etc) set to the default value. On lines 10 and 11, the genes to knock out (b4014, which is the aceF gene) are specified. Lines 14 and 15 are commands to run the program for both the original (no gene knockouts) model and the modified model.
Results & Discussion
It can be seen that IrrE negative bacteria (wild-type) shows greater growth (1.6531) in comparison to IrrE positive bacterium (1.6329). This disproves the hypothesis that IrrE positive E. coli has the larger growth rate, a result which was also noted in experiments.
References
Earl M., Mohundro M., Mian I., Battista J. (2002) The IrrE Protein of Deinococcus Radiodurans R1 is a Novel Regulator of recA expression; J Bacteriol. 184(22): 6216–6224. doi: 10.1128/JB.184.22.6216-6224.2002
Schellenberger, J., Que, R., Fleming, R. M. T., Thiele, I., Orth, J. D., Feist, A. M., Zielinski, D. C., Bordbar,A., Lewis, N. E., Rahmanian, S., Kang, J., Hyduke, D. R., and Palsson, B. . (2011). Quantitative prediction of cellular metabolism with constraint-based models: the COBRA toolbox v2.0. Nature protocols, 6(9):1290–1307. PMID: 21886097.
Zhou, Z., Zhang, W., Chen, M., Pan, J., Lu, W., Ping, S., Yan, Y., Hou, X., Yuan, M., Zhan, Y., and Lin, M. (2011). Genome-wide transcriptome and proteome analysis of escherichia coli expressing IrrE, a global regulator of deinococcus radiodurans. Molecular bioSystems, 7(5):1613–1620. PMID:21380435.
 "
"


