"
"
Team:UNITN-Trento/Project
From 2012.igem.org
Crust Away
 Introduction
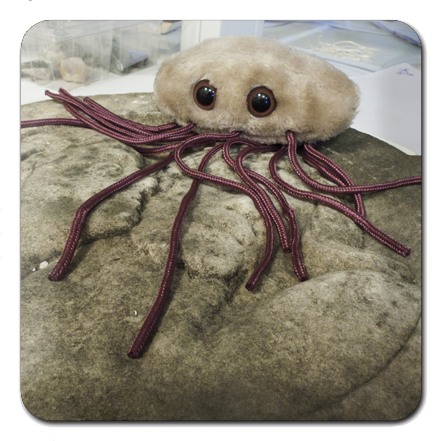 Our Method
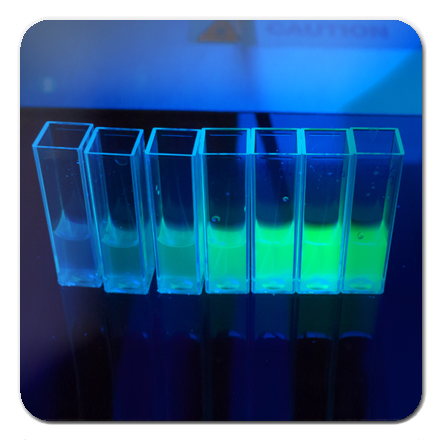 Results
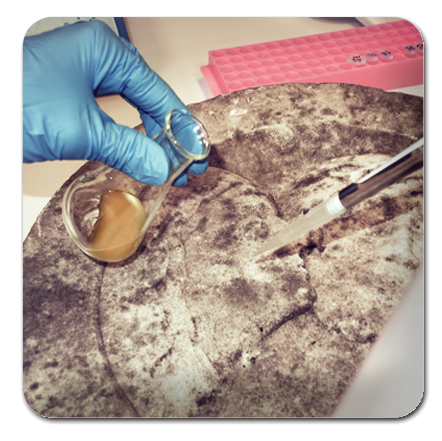 Application
 Terminators
INTRODUCTION
Have you ever noticed that ugly black crust found on many precious monuments and statues? Here in Italy, we surely have it, and we’d like to find a way to return our monuments to their natural, beautiful state.

Our idea is to create a bioremediation kit to help every sculptor, restorer, marble cutter or anyone interested in removing that ugly and harmful black crust layer from their precious calcareous stones. Our target is the gypsum layer (i.e. CaSO4⋅2H2O) that is the main component of the black crust. A lot of chemical and mechanical approaches are already on the market, and some have also exploited in the past Sulfur Reducing Bacteria (SRB) to eliminate the trapping gypsum matrix (1, 2).
However all of these methods show some weak points:
- Chemical and mechanical methods are too invasive and they risk to damage the underlying and precious marble surface; We have met with experts in the restoration field and learned about the criteria to define a good restoration.
- Chemical methods have also health related risks. Workers, artists, restorers too often use chemicals to clean marble stones in unsafe conditions. We have met with one of the many local artists and reported our impressions on his methods to clean marble in the Art & Science section of our Wiki.
- Natural SRB, which have been used in a few cases, instead need anaerobic conditions and they constitutively express the enzymes required for sulphur reduction, thus not leaving the choice to the operator to control the rate and amount of sulphur reduced.
- Work in AEROBIC conditions: this is a breakthrough in the field of SRB!
- Should be CONTROLLED and MODULATED as needed.
- Should NOT be INVASIVE and work selectively against the gypsum matrix without touching the calcareous surface.
- Should be CHEAP and EASY TO APPLY. There will be no more need of expensive chemical and trained workers that have to work many hours to clean our statues and monuments.
To summarize, with our biological system we want to mix the strengths of all the available methods and eliminate their weak points to propose an infallible and very safe method to clean precious marble pieces!
How does the black crust form?
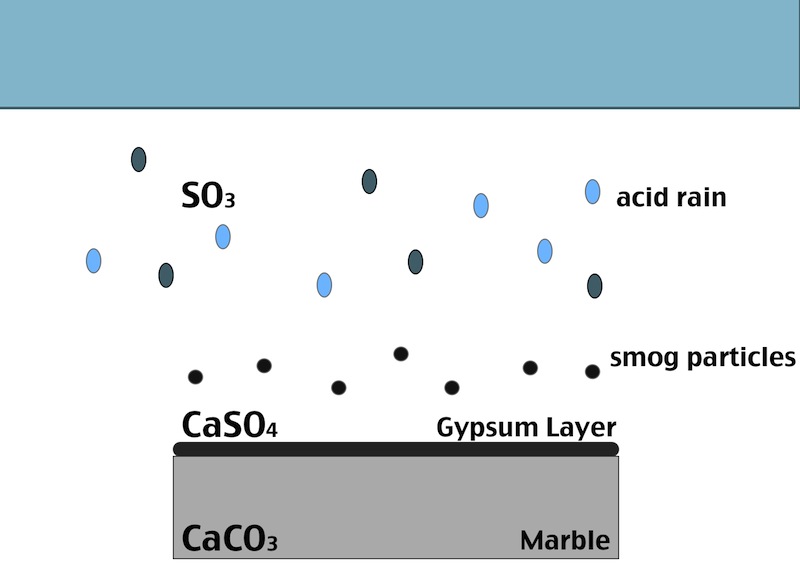
One of the main factors in the formation of the black crust is the atmospheric pollution. The burning process of fossil fuels leads to an increase in the concentration of some acid gases in the atmosphere. In particular SO2 when reacts with water induces the transformation of calcite (CaCO3, present in the stone substrate) into gypsum (CaSO4·2H2O), which precipitates with inclusions of carbon particulate matter.
The black crust is usually found on areas of the stone sheltered from rainfall, although still in presence of capillary water flowing through the pores. Calcium ions migrate to the surface of the stone during gypsum formation, leading to formation of cavities beneath the stone that weakens the stone’s integrity. The degradation process indeed affects both the stone conservation and appearance:
- When the formed gypsum is washed away it takes some of the stone particles with it, causing at first loss of detail, but eventually leading, again, to a loss of structural integrity.
- In areas sheltered from rainwater, though, gypsum crust remains. When combined with particulate matter from the atmosphere, gypsum creates the so called black crust.
OUR METHOD
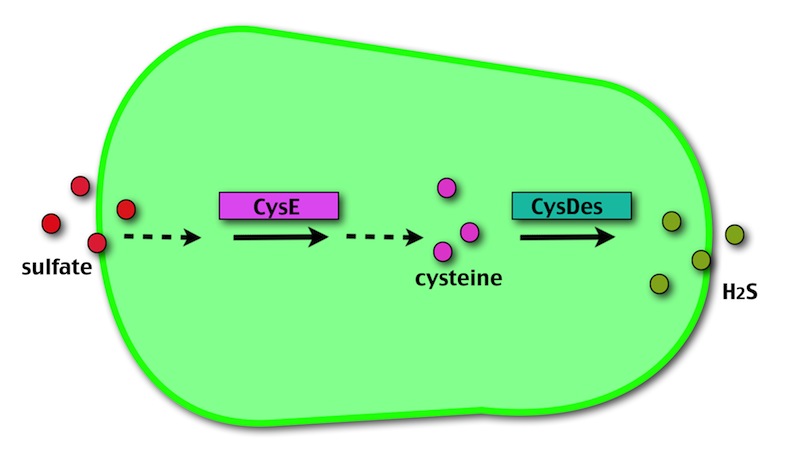
Our method exploits an engineered E. coli to reduce aerobically the sulphuric gypsum layer in a controlled and modulated manner. In 2000 the Keasling group engineered bacteria to reduce sulphate aerobically and precipitate metals from water taking advantage of the production of hydrogen sulfide as one of the bioproducts of sulphur reduction (3). We took inspiration from this work and developed two new BioBrick devices directed to overproduce cysteine and then convert it to sulphide with the ultimate goal of dissolving the sulphate layer deposited on the blackened stones.
Who are the players?
- CysE is a Serine acetyltransferase that mediates conversion of L-serine to a precursor of L-cysteine in E. coli. More precisely we have used a mutant CysE (M256I) that has enhanced activity in that its enzymatic activity is less sensitive to feedback inhibition by cysteine (4).
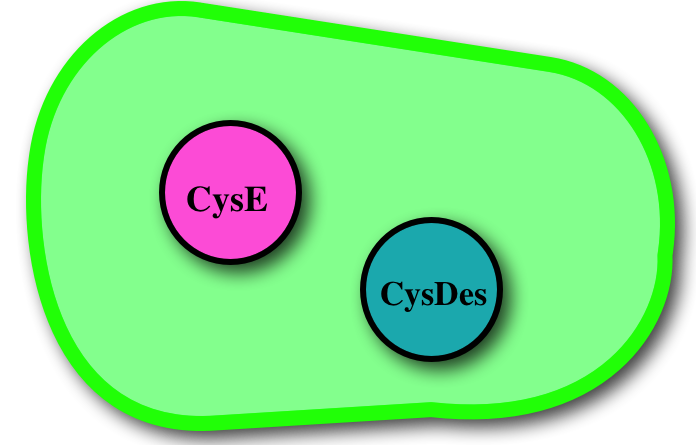
- CysDes is a Cysteine Desulfhydrase, first isolated in Treponema denticola, an anaerobic organism involved in periodontal diseases. It is an aminotransferase that converts cysteine into pyruvate, ammonia, and hydrogen sulphide (5).
How do we control the expression of our devices?

The expression of CysE is controlled by an arabinose inducible cassette (our Part BBa_K731201). Our composite Device (BBa_K731030) is composed by araC–pBad, a strong RBS and the gene encoding M256I CysE (our Part BBa_K731010).
The pBAD promoter is activated in the presence of L-arabinose. L-arabinose binds to the AraC protein and inactivates its inhibitory function, allowing the RNA polymerase to recognize the pBAD promoter and start the transcription of CysE.
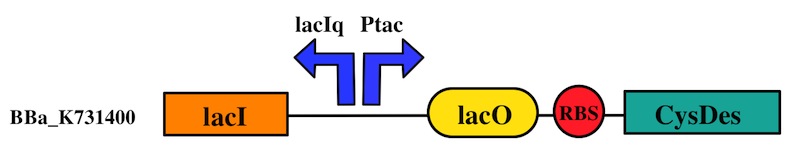
CysDes was placed downstream of an IPTG inducible cassette (our Part BBa_K731300). The expression of CysDes is therefore controlled by a system composed of: LacI (repressor protein) and a lacIq promoter followed by a strong hybrid promoter (Ptac), a Lac Operator and a strong RBS. Addition of IPTG inactivates the LacI repressor, thus allowing the expression of our gene of interest CysDes.
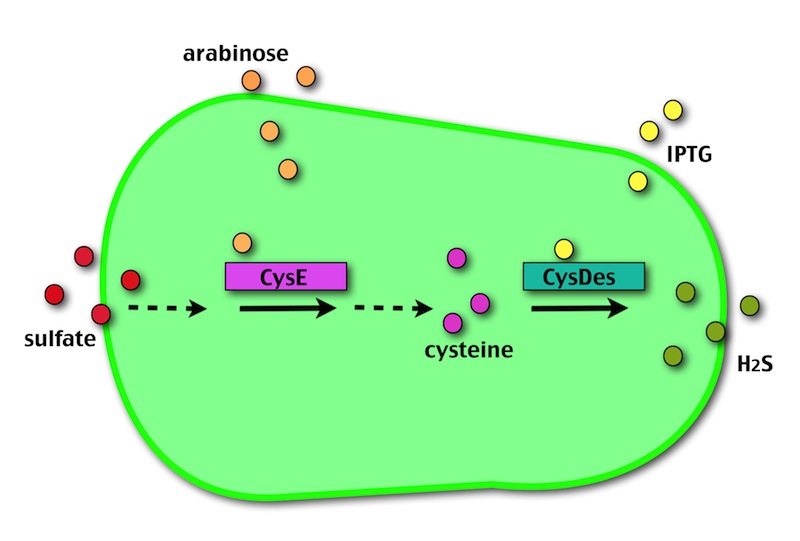
The possibility of controlling simultaneously the expression of our two devices (i.e. by adding arabinose and/or IPTG) makes our system more SAFE, CONTROLLABLE and MODULAR.
How do we test the expression of our enzymes?
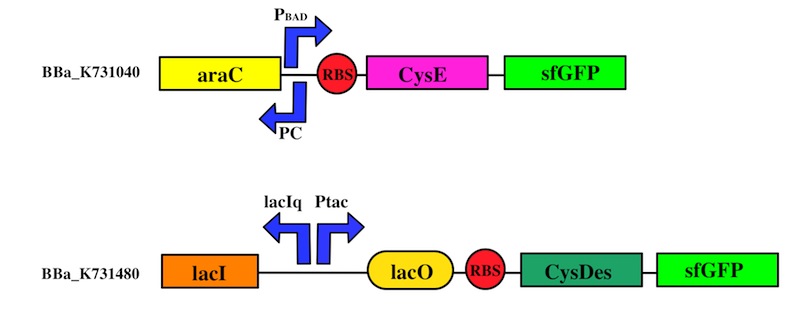
We used the Gibson assembly method to create two sfGFP-tagged devices that were useful reporter to verify the expression of our genes.
RESULTS
All the experiments herein reported were done transforming our parts into E. coli strain NEB10β grown in MOPS medium unless specified. In addition to the parts submitted to the Registry of Standard Parts we also have subcloned some of our parts into medium/low copy vectors with different antibiotic resistances, to transform the two plasmids simultaneously. For each experiment it will be specified the exact part used.
Which of our bacteria do you want to read about?
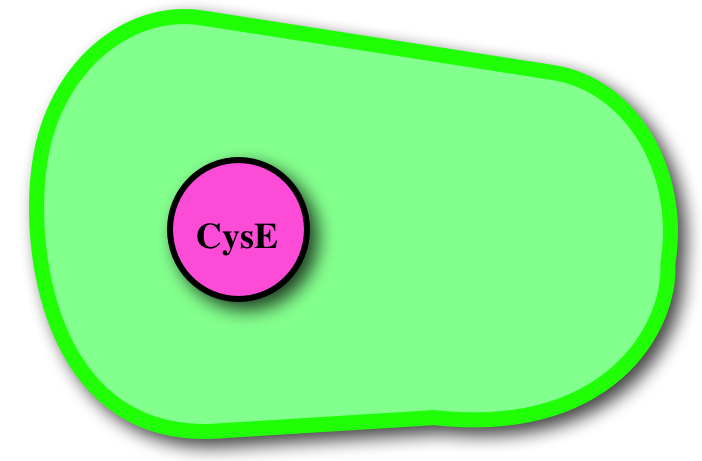

CysE
Pinker is better!
CysE is our keyplayer in the destruction of the black crust. It catalyses the production of O-acetyl-L-serine, a precursor for cysteine. When cysteine is produced, E. coli needs more sulfate, resulting in the assimilation of the black crust gypsum layer.
Therefore production of cysteine means reduction of sulfate.
To assess if our devices producing CysE function in vivo we have measured the concentration of cysteine produced and secreted in the medium with ninhydrin, a small organic compound that reacts with different alpha-aminoacids at different pH (6). In the presence of cysteine at low pH the solution turns pink within a few minutes. The reaction between cysteine and ninhydrin at low pH also gives a characteristic UV-VIS spectrum with an absorbance maximum peak at 560 nm.
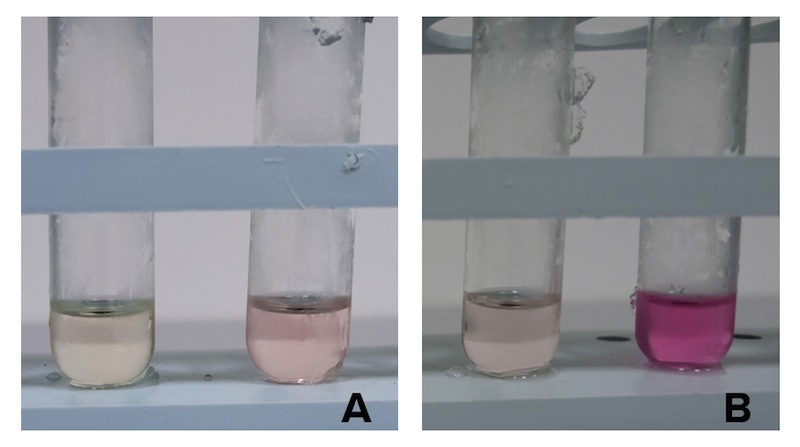
Figure 1: NEB10β cells with an without Part BBa_K7310130 (i.e. CysE) operated in the low copy vector pSB3C5 were grown in MOPS, supplemented with K2SO4 and glucose as carbon source, and induced with 5 mM Arabinose. After overnight induction a 0.5 mL aliquot was taken from each sample. To each aliquot it was added 0.5 mL of glacial acetic acid and 0.5 mL of Ninhidrin reagent prepared as described in our protocol page. Panel A: NEB10β cells before induction (left) and after overnight induction (right). Panel B: Cells transformed with BBA_K731030 before induction (left) and after overnight induction (right).
Cells transformed with CysE, grown in MOPS and induced with 5 mM arabinose were assayed with ninhydrin along with empty NEB10β cells, and left to grow overnight. Samples taken before induction served as controls. The data show that when induced with arabinose cells expressing CysE produce a significant amount of cysteine that can be quantified by comparison with a calibration curve built with known concentration of cysteine. We estimated that after one night of induction in MOPS supplemented with glucose and K2SO4 it was produced 0.025 mM cysteine. The experiment was repeated in triplicates. A light pink colour was observed in a few cases with empty cells grown overnight, indicating that endogenous cysteine is produced in small amounts.
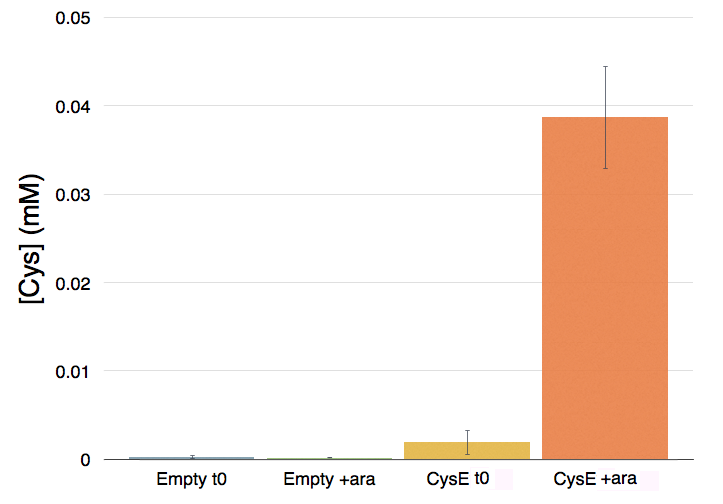
Figure 2: Quantification of cysteine production. From left to right: NEB10β before induction, NEB10β after induction and overnight growth, cells transformed with CysE (BBa_K731030) before induction and after induction and overnight growth.
MOPS with glucose or glycerol?
After a deep analysis of CysE expression levels, toxicity, and production of cysteine we determined that the perfect medium to our purposes was MOPS supplemented with glucose. Below it is illustrated the road that brought us to this conclusion.
To better control protein expression, we used two different recipes of the MOPS minimal medium: one with glucose as the carbon source (MOPS B), the other with glycerol (MOPS A).
Glucose is an inhibitor of the araC-pBAD promoter, while glycerol does not have a comparable inhibitory mechanism. We have tested the effect of these two different MOPS medium on cells growth and cysteine production with the intention of determining the best growth protocol for our future applications on the statues.
To this purpose, we have first analyzed the amount of protein produced in the two media by looking at fluorescence intensity using our sfGFP tagged reporter of CysE (BBa_K731040).
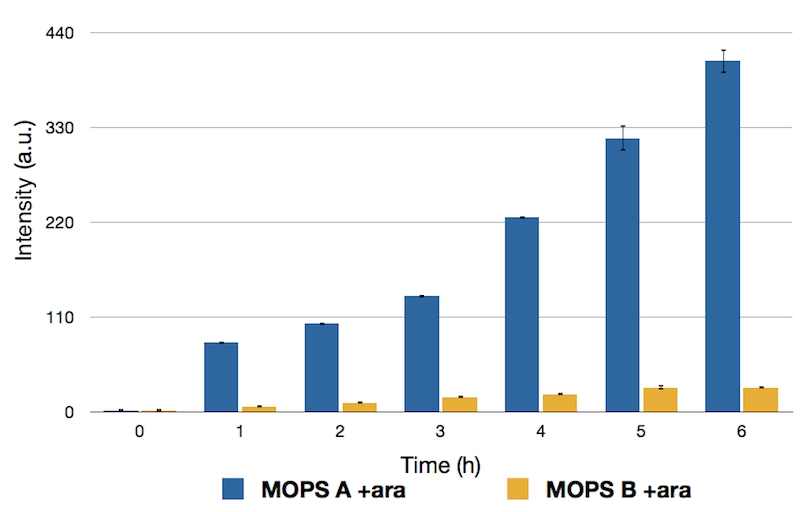
Figure 3: Fluorescence intensity of CysE-sfGFP (BBa_K731040) after induction with arabinose (ara). MOPS supplemented with glycerol (A) is shown in blue, MOPS supplemented with glucose (B) is shown in yellow.
Protein levels obtained in the medium supplemented with glycerol were significantly higher than those obtained in MOPS supplemented with glucose because of the inhibitory mechanism of glucose.
In glycerol, thus, cells are producing a lot of CysE. To assess if and how CysE production is affecting cell growth, we perfomed serial dilutions at 8h after induction.
However, to our surprise cysteine production behaved differently. We tested cysteine production of cells samples uninduced and induced overnight in the two different media.
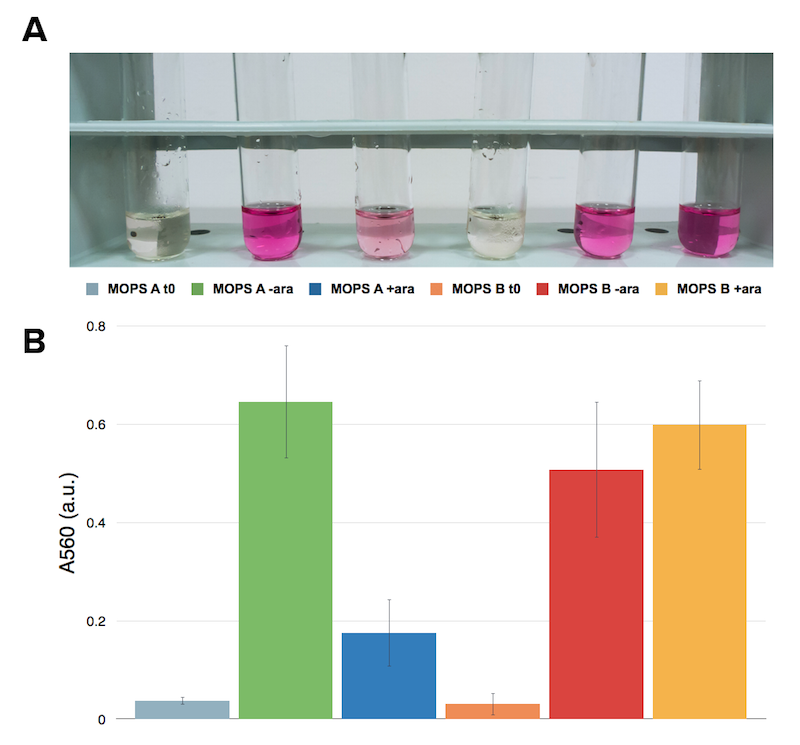
Figure 4: Ninhydrin assay on NEB10β expressing Part BBa_K731030. A representative replicate is shown. From left to right samples are: CysE in MOPS A before induction, CysE in MOPS A not induced grown overnight, CysE in MOPS A induced grown overnight, CysE in MOPS B before induction, CysE in MOPS B not induced grown overnight, CysE in MOPS B induced grown overnight. MOPS supplemented with glycerol (A), MOPS supplemented with glucose (B).
Surprisingly cysteine production was higher in the uninduced sample grown in glycerol. In glucose the situation was the opposite and we had high cysteine production in the induced sample. This effect was contrasting with protein expression levels that we observed. We then hypothesized that high expression of CysE could have a toxic effect on the cells, which could explain why in glycerol we observed a lower cysteine concentration in the induced sample.
To address this problem we have analyzed the toxicity effect of CysE production by counting the number of colonies survived after 8 hours.
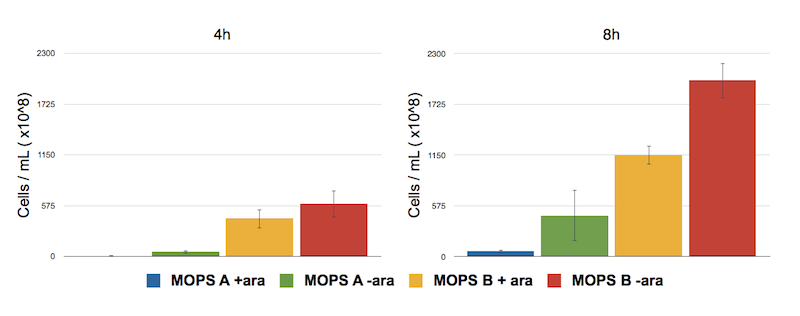
Figure 5: Toxicity effect of CysE by serial dilution. NEB10β cells transformed with Part BBa_K731030 were grown in MOPS supplemented with glycerol (60 mM, MOPS A) and glucose (30 mM, MOPS B). After 4 and 8 h of induction with arabinose a 500 μl aliquot of cells was taken to make serial dilution on LB agar plates. Cell number was calculated with the following formula: Cells/mL = (# colonies counted)*(dilution factor)/(mL of culture plated).
The serial dilution test confirmed our theory: when cells are induced in glycerol they show very high expression levels, but few cells can cope with this pressure. Even if each of these few cells is actually producing much CysE, the cell doesn’t have the capabilities to sustain such high cysteine production, which is not achieved in a single step reaction (i.e. a bottleneck is reached with other enzymes).
When cells in glycerol are not induced, CysE production is decreased, allowing more cells to survive and producing higher amounts of cysteine.
In glucose the situation is the opposite: we have many cells, but low expression due to the glucose inhibitory effect on the araCp-BAD promoter. All these cells are producing low amounts of CysE, leaving the cells more “healthy” and able to produce high cysteine concentrations.
To summarize we decided that MOPS supplemented with glucose was the best compromise between protein expression and cysteine production, which ultimately means more sulfate reduced!
CysDes
Green means H2S production!
CysDes is the second player in our system. It transforms cysteine into ammonia, pyruvate and sulfidric acid (H2S).
H2S production is the fundamental proof that intracellular cysteine being accumulated has been used by the enzyme and that our part operates correctly.
We assayed and quantified the production of H2S with a colorimetric assay that takes advantage of the production of methylene blue when M N,N-dimethyl-p-phenylenediamine sulfate reacts with produced H2S (7).
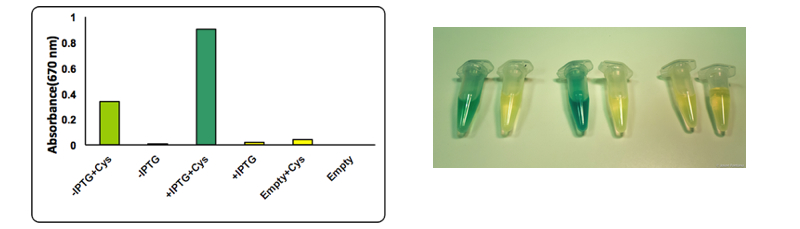
Figure 6: The test was performed on a cell lysate obtained as described in our protocol page. Briefly, to each cell lysate it was added 0.1 mM cysteine and the samples were placed at 37°C for 1 hour. After the incubation at 37 °C 0.1 mL of a 0.02 M N,N-dimethyl-p-phenylenediamine sulfate solution and 0.1 mL of a 0.3 M FeCl3 solution were added to the lysate. The development of the color was immediate and it could be observed both by naked eye and by UV-VIS at 670 nm. The assay was performed in triplicates using BBa_K731400 in the low copy vector pSB4K5. From left to right: CysDes -IPTG + cysteine, -IPTG, + IPTG + cysteine, + IPTG; Empty NEB10β cells with cysteine and - cysteine.
Upon induction with IPTG cells expressing CysDes produced H2S depending on the addition of cysteine. Uninduced cells still produced a small amount of H2S that can be explained by the small basal expression that was observed (see results on BBa_K731480). A small basal expression could in fact be enough to produce significant concentrations of the enzyme for catalytic activity. Empty cells instead did not show any production of H2S as expected.
H2S production is dependent on cysteine availability. We decided to assess the efficiency of the enzyme by quantifying more precisely the amount of H2S formed using a calibration curve made with different concentrations of Na2S. We estimated that the concentration of H2S produced in the presence of 0.1 mM of cysteine is about 0.1 mM after 2 hours from the induction.
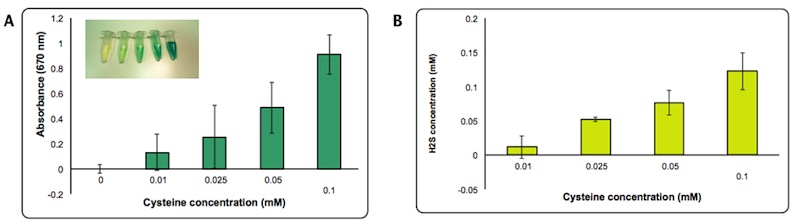
Figure 7: Quantification of H2S produced by Part BBa_K731400. Panel A: Intensity of Absorbance at 670 nm at different concentration of cysteine. Panel B: Concentration of H2S produced calculated based on a standard curve made with Na2S.
We assessed the production of H2S by several qualitative and more quantitative assays:
- Gas Chromatography
- Lead acetate strips
- Copper precipitation
- Triple sugar iron test
Rotten eggs are dangerous?
Up until now we used colorimetric assays and standard curves to prove and quantify the presence of H2S. However, hydrogen sulfide is a (toxic and poisonous) gas and as such it can be detected by Gas chromatography. To confirm the presence and estimate the concentration of H2S produced we asked the help of an expert in gas Chromatography in the physics department. Damiano Avi came one day to the lab with his portable gas chromatographer (MICROGC A3000 Agilent) equipped with a 50C Poraplot U column for the detection of H2S. Damiano keeps his H2S stock in 10 L champagne bottles, because they can hold really high pressure!
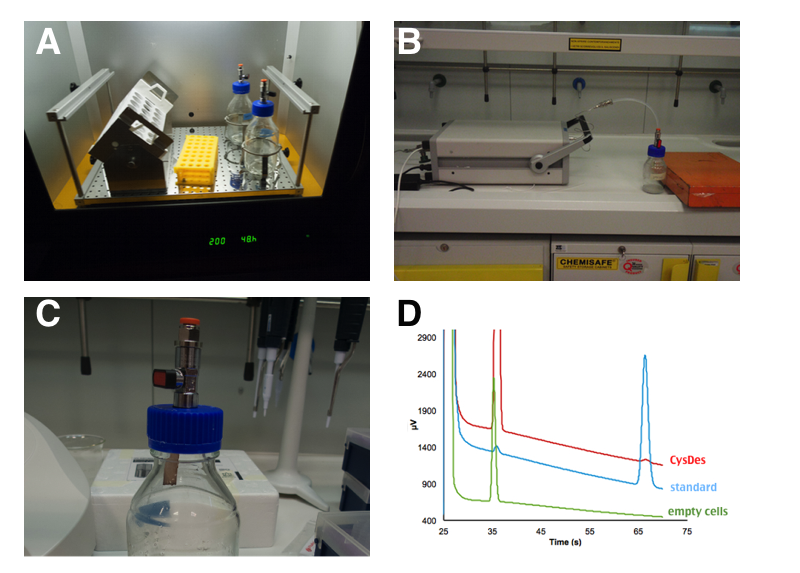
Figure 8: PANEL A: 50 mL of cells were grown in LB in a 250 mL sterile bottle with a modified screw cap that allows to connect the bottle directly to the instrument. PANEL B: After 4 hours of induction, with 0.1 mM IPTG, the bottle was attached to a portable gas chromatographer (MICROGC A3000 Agilent). PANEL C: H2S formation was qualitatively assessed by exposure to lead acetate test strips for few seconds. PANEL D: Gas Chromatography analysis of NEB10β cells with and without BBa_K731480. Measurements were taken 3 times at intervals of 2 minutes. A calibration curve was done with H2S.
We estimated that a sealed 50 mL culture of E. coli carrying our BBa_K731480 after 4 hours of induction accumulated between 20 and 30 ppm of H2S in a 250 mL bottle. This of course is the concentration of H2S accumulated in the sealed bottle. If the bottle were open, such a high value would not have been reached.
As you can read in our H2S section these concentrations are not an immediate risk for human health. Nevertheless is absolutely not advisable to inhale (or smell) such quantities for a prolonged time, and for this reason we took all the possible precautions to work in the safest conditions (see more in our safety section).
Measuring H2S production by an indirect method: free copper concentration in the solution
In this second approach we exploited the formation of complexes between sulfide and metal ions. Briefly, adding a copper salt to the medium of an induced culture we observed a decrease of the free copper concentration as function of time, due to the precipitation of copper sulfide. The free copper concentration was measured after adding bathocuproinedisulfonic acid (BCS) (a chemical which turns orange when it reacts with Cu2+ and measuring the absorbance by UV-VIS at 483nm. We tried to obtain an estimation of the free copper using a standard curve made with different concentrations of Cu2+. This test was done using only once using Part BBa_K731400 and therefore quantitative data cannot be extrapolated surely.
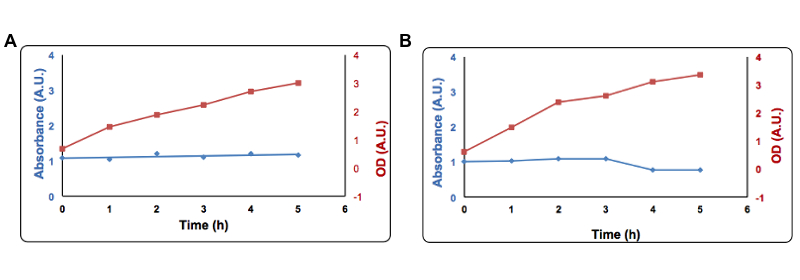
Figure 9: Copper precipitation by CysDes. Cells transformed with Part BBa_K731400 (i.e. CysDes) were grown in LB in the presence of 2 mM Copper sulfate.To the supernatant it was added 1 µl of a 100 mM solution of Bathocuproinedisulfonic (BCS) reagent and 1 µl of a 1 M ascorbate. Absorbance was measured at 483 nm. Panel A: Uninduced cells, Panel B: Induced cells. Absorbance at 483 nm is shown in blue, optical density is shown in red. Read more details about this test in our protocol page.
More metals to be precipitated: the TSI plates
We learnt that sulfide reacting with metal ions produces a change in color. In this test we grew cells in triple sugar iron medium and observed the formation of black spots due to the precipitation of iron sulfide. The process was a bit slow, but after a week we observed clearly the “H2S” formation, suggesting that when lacking oxygen our CysDes producing bacteria do not work as efficiently, as in aerobic conditions.
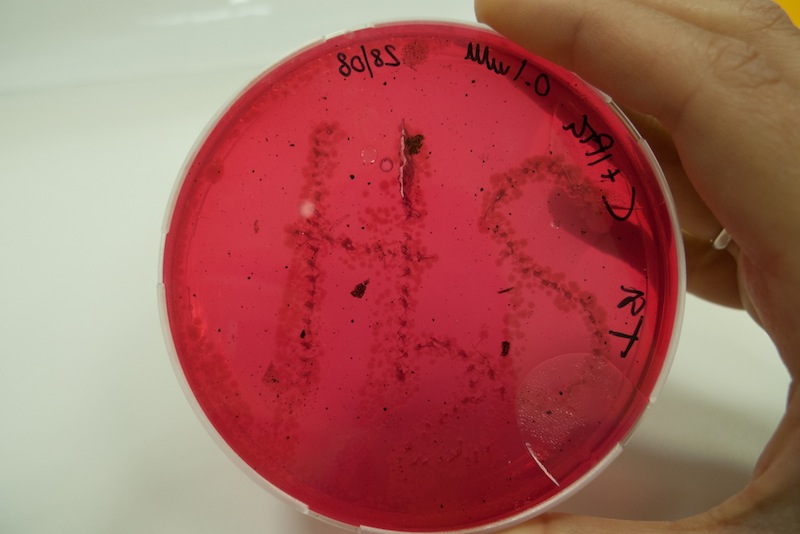
Figure 10: Cells transformed with BBa_K731480 were induced with 0.1 mM IPTG and a 5 µl aliquot was placed inside the iron containing medium with a tip. Cells were left at 37°C for 1 week. After 48 hours the first black spots started appearing. The maximum production of FeS was reached after 1 week.
CysDes expression was confirmed by fluorescence in two different MOPS media using Part BBa_K731480, which carries a sfGFP tag. Fluorescence intensity was measured to evaluate protein expression upon induction with IPTG. The expression levels observed were higher in MOPS when glycerol was used as the carbon source and improved when the cells were grown in the presence of cysteine.
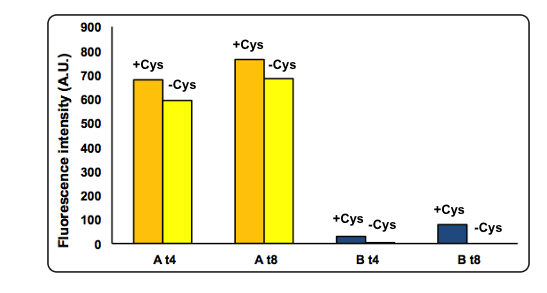
Figure 11: Cysteine effect on CysDes expression. NEB10β cells transformed with Part BBa_K731480 were grown and induced with 0.1 mM IPTG in two different MOPS medium: MOPS A, 60 mM glycerol; MOPS B, 30 mM glucose. To assay the effect of cysteine the experiment was also performed in the presence and in the absence of 1 mM L-cysteine (cys). Fluorescence was measured after 4 and 8 hours of induction.
To analyze the possible toxicity effect of CysDes we have calculated the number of cells survived after 4 and 8 hours of induction by serial dilution.
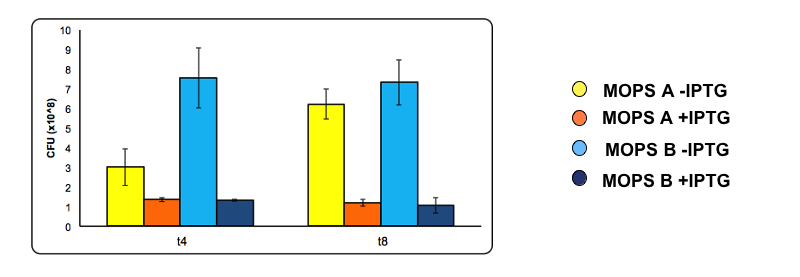
Figure 12: Toxicity of CysDes. At 4 and 8 hours of induction a 500 µl sample was taken from the uninduced and the induced culture and used to make serial dilution . A 200 µl aliquot of each serial dilution was plated on LB agar and placed overnight at 37°C. The following day the number of colonies from each plate was counted. Cell number was calculated with the following formula: Cells/mL = (# colonies counted)*(dilution factor)/(mL of culture plated). Conditions used are MOPS with 60 mM glycerol (A) and MOPS with 30 mM glucose (B), both in the presence of 0.1 mM cysteine. Experiments were done with Part BBa_K731400.
We concluded that MOPS supplemented with glucose produced enough CysDes, in concentration sufficient to reduce the amount of cysteine produced by our other Part BBa_K731030 (i.e. CysE).
At this point we are ready to work on our complete system.
CysE + CysDes
Putting together the pathway: no more pink!
CysE and CysDes sinergically worked to reduce sulfate aerobically in our engineered E. coli.
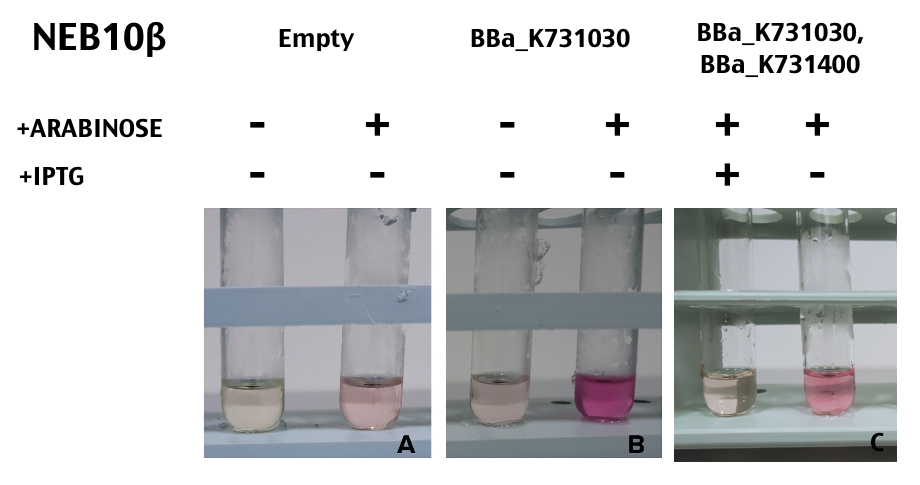
Figure 13: Our engineered E.coli aerobically reduces sulfate and transform the produced cysteine into hydrogen sulphide. Panel A, B, and C: NEB10b cells grown in MOPS supplemented with 30 mM glucose and 4 mM potassium sulfate were induced with 5 mM arabinose and/or 0.1 mM IPTG. The production of cysteine was measured with a colorimetric assay that uses ninhydrin, a small organic molecule that reacts with cysteine at low pH. Empty NEB10b cells do not produce cysteine (A), BBa_K731030 when induced produce cysteine (B), cells co-transformed with BBa_K731030 and BBa_K731400 when co-induced do not show residual cysteine in the media, indicating that cysteine is being transformed into hydrogen sulphide (C).
When NEB10β cells were cotransformed with Parts BBa_K731030 and BBa_K731400 and induced both with arabinose and IPTG no cysteine was left in the media, as an indication that CysDes (i.e. BBa_K731400) is able to transform the accumulated cysteine into hydrogen sulfide. As a control, we tested the production of cysteine when CysDes was not induced. The experiment was done in duplicates.
This observation confirmed that our combined system is able to assimilate sulfate, reduce it and form H2S.
Cotransformation
In order to be able to co-express CysE and CysDes we subcloned Parts BBa_K731030, BBa_K731400 and BBa_K731480 in the low copy vectors pSB3C5 and pSB4K5.
We tested protein expression levels of CysE upon induction of CysDes by measuring fluorescence intensity of CysE-sfGFP (i.e. BBa_K731040) produced when CysDes (BBa_K731400) was uninduced or induced with IPTG.
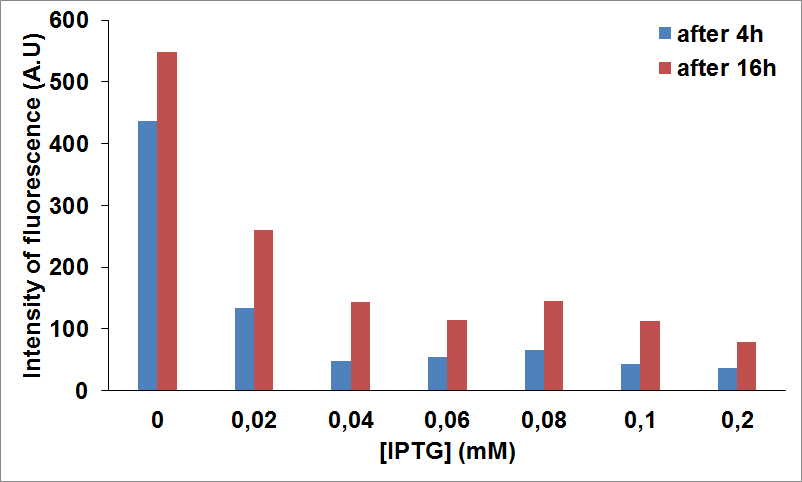
Figure 14: NEB10β cells cotransformed with Parts BBa_K731040 and BBa_K731400 were grown in LB and induced with 5 mM arabinose and different concentrations of IPTG. Time points were taken at 4 hours and 8 hours of expression to measure fluorescence intensity, as an indication of CysE expression levels.
The data show that CysE induction seems to be decreased significantly upon CysDes expression. For example, at 0.02 mM of IPTG the expression seems to be 3 fold less when compared with the levels of protein produced in the absence of IPTG.
To optimize CysE production we tried to induce the expression of the two proteins at different times. In the figure below it is shown the production of CysE, measured by fluorescence intensity, when CysDes was induced 4 hours later with 0.1 mM of IPTG.
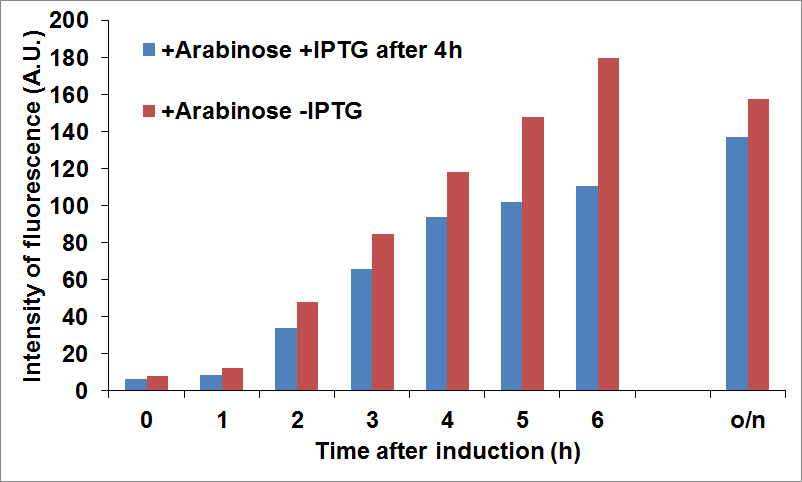
Figure 15: NEB10β cells co-transformed with Parts BBa_K731040 and BBa_K731400 were grown in LB and induced with 5 mM arabinose when it was reached an OD of 0.6 (time zero) and with 0.1 mM of IPTG 4 hours later. Time points were taken every hour to measure fluorescence intensity, as an indication of CysE expression levels.
The data showed that we reached a good compromise in CysE expression levels over time when delaying the induction of CysDes.
Based on our findings we decided that the conditions to be used on future applications on the statues would be:
- MOPS supplemented with 30 mM of glucose
- expression of CysE with 5 mM arabinose
- expression of CysDes with 0.1 mM of IPTG after 4 hours from the induction with arabinose.
Co-culture
Unfortunately we were not able to look in the co-transformed cells at the expression of both proteins because we lacked fluorescent tagged parts with antibiotic compatibility.
Therefore we monitored CysE and CysDes expression levels over time in co-cultured NEB10β.
We established the following co-culture tests:
A) CysE-sfGFP + CysDes using Parts BBa_K731040 and BBa_K731400.
B) CysE + CysDes-sfGFP using Parts BBa_K731030 and BBa_K731480.
For co-culture A we used the following growth conditions:
+5 mM arabinose, - 0.1 mM IPTG
+5 mM arabinose, + 0.1 mM IPTG
For co-culture B we used the following growth conditions:
–5 mM arabinose, + 0.1 mM IPTG
+5 mM arabinose, + 0.1 mM IPTG
and checked fluorescence intensity of the sfGFP tagged protein being used as reporter. For example, we were able to look at CysE expression levels when CysDes was uninduced or induced with IPTG (co-culture A) and viceversa (co-culture B).
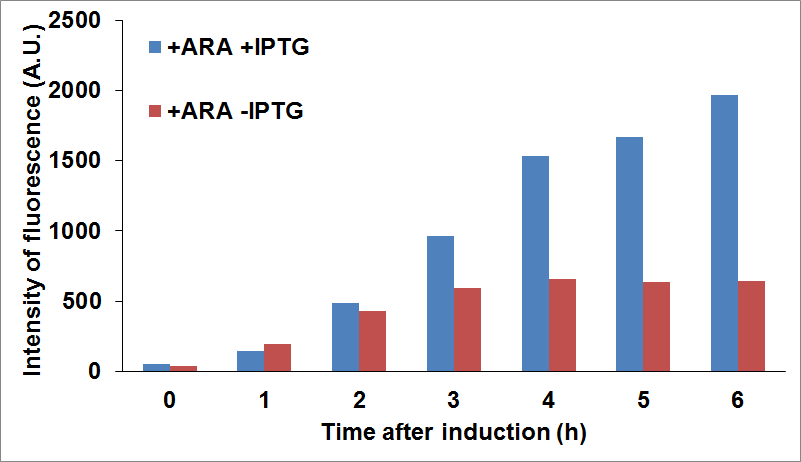
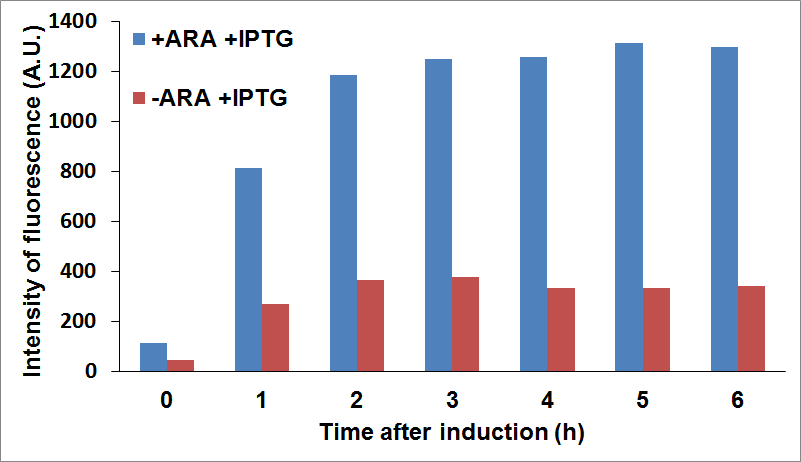
Figure 16: Top Panel CysE-sfGFP levels monitored by fluorescence intensity levels when CysDes is uninduced (+Arabinose -IPTG) and induced (+Arabinose +IPTG). Bottom Panel: CysDes-sfGFP monitored by fluorescence intensity levels when CysE was uninduced (-Arabinose +IPTG) and induced (+Arabinose +IPTG).
The data showed that induction of both CysE and CysDes had a synergistic effect on the expression levels of both enzymes. However, this is in contrast with what we saw with the co-transformed cells. This is possibly due to a much higher energetical request of the cell when the two enzymes are expressed simultaneously. This theory finds support on the fact the optical density levels recorded were significantly decreased when both genes were induced (about 30% less, data not shown).
APPLICATION
In this page you can find about our application results, application method and our DIY black crust!
Crust is definitely Away!
Preliminary evidence show that our engineered E. coli was capable of removing the black crust.
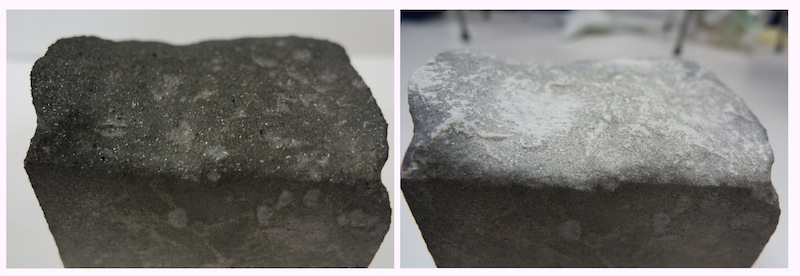
Figure 17: Black crust removal from Carrara marble. Panel A: before treatment. Panel B: after 3 cycles of treatment with NEB10β expressing Parts BBa_K731030 and BBa_K731400. The black crust was reproduced in the laboratory with our Crustonator using a Carrara marble samples of the dimensions of 10 cm x 10 cm. The bacteria were applied on the surface with our Jelly-MOPS for 3 cycles of 12 hours each. After the 3 cycles the gel was removed and the stone was gently tapped with blotting paper and then rinsed with hot water. If you want to know more about the Crustonator and Jelly-MOPS you can find them at the end of this section.
We first tried our bacteria to clean a variety of marble samples. Although the results were very promising it was unclear to us if what we thought was black crust was actually black crust. Therefore, we decided to reproduce the black crust in the laboratory with an acid rain simulator (read more in the Crustonator section).
We applied to a black crust sample reproduced in the laboratory bacteria transformed with CysE and CysDes (Parts BBa_K731030 and BBa_K731400), in addition to control cells that did not carry the enzymes.
The treatment lasted for 3 cycles of 12 hours each. Unfortunately it was difficult to apply the bacteria in one specific spot because the surface of the stone was not flat and the dimensions of the piece were too small to allow for a precise separate spotting. For this reason we currently do not have a good negative control.
Although the removal of the crust was not complete, it was possible to observe a significant change by eye both in the color and the appearance of the surface of the treated stone. It should be kept in mind that the marble pieces exposed in the Crustonator showed a significant thick layer of gypsum crystals, probably because of the aggressive exposure to the acidic atmosphere. With the black crust formed when marble is exposed to the environment, the situation could be completely different. For instance, the gypsum layer is usually less thick, making thus the removal quicker and more efficient.
At this point we had a much cleaner stone and a good feeling that our system was working. However, science is not based upon sensations. To have a less qualitatively analysis we asked the help of Flavio Deflorian, professor in material engineering, that visited our lab a few weeks earlier. Prof. Deflorian opened his lab to us and his staff supported us to collect Scanning Electron Microscopy (SEM) images, to analyze the absence of calcium sulfate crystals, as a confirmation that gypsum was removed by our bacteria.
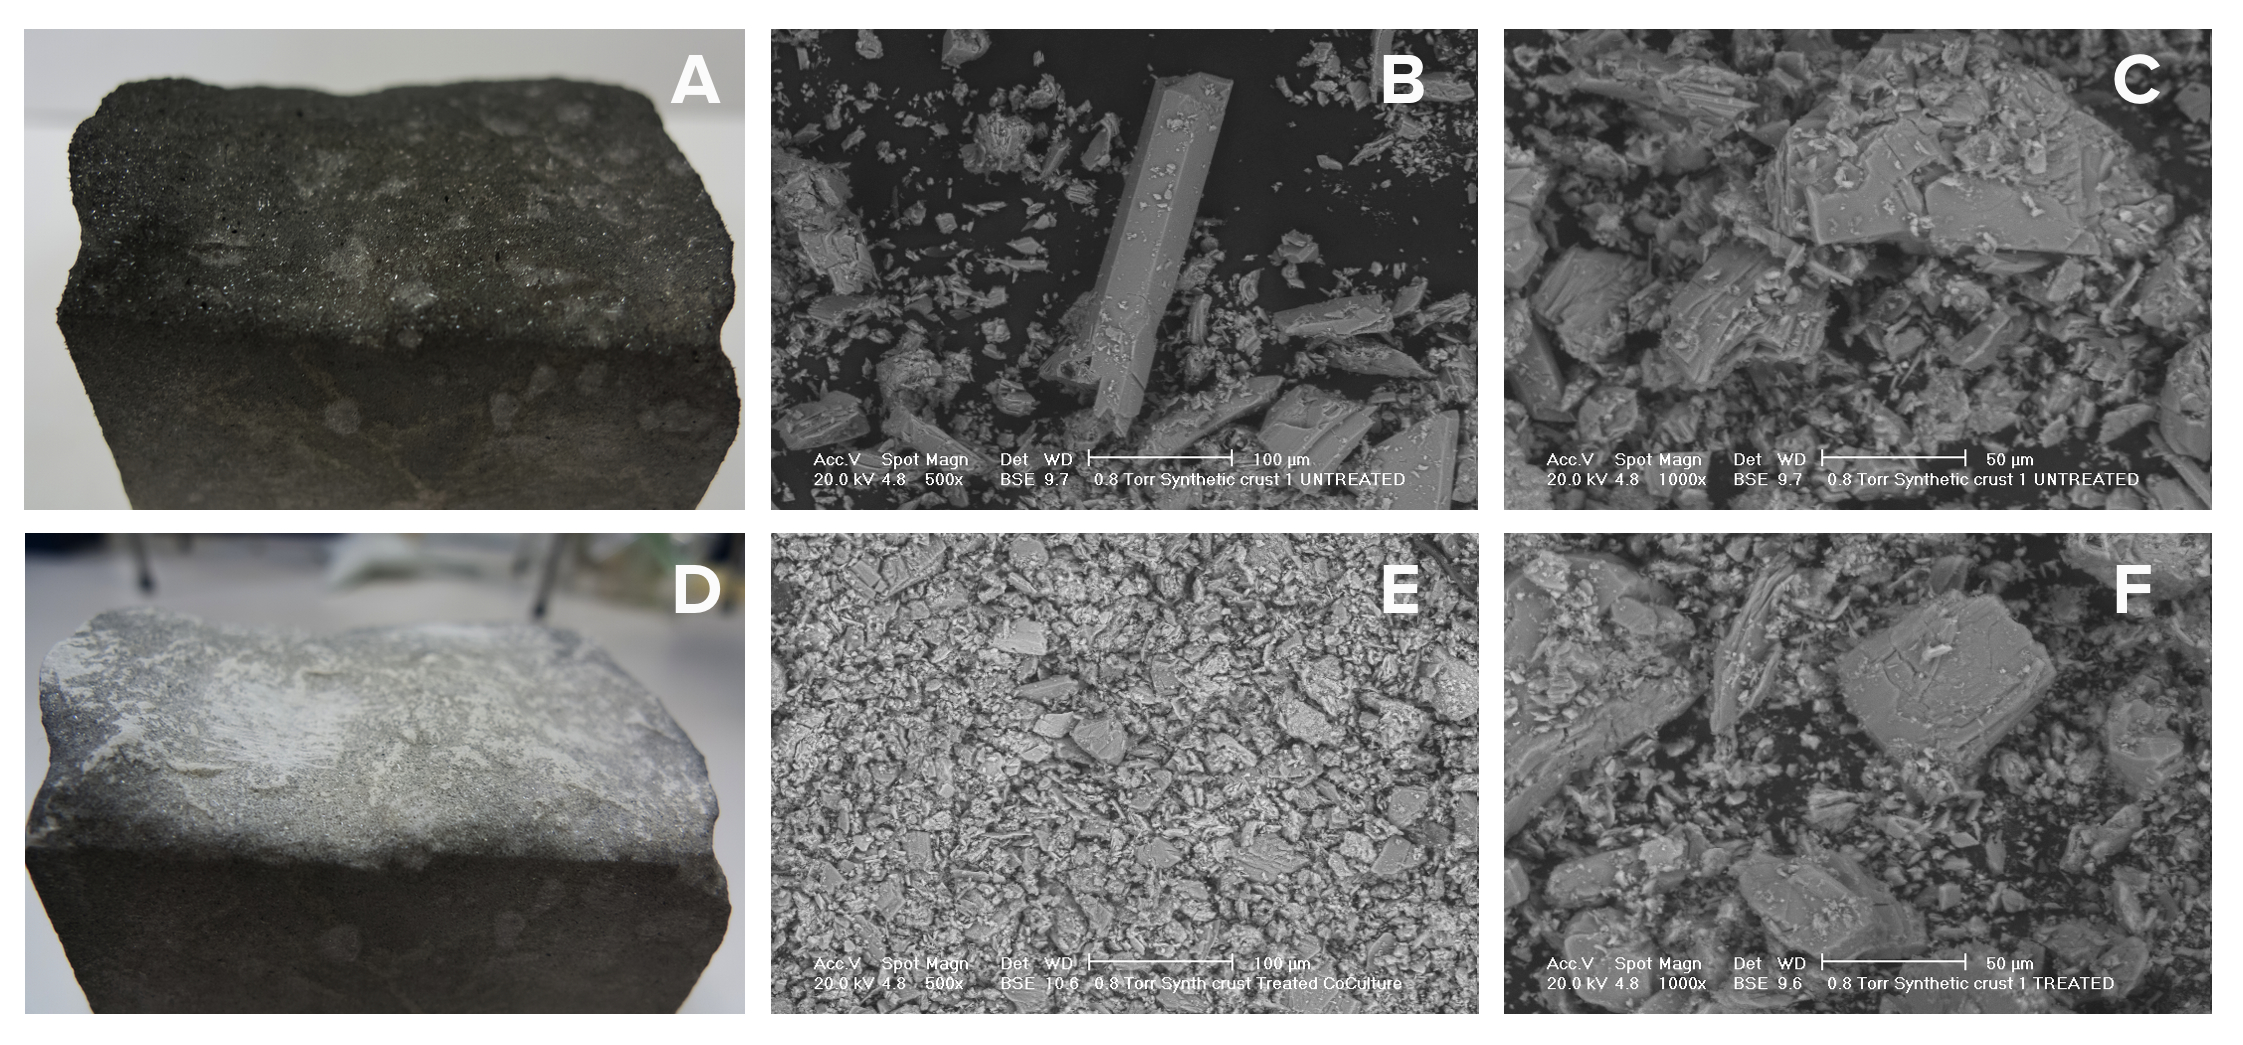
Figure 18: Removal of the black crust from a synthetically generated gypsum layer: Scanning Electron Microscopy analysis of the black crust before and after bacterial treatment. Untreated synthetic crust (A), SEM analysis of material scraped from untreated synthetic crust at 500x (B) and 1000x magnification (C). Synthetic crust treated with NEB10β cells expressing CysE and CysDes (Parts BBa_K731030 and BBa_K731400) (D); SEM analysis of material scraped from treated synthetic crust at 500x (E) and 1000x magnification (F).
The SEM analysis showed changes in the crystal morphology of the stone surface. Before the treatment, calcium sulphate crystals were large (200-300 μm) and well structured, while after the application of our bacteria CaSO4 was still present on the surface but crystals were smaller (20-30 μm) and showed a loss in crystalline organization. We did not find any big and well structured crystal in the sample took after the treatment. Changes in light reflection were even noticeable by eye.
Our preliminary data demonstrate the feasibility of our method and the possibility of using engineered bacteria to clean the black crust from calcareous stones. However, more tests and controls should be performed to address the following points:
in vitro- Optimize the combined expression of CysE and CysDes.
- Place CysDes behind a different promoter to avoid basal expression.
- Optimize method of application
- Have clear negative controls
- Use different kinds of black crust and marble
We hope that another iGEM team will consider this as good starting point for a possible future project!
Our application method.
After characterizing our system in vitro we were ready to apply the bacteria on our collection of stone samples.
The first thing we needed to address is how to apply the bacteria on the stones. We needed a support that would allow for both bacterial survival and adhesion on the surface of the statue.
We developed a soft gel with a modified MOPS recipe and agar (jelly-MOPS), and set up a protocol that allowed the gel to stay in place, to remain wet and to keep bacteria alive through the night. This is all we needed, all the rest was left to the bacteria!
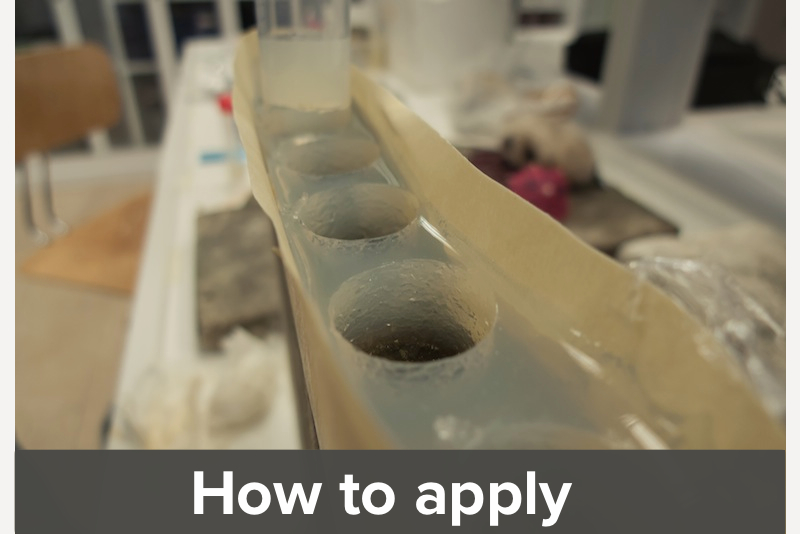
We created an agar matrix with separate wells on the stone surface to allow an easy application of the bacteria. This method simplified the procedure for multiple sequential applications in the same spot.
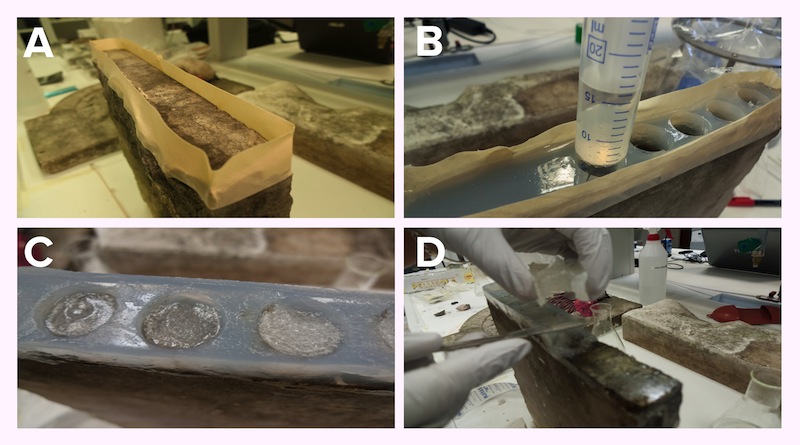
Figure 19: Application steps on a stone sample. Preparation of a scaffold on the surface of the stone (Panel A). Then the matrix gel is poured and left to solidify directly on the surface. When solid, wells are cut out from the matrix (Panel B). Bacteria resuspended in Jelly-MOPS are placed in the wells (Panel C), covered with rice paper wetted in PBS. After three cycles of 12 hours, the gel and the matrix are removed (Panel D).
The bacteria were grown in MOPS with glucose and induced with arabinose +/- IPTG, depending on the parts being expressed. After 4 hours of induction the bacteria were pelleted and resuspended in jelly-MOPS and a 1-2 cm layer of bacterial gel was added inside each well. The matrix was then covered with rice paper wet in PBS to protect and keep hydrated the bacterial gel.
The stone was subjected to 3 application cycles of 12 hours with freshly induced bacteria. At the end of the three applications both the gel and the matrix were removed, and the stone surface was gently tamped with blotting paper. Then hot water was poured gently on the stone to easily remove the remaining part of the gel.
An home made acid rain simulator.
As we started collecting samples of dirty marble we realized that it was important to test our bacteria on an homogenous surface of black crust that was surely composed of a gyspsum layer.
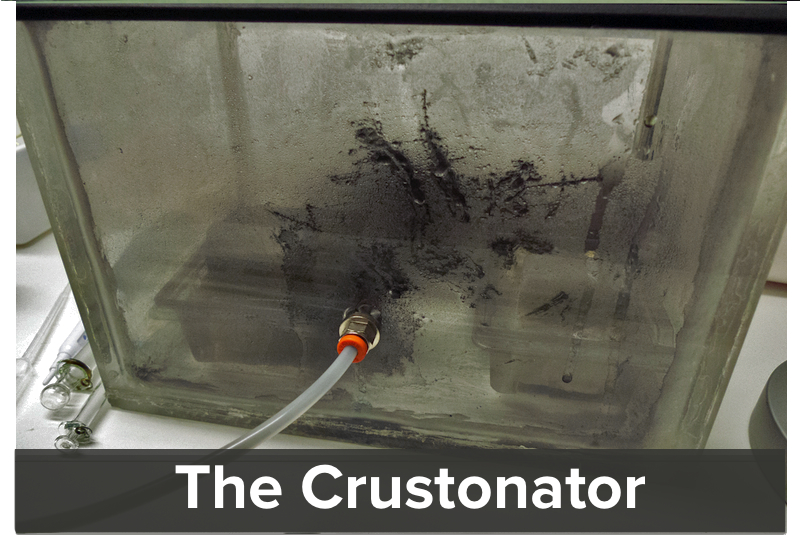
Inspired by the work of a group of researchers at the University of Belfast an at the University of Oxford (M. Gomez-Heras, B.J. Smith and H.A. Viles ) we decided to build our own acid rain simulation chamber. For a detailed protocol on how to build your own Crustonator you can check our protocol section.
By using our labmade acid rain simulator we were able to successfully recreate the black crust on:
- 2 small white marble pieces from Carrara (10x10 cm)
- 2 small yellow marble pieces from Vicenza (10x10 cm)
The pieces were immersed partially in distilled water and subjected to three 72 hours cycles of exposure to a saturated atmosphere of sulfourus acid. At the beginning of each cycle a fine powder of charcoal was injected into the chamber with compressed air.
After the treatment the box was opened and we happily observed the formation of a gypsum layer in top of the stones and on the surface of the water. A small amount of the crust was scratched and looked under the microscope to confirm the presence of gypsum crystals.
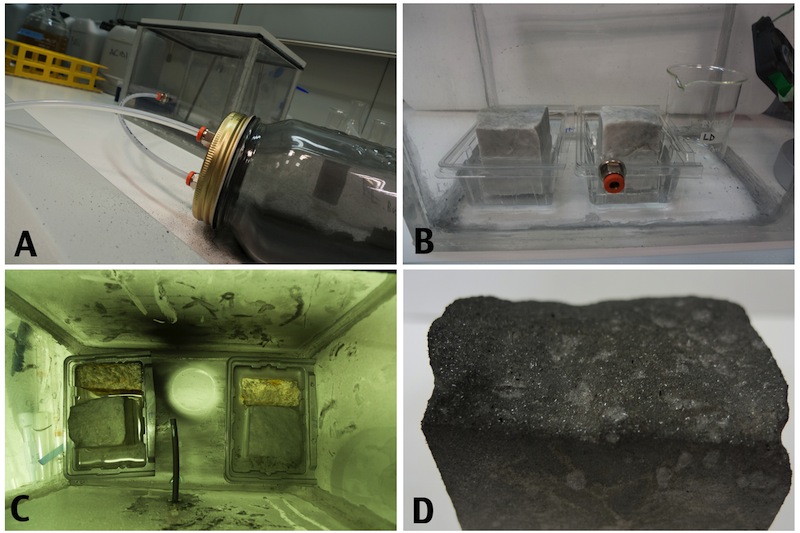
Figure 20: The Crustonator: A small laboratory device was built to simulate the acid rain and pollutants on the stones. In a tightly sealed plexiglass box, connected to a separate chamber containg charcoal, were placed two marble pieces from Carrara and two yellow marble pieces from Vicenza (A). The calcareous stones were partially immersed in water (B) and subjected to a saturated atmosphere of SO3 mixed with small particles of charcoal that were sprayed every 72 hours in the chamber (C). After 216 hours the box was opened and a black crust was observed on the top layer of the marble (D).
The blackened stones are ready to be cleaned by our bacteria!
Project References
- F.Cappitelli, L.Toniolo, A.Sansonetti, D.Gulotta, G.Ranalli, E.Zanardini, C.Sorlini (2007) Appl. Environ. Microbiol., 7317, 5671-5675.
- F.Cappitelli, E.Zanardini, G.Ranalli, E.Mello, D.Daffonchio, C.Sorlini (2006) Improved Methodology for Bioremoval of Black Crusts on Historical Stone Artworks by Use of Sulfate-Reducing Bacteria, ) Appl. Environ. Microbiol., May, Vol.72, No.5, pp.3733–3737
- C. L. Wang, P. D. Maratukulam, A. M. Lum, D. S. Clark, and J. D. Keasling. (2000) Metabolic engineering of an aerobic sulfate reduction pathway and its application to precipitation of cadmium on the cell surface. Appl. Environ. Microbiol. 66:4497-4502.
- D.Denk, A.Böck (1987) L-cysteine biosynthesis in Escherichia coli: nucleotide sequence and expression of the serine acetyltransferase (cysE) gene from the wild-type and cysteine-excreting mutant, J of Gen. Microbiol., 133, pp.515–525
- L.Chu, A.Burgum, D.Kolodrubetz, S.C.Holt (1995) The 46-kilodalton-hemolysin gene from Treponema denticola encodes a novel hemolysin homologous to aminotransferases, Infection and Immunity, November 1995, Vol.63, No.11, pp.44–48
- M.K.Gaitonde (1967) A spectrophotometric method for the direct determination of cysteine in the presence of other naturally occurring amino acids, Biochem. J., Vol.104, pp.627–633
- Chu, L., J. L. Ebersole, G. P. Kurzban, and S. C. Holt. 1997. Infect. Immun. 65:3231–3238.
- M.Gomez-Heras, B.J.Smith, H.A.Viles, Proceedings, 11th International Congress on Deterioration and Conservation of Stone, Torun., Nicolaus Copernicus University Press, pp.105-112