 "
"
Team:TU Darmstadt/Labjournal/Transport
From 2012.igem.org
Transport
Overview
This lab journal describes an isolation and characterisation of the putative terephtalate (TPA) uptake system from Comamonas testosteroni KF-1 (C. testosteroni) in Escherichia Coli (E.Coli). The putative terephtalate system consist of three different domain, two alpha-helical transmembrane protein (11-12 and 4-5 alpha-helical transmembrane protein) and one periplasmic terephtalate binding protein. The strain was purchased from DMSZ-German Collection of Microorganism and Cell Cultures (DSMZ no.14576). We designed two putative TPA uptake operons and the intake of TPA was checked by photometry, gas chromatography-mass spectrometry (GC-MS) and energy dispersive X-ray spectroscopy (EDX).
How we constructed our Biobricks

Week 1 (21.-25.05.12)
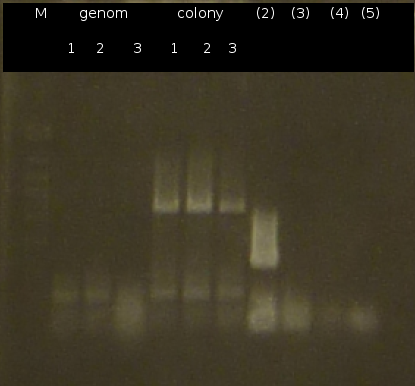
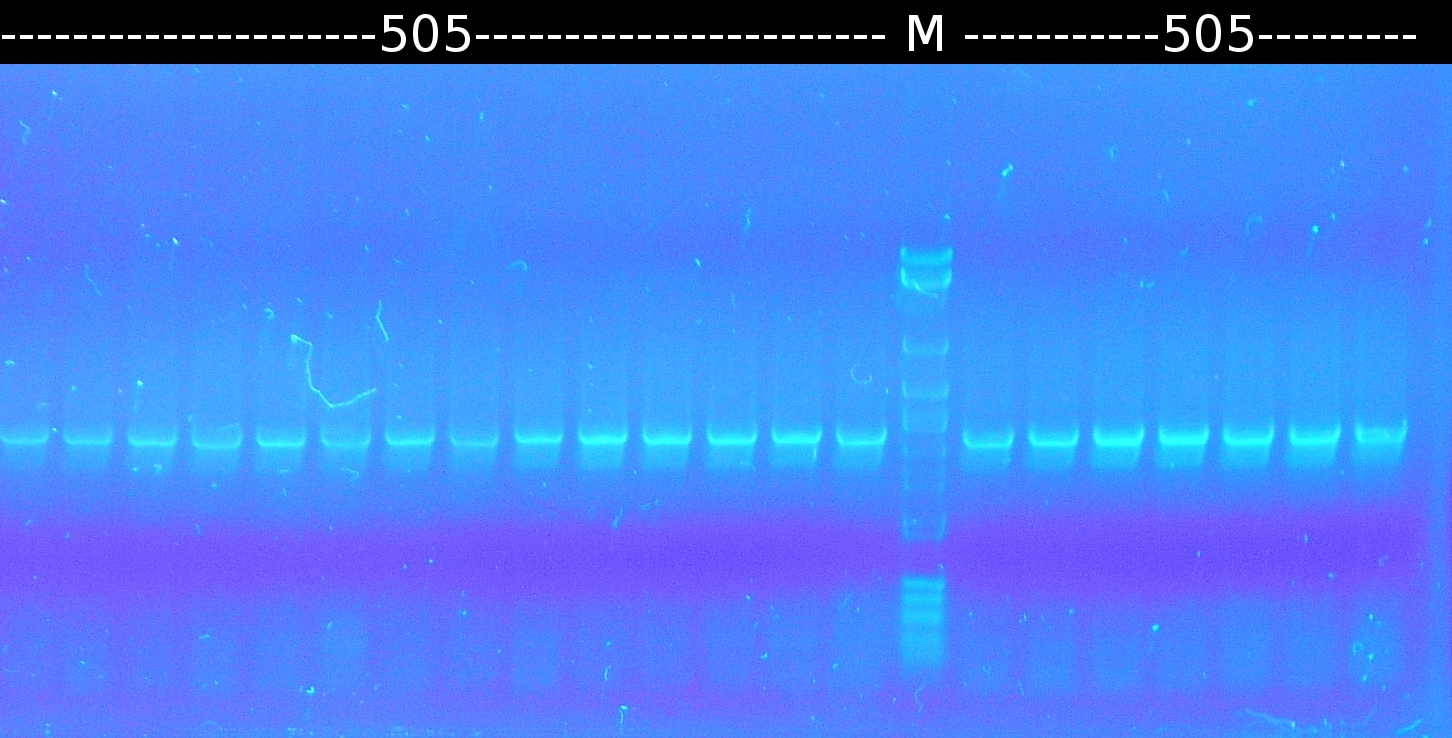
- First colony PCR of Comamonas testosteroni for isolation of the following genes: tctA 505aa (1), tctB 197aa (2), tctA_503aa (3), tctB 162aa (4), tphC 322aa (5). (Primers: tctA_503 Biobrick, tctA_505 Biobrick, tctB_162 Biobrick, tctB_197 Biobrick, tphC Biobrick). Analysis of PCR products by Agarose gel electrophoresis

- PCR product purification using the Promega-Kit
- Nanodrop measurements of the purified PCR products:
- (1) : 19.5 ng/µl 260/280=1.58
- (2) : 61.9 ng/µl 260/280=1.75
- (3) : 75.1 ng/µl 260/280=1.75
- (4) : 93.3 ng/µl 260/280=1.85
- (5) : 91.3 ng/µl 260/280=1.58
- Restriction digest of PCR products by SpeI and EcoRI, heat inactivation after digestion
- Analysis of restriction digest by Agarose gel electrophoresis

- Purification of the bands gained form gel electrophoresis (Promega-Kit)
- Nanodrop measurements of the purified products:
- (1) : 8.3 ng/µl 260/280=1.94
- (2) : 8.9 ng/µl 260/280=1.80
- (3) : 13.0 ng/µl 260/280=1.57
- (4) : 1.5 ng/µl 260/280=3.08
- (5) : 3.7 ng/µl 260/280=2.26
Results
- We got the purified Genes from C. testosteroni but the yield after purification is to low for futher use
week 2 (28.05.-01.06.12)
- Purified products from 1. week were ligated into pSB1A2 and subsequently transformed into DH5a (in spite of low concentration)
- Overnight incubation on LB agar plates; no growth detectable
- Second approach to isolate the five genes from Comamonas t. using colony-PCR (Primers: tctA_503 Biobrick, tctA_505 Biobrick, tctB_162 Biobrick, tctB_197 Biobrick, tphC Biobrick)
- Analysis of PCR products by Agarose gel electrophoresis; without results; modification of the PCR protocols: adding DMSO
- Third approach to isolate the five genes from Comamonas t. by colony-PCR (Primers: tctA_503 Biobrick, tctA_505 Biobrick, tctB_162 Biobrick, tctB_197 Biobrick, tphC Biobrick)
- PCR product purification using the Promega-Kit: (tctB 197aa (2), tctA_503aa (3), tctB 162aa (4), tphC 322aa (5))

- Nanodrop measurements of the purified PCR products:
- (2) : 56.1 ng/µl 260/280=1.87
- (3) : 66.8 ng/µl 260/280=1.92
- (4) : 72.8 ng/µl 260/280=1.87
- (5) : 68.8 ng/µl 260/280=1.82
Results
- Finally we got the genes 2, 3, 4 and 5 in acceptable concentrations
week 3 (04.-08.06.12)
- Restriction digest of the purified PCR products and of tctA 505aa (leftover of the 1. week) by SpeI and EcoRI
- Restriction digest of pSB1A2 using SpeI and EcoRI
- Dephosphorylation of the restriction reactions by using antarctic Phosphatase
- Ligation of the five genes into pSB1A2 and subsequently transformation into DH5a (incubation at 37°C)
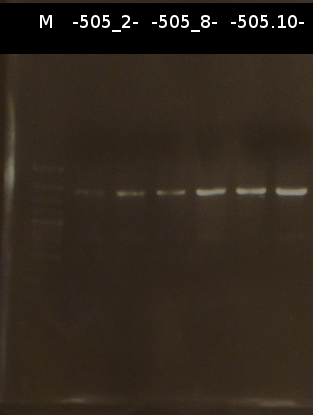
- colony-PCR of tctA 505aa (1), 2 approaches (Primers:tctA_505 Biobrick)
- Analysis of PCR products by Agarose gel electrophoresis. Only one of them showed the expected band. The band was excluded and purified via the Promega-Kit.
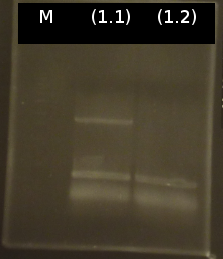 only (1.1) showed the expected band. Marker: 1kb DNA ladder, NEB

- Nanodrop measurement of the purified product:
- (1.1) : 8.9 ng/µl 260/280= 2,22
- Because of low concentration and contamination the PCR was repeated and the product was purified again by the Promega-Kit.
- Performing a colony-PCR-screen of the transformed cells using a homemade Taq-Polymerase. Verification of 4 colonies per plate. (Primers: tctA_503 Biobrick, tctA_505 Biobrick, tctB_162 Biobrick, tctB_197 Biobrick, tphC Biobrick)
- PCR did not work
- Testing the homemade Taq-Polymerase for function. The Phu-Polymerase was used for comparison. Only the approach using the Phu-Polymerase showed the expected bands in Agarose gel electrophoresis.
 only the Phu-approach showed the expected bands. Marker: 1kb DNA ladder, NEB

- Screening was repeated with Phu-Polymerase; no bands visible
Results
- We ligated the purified and restricted genes into pSB1A2 and transformed it into DH5a but the colony-PCR didn't work.
- We tried to isolate gene 1 again but after purification the concentration was too low
week 4 (11.-15-06.12)
- Inoculation of LB-media with DH5a_pSB1A2 and DH5a_pSB1C3; overnight incubation at 37°C
- Miniprep of DH5a_pSB1A2 and DH5a_pSB1C3 using the Promega-Kit
- Nanodrop measurements of the preparation:
- pSB1A2 : 136.1 ng/µl 260/280= 1.93
- pSB1C3 : 265.1 ng/µl 260/280= 1.89
- Restriction digest of pSB1A2 and pSB1C3 with EcoRI and SpeI. Afterwards dephosphorylation by using Antarctic phosphatase.
- Analysis of the restriction products through Agarose gel electrophoresis; for comparison the uncropped vectors were also analyzed.
 Analysis of the restricted an unrestricted plasmids pSB1A2 and pSB1C3. Marker: 1kb DNA ladder, NEB

- pSB1C3 shows several bands (Insert, vector without insert, linearized vector with insert); concentration of pSB1A2 is very low, only one band visible
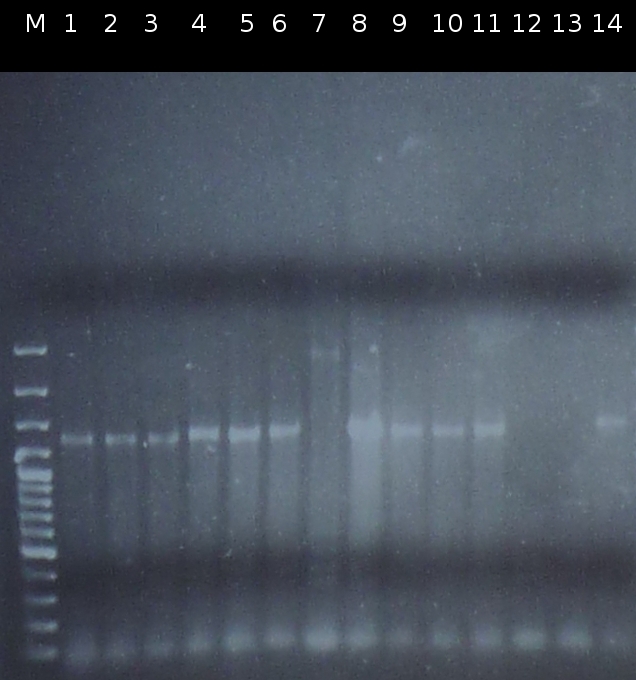
- Approach to isolate the following genes from Comamonas t. by colony-PCR: tctA 505aa (1), tctB 197aa (2), tctA_503aa (3), tctB 162aa (4) and tphC 322aa (5) by PCR (Primers: tctA_503 Biobrick, tctA_505 Biobrick, tctB_162 Biobrick, tctB_197 Biobrick, tphC Biobrick)
- Analysis of PCR products by Agarose gel electrophoresis
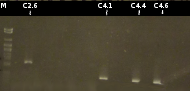
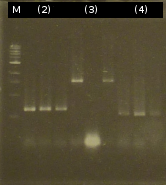 Isolation form the Genes 2, 3 and 4. The Isolation of 1 and 5 didn't work (not shown). Marker: 1kb DNA ladder, NEB

- PCR product purification by using the Promega-Kit
- Nanodrop measurements of the purified PCR products:
- (2) : 18.3 ng/µl 260/280=2.03
- (3) : 21.2 ng/µl 260/280=1.95
- (4) : 23.9 ng/µl 260/280=2.05
- Restriction digest of purified PCR products (2), (3) and (4) using SpeI and EcoRI
- Ligation of the digested genes ((2), (3), (4)) into pSB1A2 and pSB1C3
- Transformation of DH5a with pSB1A2_197, pSB1A2_503, pSB1A2_162, pSB1C3_197, pSB1C3_503, pSB1C3_162 (6 different transformation approaches). Overnight incubation at 37°C
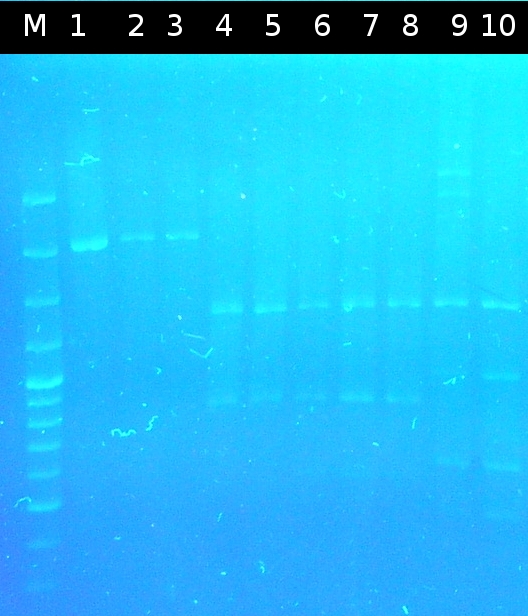
- Screening of the transformants by colony-PCR (Primers: tctA_503 Biobrick, tctA_505 Biobrick, tctB_162 Biobrick, tctB_197 Biobrick, tphC Biobrick). Verification of 6 colonies for every transformation. Afterwards the PCR products were analyzed by Agarose gel electrophoresis
 colony-PCR-screen part I. Only the positive colonies are marked. Marker: Lambda DNA/Eco471 Maker

 colony-PCR-screen part II. Only the positive colonies are marked. Marker: Lambda DNA/Eco471 Maker

- Colony-PCR of Comamonas t. to isolate tctA 505aa (1) und tphC 322aa (5) (Primers: tctA_505 Biobrick, tphC Biobrick)
- Analysis of PCR products (Colony-PCR) and the ligation approach by Agarose gel electrophoresis

- Restriction digest of tphC 322aa (5) and subsequent Ligation into pSB1A2 and pSB1C3
- Transformation of DH5a with pSB1A2_322 und pSB1C3_322. PCR (Primers: tphC Biobrick) used to check for successful transformation
- Isolation of C. testosteroni genome, because it seems impossible to amplificate tctA 505aa (1) from a fluid Comamonas t. culture.
Results
- We started an other approach to isolate the five genes. All but gene 1 worked, so we isolated the C. testosteroni genome
- We purified, restricted and ligated the genes 2-5 into pSB1A2 and pSB1C3 and transformed them into DH5a
- We checked the genes 2, 3 and 4 by colony-PCR. All genes had positive transformants.
week 5 (18.-22.06.12)
- Introduction of a nomenclature: A/C gene/colony: pSB1A2 = A; pSB1C3 = C; gene: tctA 505aa = 1, tctB 197aa = 2, tctA 503aa = 3, tctB 162aa = 4, tphC 322aa = 5; colony = 1...X
- Producing fluid cultures of the positive transformants
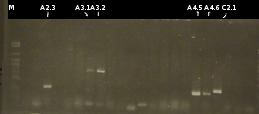
- Miniprep of the fluid culures by using the Frementas-Kit. Afterwards Nanodrop measurements of the preparations
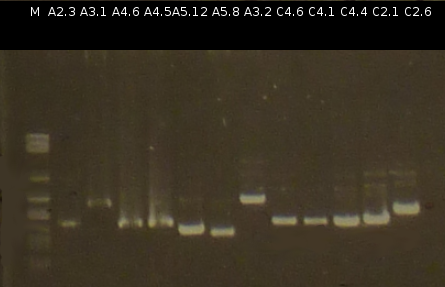 Miniprep of the fluid cultures. Marker: Lambda DNA/Eco471 Maker
- A2.3 : 125.9 ng/µl 260/280= 1.62
- A3.1 : 103.3 ng/µl 260/280= 1.72
- A4.6 : 147.2 ng/µl 260/280= 1.70
- A4.5 : 108.7 ng/µl 260/280= 1.86
- A5.12 : 88.0 ng/µl 260/280= 1.87
- A5.8 : 85.01 ng/µl 260/280= 1.78
- A3.2 : 87.3 ng/µl 260/280= 1.81
- C4.6 : 70.5 ng/µl 260/280= 1.81
- C4.1 : 41.2 ng/µl 260/280= 1.85
- C4.4 : 104.2 ng/µl 260/280= 1.85
- C2.1 : 132.2 ng/µl 260/280= 1.85
- C2.6 : 188.1 ng/µl 260/280= 1.75
- PCR using a rest of purified tctA 505aa (1) (Primers: tctA_505 Biobrick), subsequent Agarose gel electrophoresis
- Another colony-PCR using the transformants (2)-(5) as template (Primers: tctA_503 Biobrick, tctB_162 Biobrick, tctB_197 Biobrick, tphC Biobrick); analyzing the PCR product by Agarose gel electrophoresis
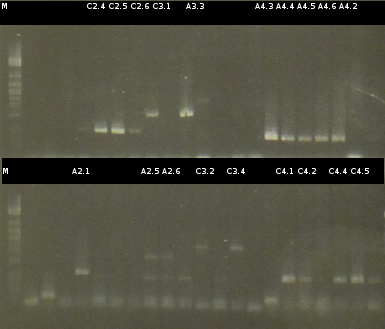 Colony-PCR screen. Only the positive colonies are marked. 3 positive transformants were picked for inoculation of fluid media (A34, A43; C513). Marker: Lambda DNA/Eco471 Maker

- Miniprep (Fermentas Kit) of the fluid culures and Nanodrop measurements:
- A2.4 : 202,1 ng/µl 260/280= 1,63
- A2.5 : 126,5 ng/µl 260/280= 1,90
- A2.6 : 107,5 ng/µl 260/280= 1,81
- A4.2 : 133,8 ng/µl 260/280= 1,59
- C2.3 : 187,8 ng/µl 260/280= 1,87
- C2.4 : 270,7 ng/µl 260/280= 1,80
- C4.1 : 103,8 ng/µl 260/280= 1,80
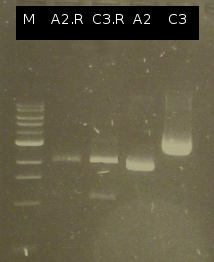
- The Miniprep products were digested by restriction enzymes, each was cut once with EcoRI and twice with EcoRI/SpeI. Analisys of the digested products by Agarose gel electrophoresis
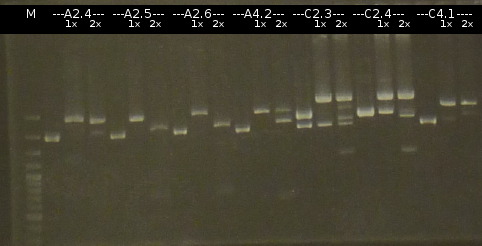 Restriction digest of miniprep. Marker: Lambda DNA/Eco471 Maker

Results
- We ligated our genes 2, 3 and 4 successfully either in pSB1A2 or pSB1C3
- We couldn't get a positive colony-PCR of a transformant containing gene 5
- Isolation of gene 1 still didn't work
week 6 (25.-29.06.12)
- Further colony-PCR of C.testosteroni. (3 approaches) and PCR with genomic C. testosteroni. DNA as template to obtain tctA 505aa (1), 2 approaches each (Primers: tctA_505 Biobrick). Subsequent analisys of the PCR products by Agarose gel electrophoresis. All PCRs of tctA 505aa show only the band of the undesired smaller product.
- Ligation off the digested genes into pSB1A2 and transformation into DH5a. Overnight incubation at 37°C
- Colony-PCR of C. testosteroni. and PCR with genomic DNA of C. testosteroni. as template to obtain tctA 505aa (1). tctB 197aa (2), tctA_503aa (3), tctB 162aa (4), tphC 322aa (5) used as control (Primers: tctA_503 Biobrick, tctA_505 Biobrick, tctB_162 Biobrick, tctB_197 Biobrick, tphC Biobrick)
 Finally a colony-PCR of C. testosteroni showed a second band on agarose gel electrophoresis. Marker: Lambda DNA/Eco471 Maker

- The upper bands were cut and purified by Promega kit. Restriction digest using SpeI and EcoRI.
- Miniprep and Nanodrop measurement of:
- A3.1 : 111.6 ng/µl 260/280= 1.72
- A3.4 : 79.5 ng/µl 260/280= 1.66
- C4.6 : 69.6 ng/µl 260/280= 1.76
- A4.2 : 96.9 ng/µl 260/280= 1.62
- A2.4 : 109.7 ng/µl 260/280= 1.72
- A2.5 : 160.8 ng/µl 260/280= 1.79
- A5.13 : 188.7 ng/µl 260/280= 1.85
- A5.12 : 114.5 ng/µl 260/280= 1.81
- Checking the Miniprep with PCR (Primers: tctA_503 Biobrick, tctB_162 Biobrick, tctB_197 Biobrick, tphC Biobrick) and Agarose gel electrophoresis
 All PCRs of miniprep showed a product. Marker: 1kb DNA ladder, NEB

- Colony-PCR-Screen of the transformants (Primers: tctA_505 Biobrick) and analisys of the PCR products by Agarose gel electrophoresis
- No bands visible
- Ligation of tctA 505aa into pSB1C3 and subsequently transformation into DH5a. No colonies
- The following vectors were sequenced: pSB1A2_197.4, pSB1A2_197.5, psSB1A2_503.1, pSB1A2_503.4, pSB1A2_162.2, pSB1C3_162.6, pSB1A2_322.12, pSB1A2_322.13
- Restriction digest of tctA 505aa using EcoRI/SpeI. Ligation into pSB1C3 and subsequently transformation into DH5a.
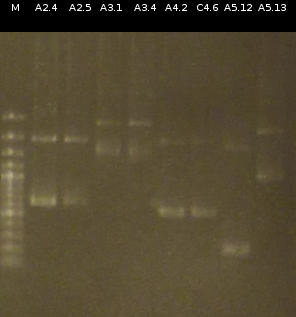
- Preperations for pure culture: colony-PCR of A2.4, A2.5, A3.1, A3.4, A4.2, C4.6, A5.12, A5.13 (2 colonies each, Primers: tctA_503 Biobrick, tctB_162 Biobrick, tctB_197 Biobrick, tphC Biobrick) and afterwards checking the PCR products by Agarose gel electrophoresis. Positive colonies were picked, streaked onto fresh media and incubated again.
- As A5.12 and A5.13 are missing the right insert the colony-PCR was repeated (5 and 6 colonies were used, Primers: tphC Biobrick). To provide additional monitoring the colony-PCR was repeated for A2.5_2, A3.1_2 und A4.2_2. 2 positive colonies were again streaked onto fresh media.
- The Arabinose-Promotor (Ara) was isolated from pbad_turbo_gfp and colonies containing this plasmid (3 approaches each).
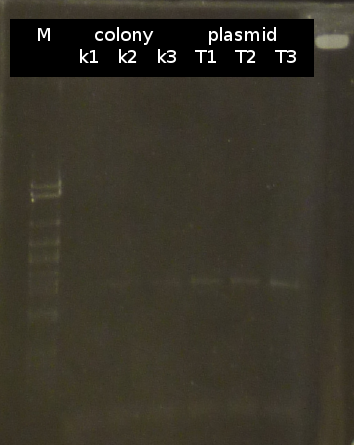 Isolation of Ara. Approach T2 is further in use. Marker: 1kb DNA ladder, NEB

Results
- Finally we made it to isolate gene 1 form a colony of C. testosteroni, but transformation didn't work
- Miniprep of the other genes, and sequencing
- Isolation of Ara
week 7 (02.-06.07.12)
- Restriction digest of Ara and pXylE using EcoRI and SpeI. Ligation of the restricted products and transformation into DH5a. No colonies
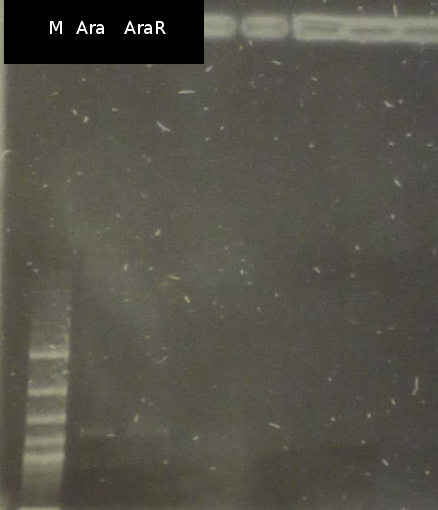 Restriction digest of Ara. Marker: 1kb DNA ladder, NEB

- Restriction digest of pSB1A2 using EcoRI and SpeI
- DH5a-cells containing the vectors A4.2_2, A3.1_2, A2.5_2, A5.13_5 were diluted in glycerol (20%) and freezed (-80°C).
- Mutagenic PCR of A4.2, A5.13, A3.1 to eliminate the PstI restriction site (Primers: tctA_503_PstI, tctB_162_PstI, tphC_PstI). Transformation into DH5a
- Checking the DH5a-cells for correct transformation with the vectors after the mutagenic PCR by colony-PCR (checking 7 colonies each, Primers: tctA_503 Biobrick, tctB_162 Biobrick, tphC Biobrick). The PCR products were digested with PstI.
 Restriction digest of the genes after mutagenic PCR. The gel was alternately loaded with digested unmutated and digested mutated PCR products. Marker: 1kb DNA ladder, NEB

- The transformation of DH5a with pSB1C3_tctA_505aa was verified by colony-PCR (Primers: tctA_505 Biobrick). The positive colonies were used for Miniprep
- Miniprep (Fermentas Kit) and Nanodrop measurement:
- A5.13m_1 : 105.2 ng/µl 260/280= 1.84
- A5.13m_2 : 223.0 ng/µl 260/280= 1.87
- A5.13m_3 : 110.6 ng/µl 260/280= 1.87
- A5.13m_4 : 99.6 ng/µl 260/280= 1.90
- A5.13m_6 : 326.6 ng/µl 260/280= 1.88
- A5.13m_7 : 145.0 ng/µl 260/280= 1.84
- A3.1m_1 : 241.7 ng/µl 260/280= 1.87
- A3.1m_2 : 188.4 ng/µl 260/280= 1.89
- A3.1m_3 : 112.4 ng/µl 260/280= 1.89
- A3.1m_4 : 173.1 ng/µl 260/280= 1.85
- A3.1m_5 : 111.6 ng/µl 260/280= 1.85
- A3.1m_6 : 138.1 ng/µl 260/280= 1.87
- A3.1m_7 : 178.9 ng/µl 260/280= 1.86
- A4.2m_1 : 57.0 ng/µl 260/280= 1.84
- A4.2m_2 : 46.5 ng/µl 260/280= 1.77
- A4.2m_3 : 55.7 ng/µl 260/280= 1.88
- A4.2m_4 : 111.3 ng/µl 260/280= 1.82
- A4.2m_5 : 236.9 ng/µl 260/280= 1.89
- A4.2m_6 : 69.3 ng/µl 260/280= 1.89
- A4.2m_7 : 72.3 ng/µl 260/280= 1.85
- C1.2 : 132.9 ng/µl 260/280= 1.72
- new transformation of DH5a with pXylE_Ara
Results
- First transformation of Ara into DH5a didn't work
- Successfull mutagenic PCR of genes 3, 4 and 5 (gene 2 didn't has a PstI Restriction site)
- Successfull transformation of DH5a with tctA 505aa
- Second transformation of DH5a with pXylE_Ara
week 8 (09.-13.07.12)
- Checking the transformation of DH5a with pSB1C3_tctA_505aa again using colony-PCR (Primers: tctA_505 Biobrick) (data not shown). The colonies Nr. 2, 8 and 10 were picked and streaked onto fresh media.
- colony-PCR of DH5a_pXylE_Ara (Primers: Ara_RBS, no positve colonies, data not shown)
- Sequencing the following vectors: pSB1A2_4.2m_5, pSB1A2_4.2m_4, pSB1A2_5.13m_3, pSB1A2_5.13m_2, pSB1A2_3.1m_1, pSB1A2_3.1m_5, pSB1A2_3.1m_7
- Checking the transformation of DH5a with A1 (5 colonies) and C1 (7 colonies) using colony-PCR (Primers: tctA_505 Biobrick, data not shown)
- Checking the transformation of DH5a with pSB1C3_tctA_505aa again by colony-PCR (Primers: tctA_505 Biobrick). Only the colonies Nr. 2, 8 and 10 (see above) were checked (2 colonies each).
 Colony-PCR of colonies 2,8 and 10 from transformation with tctA 505aa. Marker: 1kb DNA ladder, NEB

- Another colony-PCR of DH5a_pXy19_Ara (Primers: Ara_RBS). The positive colonies were used for fluid culture (data not shown).
- Miniprep (Fermentas Kit) and Nanodrop measurement of:
- A5.13m_2 : 191.2 ng/µl 260/280= 1.84
- A5.13m_3 : 168.1 ng/µl 260/280= 1.78
- A2.5 : 193.0 ng/µl 260/280= 1.83
- A3.1m_5 : 146.1 ng/µl 260/280= 1.82
- A3.1m_1 : 250.1 ng/µl 260/280= 1.84
- A4.2m_4 : 124.8 ng/µl 260/280= 1.85
- Restriction digest of A5.13m_2, A5.13m_3, A3.1m_1, A3.1m_5, A2.5, A4.2m_4 with EcoRI and SpeI. The restriction was done to enable the ligation of the mutated genes into pSB1C3. Afterwards DH5a was transformed with the ligation product.
- Miniprep (Fermentas Kit) and Nanodrop measurement of:
- C505_2_2 : 253.6 ng/µl 260/280= 1.60
- C505_2_3 : 274.7 ng/µl 260/280= 1.88
- C505_8_2 : 462.1 ng/µl 260/280= 1.38
- C505_8_3 : 149.1 ng/µl 260/280= 1.84
- C505_10_3 : 160.4 ng/µl 260/280= 1.98
- Restriction digest of the Miniprep products with EcoRI and EcoRI/SpeI. Afterwards the restriction products were analyzed by Agarose gel electrophoresis.
 Restriction of miniprep. Gel loading: uncut, cut once, cut twice. C505_2_3 und C505_8_2 were selected for mutagenic PCR. Marker: 1kb DNA ladder, NEB

- Restriction digest of pSB1C3 with EcoRI and SpeI
- Restriction digest of pXylE with EcoRI and XbaI and of Ara with EcoRI and SpeI. Dephosphorylation of pXylE. Ligation of pXylE and Ara
Results
- Miniprep of the DH5a-Colonies with the mutated genes and restriction analysis
- Sequencing of the mutated genes
- Amplification and restriction of gene 2, 3, 4 and 5 for Ligation into pSB1C3
- Successfull isolation of Ara, Ligation with XylE
week 9 (16.-20.07.12)
- mutagenic PCR of C505_2_3 and C505_8_2. (Primers: tctA_505_PstI, did not work, data not shown)
- PCR of tct_B162m and tct_B197m with primer to add a RBS in front and behind the gene (Primers: tctB_162_RBS, tctB_197_RBS)
- Restriction digest of the PCR products with EcoRI and SpeI for ligation into pSB1C3_5.13m (tphC)
- Miniprep (Fermentas Kit) and Nanodrop measurement of:
- C3.1m_1 : 278.9 ng/µl 260/280= 1.88
- C4.2m_4 : 214.2 ng/µl 260/280= 1.86
- 5.13m_3 : 256.3 ng/µl 260/280= 1.88
- C2.5_2 : 44.8 ng/µl 260/280= 2.00
- C5.13m_2 : 60.8 ng/µl 260/280= 1.89
Results
- We added successfully a RBS in front and behind gene 2 and 4
- We added successfully a RBS on Ara
- First mutagenic PCR on gene 1 didn't work
week 10 (23.-27.07.12)
- Restriction digest of pSB1C3_5.13m_3_2 and pSB1C3_5.13m_3_3 with EcoRI and XbaI. Afterwards the products are ligated with RBS_tctB162m_RBS and RBS_tctB197_RBS each.
- Restriction digest of A3.1m_1 for Ligation with Ara
- Restriction of pXylE for ligation with Ara_RBS
- PCR of Ara_RBS and Ara for ligation into pXylE and pSB1C3 (Primers: Ara_RBS). Afterwards restriction digest with restriction enzymes: Ara_RBS is cut with with EcoRI and SpeI and Ara is cut with EcoRI and XbaI
- Ligation of the restricted PCR-products to: pSB1A2_tctB197_tphCm, pSB1C3_tctB162m_tphCm, pSB1C3_tct197_tphCm, pSB1A2_tctB162m_tphCm, pSB1A2_Ara_tctA503m, pSB1C3_Ara_tctA503m, pSB1A2_Ara_XylE and transformation into DH5a
- mutagenic PCR of 505_8_2 (Primers: tctA_505_PstI)
Results
- Ligation of gene RBS_2_RBS and RBS_4_RBS with gene 5 and transformation into DH5a
- Ligation of gene 3 with Ara_RBS and transformation into DH5a
- Mutagenic PCR of gene 1
week 11 (30.07.-03.08.12)
- Checking transformation of DH5a by colony-PCR: pSB1A2_tctB197_tphCm, pSB1C3_tctB162m_tphCm, pSB1C3_tct197_tphCm, pSB1A2_tctB162m_tphCm, pSB1A2_Ara_tctA503m, pSB1C3_Ara_tctA503m, pSB1A2_Ara_XylE (Primers: VF2, VR). Positive colonies are picked and used for inoculation of fluid media.
- Miniprep (Fermentas Kit) of fluid culture and Nanodrop measurement of:
- pSB1C3_503 : 110.0 ng/µl 260/280= 1.82
- pSB1A2_tctB197_tphCm : 32.0 ng/µl 260/280= 2.10
- pSB1A2_Ara_tctA503m : 202.0 ng/µl 260/280= 1.78
- pSB1A2_tctB162m_tphCm : 36.5 ng/µl 260/280= 1.91
- pSB1C3_Ara_tctA503m : 133.2 ng/µl 260/280= 1.83
- pSB1C3_tctB162m_tphCm : 35.2 ng/µl 260/280= 1.93
- pSB1C3_tct197_tphC : 30.6 ng/µl 260/280= 1.88
- Restriction digest of pSB1A2_Ara_tctA503m, pSB1C3_Ara_tctA503m, pSB1A2_tctB162m_tphCm and pSB1C3_tctB162m_tphCm and building the final constructs by ligation: pSB1A2_tctA503m_tctB162m_tphCm und pSB1C3_tctA503m_tctB162m_tphCm. Transformation of the final constructs into DH5a.
- Transformation of pSB1C3_503 into DH5a
- Checking the mutagenic PCR product of 505_8_2 and the transformation of DH5a with pSB1C3_503 by PCR (Primers: tctA_505 Biobrick, tctA_503 Biobrick)
- Restriction digest of Ara und C4.2_4_1 using EcoRI and PstI, building pSB1C3_Ara by ligation and transformation of the vector into DH5a
- Miniprep (Fermentas Kit) and Nanodrop measurement of:
- pSB1C3_Ara : 86.7 ng/µl 260/280= 1.83
- pSB1C3_505m : 113.8 ng/µl 260/280= 1.85
- Restriction digest of pSB1C3_505m with PstI. Checking if the restriction site has been successfully removed
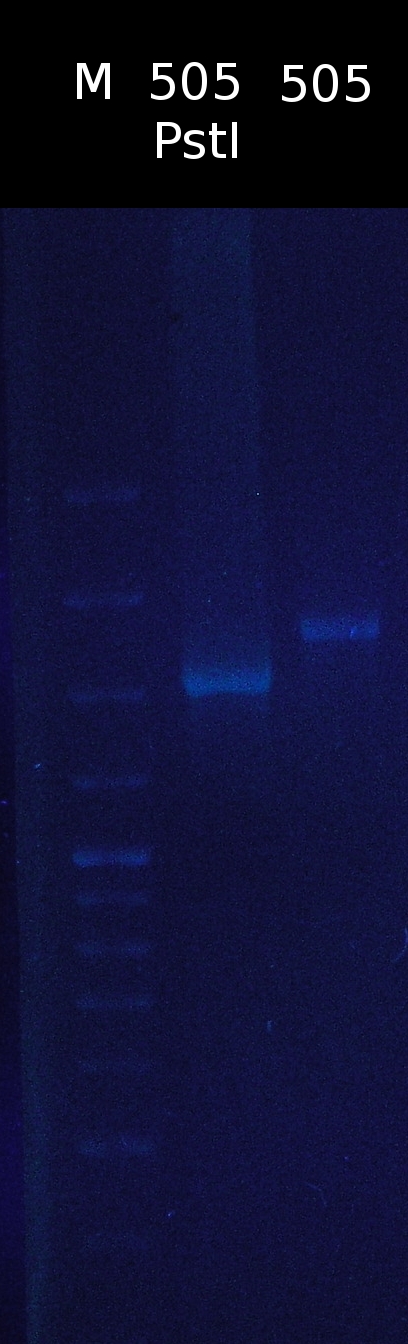 Restriction digest of tctA 505aa after mutagenic PCR. The gel was alternately loaded with digested and uncut PCR products. Restriction site hasn't been removed. Marker: 1kb DNA ladder, NEB

- Screening for transformation of DH5a with pSB1A2_tctA503m_tctB162m_tphCm and pSB1C3_tctA503m_tctB162m_tphCm using colony-PCR (Primers: VF2, VR)
- Checking the constructs pSB1A2/pSB1C3_Ara_503m and pSB1A2/pSB1C3_tctB162m_tphCm by PCR (Primers: VF2, VR)
- Checking if pSB1A2_tctB162m_tphCm and pSB1C3_tctB162m_tphCm have the right Prefix/Suffix by digesting both with EcoRI and XbaI and with EcoRI and PstI [*]
- Ligation of pSB1A2_tctB162m_tphCm and pSB1C3_tctB162m_tphCm with Ara_503
- Miniprep (Fermentas Kit) and Nanodrop measurement of:
- pSB1A2_tctB162m_tphCm_1 : 45.3 ng/µl 260/280= 1.90
- pSB1A2_tctB162m_tphCm_2 : 74.5 ng/µl 260/280= 1.82
- pSB1C3_tctB162m_tphCm_1 : 95.8 ng/µl 260/280= 1.86
- pSB1C3_tctB162m_tphCm_2 : 85.7 ng/µl 260/280= 1.81
- pSB1C3_tctB162m_tphCm_3 : 100.1 ng/µl 260/280= 1.84
- pSB1C3_tctB162m_tphCm_4 : 79.9 ng/µl 260/280= 1.88
- pSB1C3_tctB162m_tphCm_5 : 89.8 ng/µl 260/280= 1.85
- Sequencing pSB1A2_tctB162m_tphCm_2 and pSB1C3_tctB162m_tphCm_5
Results
- Restriction of the construct build in week 10 and ligation to the final construct Operon 1. Transformation into DH5a
- We checked the mutagenic PCR of gene 1. The restriction site wasn't removed
- Ligation of gene 3 into pSB1C3
- Ligation of Ara into pSB1C3
- Sequencing pSB1A2_tctB162m_tphCm_2 and pSB1C3_tctB162m_tphCm_5
week 12 (06.-10.08.12)
- Miniprep (Fermentas Kit) and Nanodrop measurement of:
- pSB1A2_tctB162m_tphCm_2 : 55.7 ng/µl 260/280= 1.81
- pSB1C3_tctB162m_tphCm_5 : 101.2 ng/µl 260/280= 1.92
- Mutagenic PCR of pSB1C3_505_8_2 (Primers: tctA_505_PstI) and subsequent transformation into DH5a
- Ligation of Ara_503m with pSB1A2_tctB162m_tphCm/pSB1C3_tctB162m_tphCm and subsequent transformation into DH5a. Screening the transformants using colony-PCR (Primers: VF2, VR)
 Control of ligation (10 colonies tested). Only colony 1, 2 and 3 have the right insert. Marker: 1kb DNA ladder, NEB

- Miniprep (Fermentas Kit) and Nanodrop measurement of:
- pSB1A2_Ara_tctA503m : 278.0 ng/µl 260/280= 1.86
- pSB1C3_Ara_tctA503m : 169.0 ng/µl 260/280= 1.87
- pSB1C3_Ara_1 : 59.0 ng/µl 260/280= 1.90
- pSB1C3_Ara_4 : 55.5 ng/µl 260/280= 1.80
- pSB1C3_Ara_tctA503m_tctB162m_tphCm : 188.8 ng/µl 260/280= 1.86
- pSB1C3_Ara_tctA503m_tctB162m_tphCm :168.8 ng/µl 260/280= 1.84
- pSB1C3_Ara_tctA503m_tctB162m_tphCm :271.3 ng/µl 260/280= 1.85
- pSB1C3_Ara_XylE : 149.8 ng/µl 260/280= 1.86
- pSB1C3_tctB197_tphC : 95.8 ng/µl 260/280= 1.84
- pSB1A2_tctB197_tphC : 69.0 ng/µl 260/280= 1.88
- Sequencing of 3 different pSB1C3_Ara_tctA503m_tctB162m_tphC
- Analysis of mutagenic PCR products of 505_8_2 and restriction digest with PstI
- Restriction digest of tctA 505aa after mutagenic PCR. The gel was alternately loaded with digested and uncut PCR products. Restriction site hasn't been removed. Marker: 1kb DNA ladder, NEB
 Restriction digest of tctA 505aa after mutagenic PCR. The gel was alternately loaded with digested and uncut PCR products. Restriction site has successfully been removed. Marker: 1kb DNA ladder, NEB

- Restriction digest of Ara_RBS with EcoRI and SpeI and of pSB1C3_505m with EcoRI and XbaI. Building pSB1C3_Ara_505m by ligation and subsequent transformation into DH5a.
Results
- Successful mutagenic PCR of gene 1 and transformation into DH5a
- Ligation of Ara and gene 1 into pSB1C3 and transformation into DH5a
week 13 (13.-17.08.12)
- Restriction digest of pSB1C3_197_tphCm with EcoRI and XbaI
- Checking the transformation of DH5a with pSB1C3_Ara_505m by using colony-PCR (Primers: VF2, VR)
 Colony-PCR of DH5a with pSB1C3_Ara_505m. All Colonies are positive. Marker: 1kb DNA ladder, NEB

- Sequencing pSB1C3_Ara_XylE, pSB1C3_Ara_tctA503m_tctB162m_tphCm (=Operon1), pSB1C3_505m
- Restriction digest of Ara_RBS with EcoRI and SpeI and of pSB1C3_tphCm with EcoRI and XbaI. Building pSB1C3_Ara_tphCm by ligation and subsequent transformation into DH5a
- Restriction digest of pSB1C3_Ara_tctA505m with EcoRI and SpeI. Ligation of Ara_tctA505m and tctB197_tphCm into pSB1C3
Results
- Checking the Transdormation of pSB1C3_Ara_505m
- Sequencing pSB1C3_Ara_XylE, pSB1C3_Ara_tctA503m_tctB162m_tphCm (=Operon1), pSB1C3_505m
- We created pSB1C3_Ara_tphCm by ligation
week 14 (20.-24.08.12)
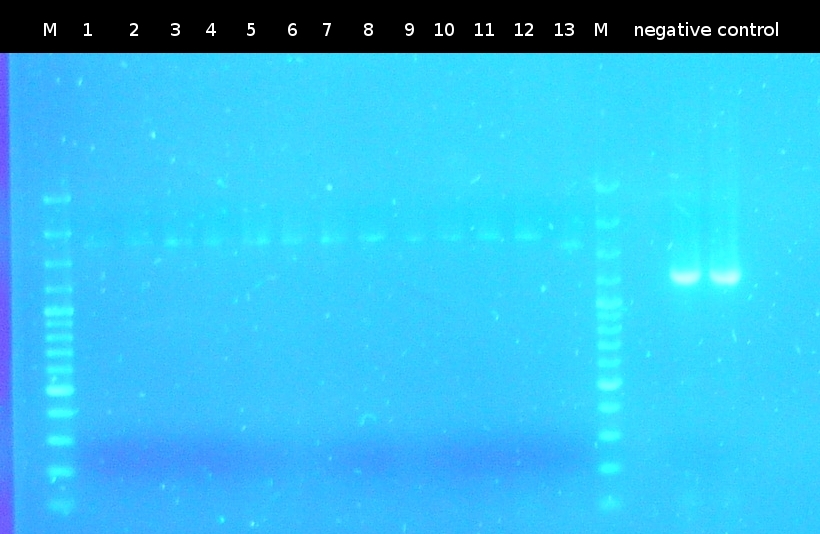
- Checking the transformation of DH5a with pSB1C3_Ara_tphCm using colony-PCR (Primers: VF2, VR)
 Colony-PCR of the transformation of DH5a with pSB1C3_Ara_tphCm. Colonies 1, 2, 3, 4, 5, 6, 9,10 and 11 are positive. Marker: 1kb DNA ladder, NEB

Result Ara_tphC was designed
Week 15-19 charakterization and uptake tests
- Restriction digest of pSB1C3_Ara_tphCm and pSB1C3_Ara_tctA505m with PstI and SpeI
- Restriction digest of pSB1C3_197_tphCm with XbaI and PstI.
- Building the construct pSB1C3_Ara_tctA505m_197_tphCm (= Operon2) by ligation. Subsequent transformation into DH5a
- Checking the transformation of DH5a with Operon2 using colony-PCR (Primers: VF2, VR)
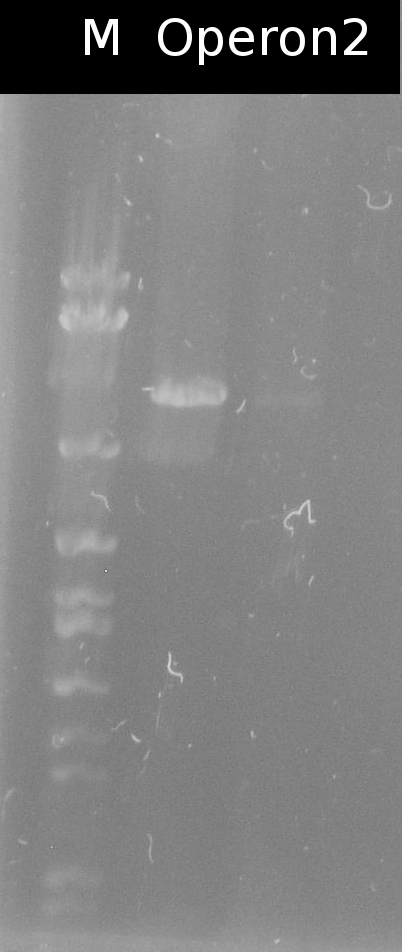 Colony-PCR of transformation of DH5a with Operon2. Marker: 1kb DNA ladder, NEB

- Overexpression of designed parts in E. coli C43 (DE3) to verificating the protein expression and isolation of membranes for SDS-PAGE

Three different overnight culture of E Coli strain C43(DE3) carrying putative terephtalate Operon1 ), putative terephtalate Operon2 (BBa_K808007 ) and AraC-Pbad plasmids (BBa_K808000 ) was inoculated 1:100 into fresh 100 mL LB media. At the OD 600 of 0,8-1,0 0,02 % L-(+)-Arabinose (inducer) was added to the cultures and incubated at room tempreture (RT)and shaking at 230 rpm for 6 hours. After the incubation the culltures were centrifuged at 10.00xg and washed 2 times in 5 mL phosphate buffer saline buffer (PBS) and resuspenden in 5 mL PBS. Phenylmethylsulfonyl fluoride (PMSF,1 mM final concentration) and DNAse II (100 U/mL final concentration) was added to the resuspenden cultures and the cells were broked down for 2 times with french press at 10.000 psi. To remove of unbroked cell and debris a centrifugation at 12.000xg for 20 min followed. The supernatan was transfered into a ultrazentrifugation tubes and centrifugated at 100.000xg for 45 min to collect membranes. The pelletts were resuspended in 300 µL PBS and were used as a sample to perfomed a SDS-PAGE. (Fig.1)
Result
Figure 1 showes no significant protein band. It suggest, that the SDS as a detergent was a wrong choice or the expression of the membrane proteins was to low to detect it, but it´s well known that membrane proteins exhibit a low expression level and thus not able to detect with conventinal SDS-PAGE. For futher analyses we have to amplify the signal with a antibody staining (Conventional Western-Blot analysis).
- Charakterisation of the AraC-Pbad
The charakterization of the AraC-Pbad is described here
Uptake
To verify the corellation between the designed putative terephtalate uptake operons and the uptake of TPA in E. coli, we used three strategies to detected the uptake.
- Photometry
- Gas chromatography–mass spectrometry (GC-MS)
- Energy dispersive X-ray spectroscopy (EDX)
- 1. Photometric measurement of TPA uptake in different media at 240 nm

In the following series differences between solutions of TPA in H2O and other fluids had to be found where upon M9-medium was of main interest, since this was planned to be used as medium for production of the eventually used modified E. coli. The results are represented in series 2 (green graph). The tight gap between the two curves led us to the decision that their differences was of no significance for our further measurements. An overnight cultures of 'E. Colis DH5apha carrying putative terephtalate Operon1, putative terephtalate Operon2 were inoculated 1:100 in a freshly 10 mL M9 minimal medium cultivated shaking at 230 rpm at 30°C. At the OD600 of 0.5 0.001 % L-(+)-Arabinose(inducer) and 100 µM TPA was added and incubated for 6 hours at 30 °C and shaked at shaking 230 rpm. Every hour 500 µL of the cultures was transfered into a 1.5 mL Eppendorf cup and centrifuged at 17xg to spin down the cells for 5 min. Afterwards the TPA concentration was measured at 240 nm.
Result
This strategy did not work. The M9 minimal medium had an absorbation at 240 nm after E. colis were incubated until the OD600 of 0.5. Our assumption is that lyseted E. colis DH5alpha are responsible for the absorbation or E. colis secreteting moleculs into the medium, which are absorbats at 240 nm.
- 2. Preparation of E. coli strain C43(DE3) carrying the putative terephtalate Operon1, putative terephtalate Operon2 and AraC-Pbad plasmids for the Gas chromatography–mass spectrometry (GC-MS)
Three different overnight culture of E. colis C43(DE3) carrying putative terephtalate Operon1,putative terephtalate Operon2 and AraC-Pbad plasmids were inoculated 1:100 into fresh 100 mL LB medium. 0,001% L-(+)-Arabinose (inducer) was added at the optical density (OD600) of 1.3-1.4 and incubated at 30°C for 2 hour, shaked at 230 rpm. Afterwards 2 mL of each cultures were transferred to a new 2 mL Epppendorf cup with each 50,-100,-150, -200,-250,-300,- µM TPA and incubated on a heating-block at 30 °C, shaked at 1000 rpm for 5 hours. After the incubation the cultures were centrifuged at 17.000xg for 15 min. The culture with 100 µM TPA cultures were chosed for GC-MC measurment.The supernatan was transferred into a new Eppendorf cup and the protocol sample preparation for GC-MS was accomplished.
Result
We successfully showed that we are able to qualify and thus quantify TPA-di-methyl-ester via GC-MS. Furthermore, we quantified the operon 1 and operon 2 sample of the transport group. Summarising, we obtained the following peak-areas: operon-1: 43113 operon-2: 38700 control : 32729 Interestingly, we measured a lower concentration of TPA in our control sample. The reason for this might be that the OD of our control sample was higher (0.85) than the OD of our biological samples. Notably, that our untransformed bacteria is able to take TPA up into the periplasma. Nonetheless, due to the the analysis, we measured significant differences in our peak areas. The delta of 4413 digits of Operon-1 to Operon-2 is may be result of a working TPA transport system. For further work we have to measure more samples (biger statistic), measure a control which contains only TPA in the cycl.hexan matrix and using constant ODs by the sample preparations. Moreover, the results have to be compared to HPLC-MS measurements. Unfortunately, the wiki freeze is today, so we are not able to measure again (this time.
For more details: https://2012.igem.org/Team:TU_Darmstadt/Protocols/GC-MS/Results
- 3. Preparation of E. colis C43(DE3) for the energy dispersive X-ray spectroscopy (EDX)

Three different overnight culture of E. colis C43(DE3)' carrying putative terephtalate Operon1, putative terephtalate Operon2 and AraC-Pbad plasmids was inoculated 1:100 into fresh 100 mL LB media. At the OD 600 of 0.8 - 1.0 0.02 % L-(+)-Arabinose (inducer) was added to the cultures and incubated at room tempreture (RT) for 5 hours, shaking at 230 rpm. After the incubation the cultures were cenrifuged 15 min at 10.00xg and the pelletes were prepared for the energy dispersive X-ray spectroscopy (EDX). The cells had to be fixed, embedded in a SPURR-embedding medium (resin) and cut in to small rectangles smaller than 100 nm. For more details: EDX Preparation of Escherichia Coli for the energy dispersive X-ray spectroscopy (EDX) The embedded E. Colis was checked under an electron microscope
Result
The spectra show a clear difference between background and sample measurement. In the background spectra no nitrogen (N) and phosphor (P) occurs. These elements are perfect markers for biological material. Although there is nor clear evidence for the uptake of TPA into the cells. The TAM-EDX experimental set up is a good method to achieve this goal. Unfortunately time is short in the iGEM competition, otherwise we would add a heavy atom like bromide or chloride to TPA. As seen in the spectra non of this elements occur in our sample, which would make it possible to clearly identify the source of a Br/Cl peak as TPA.
For more details: TEM-EDX measurment