 "
"
File:IGEM attenuation diagram 1 12.09.23.png
From 2012.igem.org
No higher resolution available.
IGEM_attenuation_diagram_1_12.09.23.png (322 × 488 pixels, file size: 46 KB, MIME type: image/png)
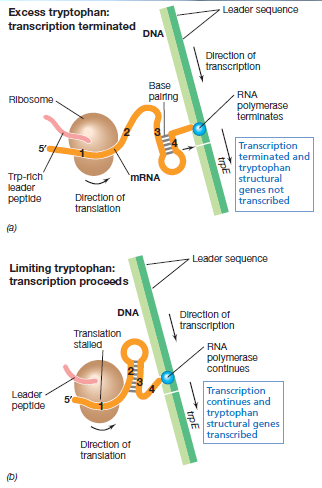
diagram of attenuation in tryptophan operon
File history
Click on a date/time to view the file as it appeared at that time.
| Date/Time | Thumbnail | Dimensions | User | Comment | |
|---|---|---|---|---|---|
| current | 11:37, 23 September 2012 | | 322×488 (46 KB) | Pascoe.J.Harvey (Talk | contribs) | (diagram of attenuation in tryptophan operon) |
File links
The following page links to this file: